


Abstract
Whether 18F-FDG PET can detect inflammation in the coronary arteries remains controversial. We examined 18F-FDG uptake at the culprit sites of acute myocardial infarction (AMI) after percutaneous coronary stenting (PCS) by coregistering PET and coronary CT angiography (CTA). Methods: Twenty nondiabetic patients with AMI (median age, 62 y; 16 men and 4 women) and 7 nondiabetic patients with stable coronary artery disease (CAD; median age, 67 y; 4 men and 3 women) underwent 18F-FDG PET and coronary CTA 1–6 d after PCS of culprit stenoses. After a low-carbohydrate dietary preparation and more than 12 h of fasting, 480 MBq of 18F-FDG were injected, and PET images were acquired 3 h later. Helical CTA was performed on a dual-source scanner. Stent position on attenuation-correction noncontrast CT and CTA was used to fuse PET and CTA. Two experienced readers masked to patient data independently quantified maximum target-to-background ratio (maxTBR) at each PCS site. A maxTBR greater than 2.0 was the criterion for significant uptake. Results: Compared with stable CAD patients, more AMI patients exhibited a PCS site maxTBR greater than 2.0 (12/20 vs. 1/7, P = 0.04). More AMI patients were active smokers (9/20 vs. 0/7 in stable CAD, P = 0.03). After adjusting for baseline demographic differences, stent–myocardium distance, and myocardial 18F-FDG uptake, presentation of AMI was positively associated with a PCS site maxTBR greater than 2.0 (odds ratio, 31.6; P = 0.044). Prevalence of excess myocardial 18F-FDG uptake was similar in both populations (8/20 AMI vs. 3/7 stable CAD, P = 0.89). Conclusion: Systematic fusion of 18F-FDG PET and coronary CTA demonstrated increased culprit site 18F-FDG uptake more commonly in patients with AMI than in patients with stable CAD. However, this approach failed to detect increased signal at the culprit site in nearly half of AMI patients, highlighting the challenging nature of in vivo coronary artery plaque metabolic imaging. Nonetheless, our findings suggest that imaging of coronary artery inflammation is feasible, and further work evaluating 18F-FDG uptake in high-risk coronary plaques prior to rupture would be of great interest.
Rupture of coronary arterial plaque leads directly to the clinical consequences of acute myocardial infarction (AMI) and associated complications, including sudden cardiac death. Elevated macrophage content and histologic evidence of inflammation are major hallmarks of ruptured plaque (1–3). This finding has spurred substantial interest in identifying rupture-prone atherosclerotic plaque through noninvasive detection of plaque macrophage content. Thus far, attempts to accomplish this task have principally used 18F-FDG, uptake of which, as measured by PET, has been validated as a surrogate marker of plaque inflammation (4–6). In humans, 18F-FDG PET has demonstrated strong promise in identifying metabolically active carotid artery plaque (7–9).
Imaging 18F-FDG in coronary arterial plaque has been reported and is considerably more challenging than in carotid plaque (10–12). Localization of uptake is made difficult by the small size of coronary artery plaques and coronary artery motion. Furthermore, 18F-FDG uptake by myocardium can interfere with isolation of true pathologic 18F-FDG uptake in nearby structures, including the coronary arteries. A recent study by Rogers et al. coregistered PET images and coronary CT angiography (CTA) to localize coronary arterial 18F-FDG uptake; these investigators showed higher signal at culprit plaque sites in 8 patients with acute coronary syndrome (12). We conducted a prospective study in a larger population of patients with AMI to examine whether culprit plaque sites after percutaneous coronary stenting (PCS) for AMI exhibit elevated 18F-FDG uptake, as compared with sites of PCS for stable coronary artery disease (CAD), using a standardized algorithm to fuse PET and coronary CTA.
MATERIALS AND METHODS
Patient Population
Consecutive adult patients who had undergone successful PCS for AMI or stable CAD at our center were assessed as possible study subjects. AMI was defined by presentation of chest pain consistent with new or worsening angina, followed by detection of troponin I enzyme elevation to >5 times the upper limit of normal (0.05 ng/mL at our center) and peaking within 24 h of presentation. Stable CAD was defined by no suspicion for acute coronary syndrome and at least 1 of the following criteria: ≥1 episode of chest pain consistent with angina beginning >2 wk before PCS, ≥1 mm ST segment depression in contiguous regional leads during exercise testing, >1 segment of inducible wall motion abnormality during exercise or dobutamine echocardiography, or >5% reversible defect on radionuclide myocardial perfusion imaging. Exclusion criteria were prior coronary artery bypass grafting, AMI related to a previously placed stent, placement of >1 stent to treat the culprit stenosis (increased ambiguity of localization of 18F-FDG signal), position of the new stent within 10 mm of a previously placed stent, inability to follow breathing instructions, allergy to iodinated contrast, active hyperthyroidism, pregnancy, diabetes or maximum post-PCS random blood glucose > 150 mg/dL, ongoing infusion of dextrose-based solution, creatinine > 1.5 mg/dL, estimated creatinine clearance < 45 mL/min, any active supraventricular or ventricular tachyarrhythmia, and patient's decision not to participate. This study was approved by our center's institutional review board. All participating patients provided written informed consent.
Enrolled patients underwent cardiac 18F-FDG PET and coronary CTA within 7 d of PCS (median time, 2 d). Both scans were obtained in the same imaging session, using the general scanning protocol shown in Figure 1.
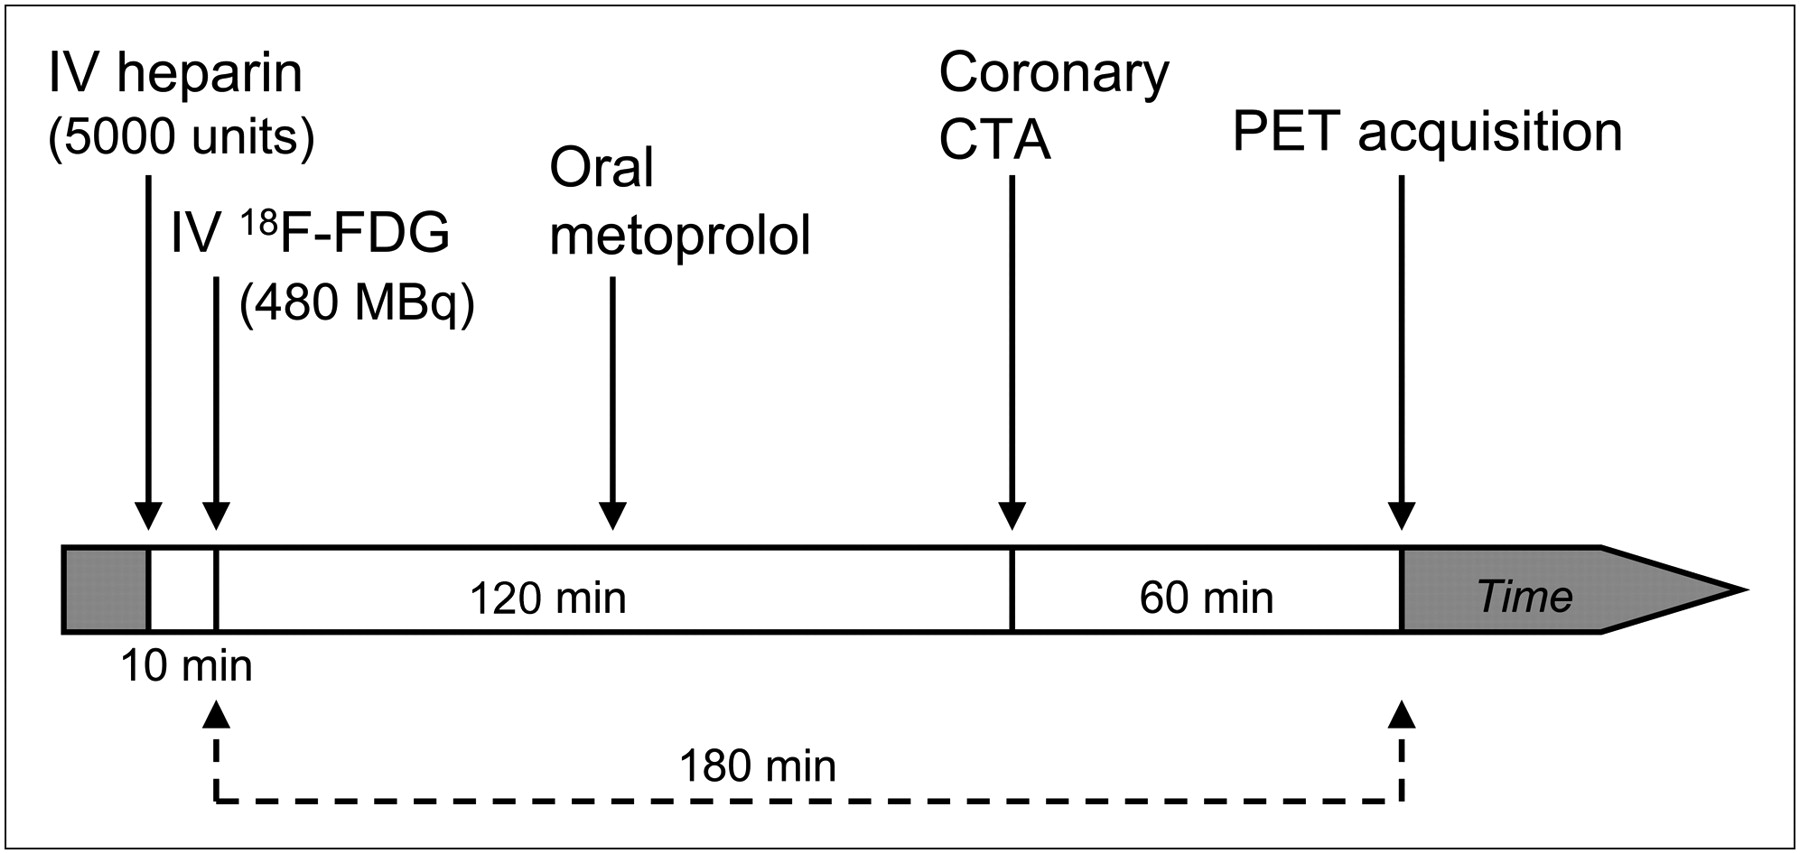
18F-FDG PET and coronary CTA imaging protocol used in study. Ten minutes before administration of intravenous 18F-FDG, 5,000 units of intravenous heparin were given in attempt to shift myocardial metabolism further toward fatty-acid use. After 18F-FDG injection, oral metoprolol was given to control heart rate for CTA, which was performed approximately 60 min before PET image acquisition. Total time from 18F-FDG administration to PET image acquisition was 180 min.
Cardiac 18F-FDG PET Image Acquisition and Reconstruction
PET was performed on a hybrid 4-ring PET/CT scanner (Biograph 64; Siemens Medical Systems). In preparation for imaging, patients ate a low-carbohydrate dinner the night before, followed by fasting until the scan was complete (all patients fasted for >12 h before 18F-FDG injection). Our prior work showed that this approach produced the lowest myocardial uptake (13). Whenever possible, patients were first administered 5,000 units of intravenous heparin on the basis of prior reports that intravenous heparin can augment myocardial fatty acid metabolism (14,15). Ten minutes after heparin injection, 480 MBq of intravenous 18F-FDG were given. Imaging began 3 h afterward (8). Initially, low-dose noncontrast CT for attenuation correction (CTAC) was performed using spiral mode, 3.0-mm slice thickness, 1.5 pitch, 0.5-s rotation time, 24 × 1.2 mm collimation, 120-kVp tube voltage, and 11-mAs tube current. 18F-FDG emission data were then acquired in list mode at 1 bed position (216-mm coverage) with cardiac gating. Patients were instructed to breathe normally during both CT and PET. Emission data were captured for 25–30 min.
Summed images were reconstructed using the first 10 min of emission data. High-definition reconstruction was performed with 4 iterations and 14 subsets and a 2-mm gaussian postprocessing filter (16,17). The reconstruction matrix was 168 × 168 × 109, with a zoom of 2 and voxel size of 2 × 2 × 2 mm. Scatter correction, decay correction, and random correction were applied. CTAC data were used for attenuation correction. The alignment of CTAC and PET was reviewed by an experienced reader to ensure proper coregistration, using the aorta, myocardium, sternum, liver, and vertebral bodies as major landmarks. In all cases, CTAC and PET alignment was found to be optimal.
Coronary CTA Image Acquisition, Reconstruction, and Analysis
CTA was performed on a dual-source CT scanner (Somatom Definition; Siemens Medical Systems). When needed, oral or intravenous metoprolol (oral, ≤100 mg; intravenous, ≤30 mg) was administered to achieve a heart rate of <70 beats per minute. Three to five minutes before image acquisition, 0.4 mg of sublingual nitroglycerin spray (Sciele Pharma) was administered. Eighty milliliters of intravenous contrast (Omnipaque; GE Healthcare) were then power-injected into the antecubital vein, followed by 50 mL of saline at a rate of 5 mL/s. Once >100 Hounsfield units were detected in the ascending aorta, electrocardiogram-gated scanning from the carina to just below the diaphragm was performed in 1 breath-hold. Dose modulation was used in all patients, with maximal current given at between 40% and 70% of the R-R interval (if heart rate was ≥70) or just at 70% (if heart rate was <70). Scanning parameters included heart rate–dependent pitch (0.2–0.45), 330-ms gantry rotation-time, 120-kVp tube voltage, and 330–350 mAs reference tube current. Acquired data were reconstructed in mid diastole and at end systole (if data available) using a 0.6-mm slice thickness (0.75 mm if body mass index was >35 kg/m2), 0.3-mm slice increment, 250-mm field of view, 512 × 512 matrix, and B26f medium-smooth kernel.
Coronary artery anatomy was evaluated by a blinded expert reader using axial images, oblique multiplanar reformations, and oblique maximum intensity projections. The recently placed coronary artery stent was assessed for location and patency. At the proximal and distal ends of the stent, the true short-axis view of the stent was used to measure the shortest distance from the stent edge to ventricular myocardium.
Coregistration and Analysis of Combined 18F-FDG PET and Coronary CTA
Coregistration and analysis of all cases were independently performed by 2 experienced blinded readers using software developed at our center (QPET). CTAC images were fused with CTA images to best overlay the 3-dimensional position of the recently placed stent in both datasets by rigid body alignment (translation in 3 dimensions). These registration parameters were then applied to PET data for fusion with CTA images (Fig. 2). The same coregistration steps were repeated for the ascending aorta at the level of the pulmonary artery bifurcation, using the pulmonary arterial bifurcation as principal landmark. To detect maximal 18F-FDG uptake at the PCS site, a 1 × 1 × 1 cm cubical region of interest centered at the luminal midline of the stented segment was moved from the proximal to distal end of the stent. To explore 18F-FDG in nonculprit coronary arteries, we examined fused PET and CTAC datasets and applied the cubical region-of-interest technique along the left main and proximal coronary arterial segments, using the interventricular and atrioventricular grooves as guiding landmarks. This approach was selected because nonculprit arteries lacked a clearly visible marker (stent), substantially increasing subjectivity when fusing PET and coronary CTA. Mid and distal segments were not included in this analysis to avoid excessive coregistration error, which was expected to increase as the locations of interest move further from the aortic root. To obtain maximal 18F-FDG signal from the ascending aorta at the level of the pulmonary artery bifurcation, 6 regions of interest were evenly spaced along the ascending aortic circumference (in cross-section, corresponding to 12-, 2-, 4-, 6-, 8-, and 10-o'clock positions). The average of maximal 18F-FDG intensity from 4 regions of interest within the left atrial cavity was used to define background signal intensity and facilitate calculation of maximal target-to-background ratio (maxTBR). 18F-FDG signal from the myocardium near the stent was assigned a visual score of 0–3 (0, no uptake; 1, mild uptake; 2, moderate uptake; and 3, dense uptake); a score ≥ 2 was considered excess uptake (inadequate suppression). After completion of independent data collection, results from both readers were reviewed. In the cases in which the difference in maxTBR from independent measurements was ≤0.2, the average of reader values was used as the consensus maxTBR. When the difference in maxTBR between readers was >0.2 (9 cases for PCS site, 5 cases for ascending aorta), repeated coregistration and analysis of the image data were performed to obtain consensus; this was a completely fresh analysis performed by both readers in concert, and the resultant maxTBR could be lower or higher than initial values by both readers. Consensus evaluation of myocardial 18F-FDG uptake was performed whenever readers disagreed regarding the presence of excess uptake (3 cases). MaxTBR > 2.0 was considered evidence of definitely increased 18F-FDG uptake (12).

Case example demonstrating steps used to fuse coronary CTA and PET images at site of stenting. (A) Step 1: default overlay of CTA and PET images. Top row of colored images is from CTA and PET. Bottom row of gray-scale images is from CTA and noncontrast CTAC. CTA clearly shows stent in proximal RCA, marked with thick arrows. There is substantial offset in heart and stent positions of both PET and noncontrast CT relative to CTA (thin arrows denote heart silhouette signal in PET and CTAC). (B) Step 2: CTA and CTAC are superimposed to achieve optimal overlay of stent (thick arrows), and coordinates in which this takes place are recorded. Compared with images in step 1, heart silhouette of CTA and CTAC is much better aligned. (C) Step 3: PET images are superimposed onto CTA images at coordinates determined by step 2. Fused images are then used for quantifying 18F-FDG uptake at stent site. There is visibly increased signal at stent site after fusion (within white circles). This was 69-y-old woman who had acute ST elevation myocardial infarction from culprit plaque in proximal RCA.
Biomarkers
Before initiation of the imaging protocol (i.e., before administration of intravenous heparin and 18F-FDG), blood samples were obtained in 22 patients (16 with AMI, 6 with stable CAD) to measure serum biomarkers of inflammation, including c-reactive protein, erythrocyte sedimentation rate, IgM, interleukin-12p70, oxidized low-density lipoprotein, and tumor necrosis factor α.
Radiation Dose to Patients
Effective radiation dose from coronary CTA was calculated by multiplying the dose–length product (obtained from the scanner) and the overall organ weighing factor for the chest (k = 0.014 mSv × [mGy × cm]−1) (18,19). Effective radiation dose from 480 MBq of 18F-FDG was estimated at 9.1 mSv, using published data (20). Total effective dose was the sum of doses from CTA and PET.
Statistical Methods
Continuous variables were described using median, 25th percentile, and 75th percentile values. Categoric variables were described with frequencies. Comparisons of continuous variables between patients with AMI and patients with stable CAD were made using the Wilcoxon rank-sum test. Comparisons of categoric or binary variables were made using the χ2 test or Fischer exact test, where appropriate. Calculation of the κ-statistic was used to evaluate interreader agreement of maxTBR > 2.0. Pre-PCS variables that differed between AMI and stable CAD patients (active smoking and aspirin therapy), time between completion of PCS and 18F-FDG injection, and predefined postimaging variables (myocardial 18F-FDG signal, minimal distance from proximal and distal ends of the stent to myocardium) were first examined using univariable logistic regression analysis for any potential relationship to maxTBR > 2.0 at the PCS site. These variables were then included with AMI status into a stepwise multivariable logistic regression model, using a maxTBR > 2.0 as outcome. P values of <0.05 were considered statistically significant. All analyses were performed using Stata software (version 10.0; StataCorp LP).
RESULTS
The study population clinical data are described in Table 1, and measures of 18F-FDG uptake for each patient are shown in Table 2. The median age of the study population was 62 y. Twenty patients (74%) were men. Patients with AMI were more frequently active smokers (9/20 vs. 0/7, P = 0.03). Stable CAD patients were more likely to be treated with aspirin before PCS. More time elapsed between successful PCS and 18F-FDG injection in AMI patients (median, 46.7 vs. 22.5 h in stable CAD patients, P = 0.02). There were nonsignificant trends toward more culprit lesions in the right coronary artery (RCA) in patients with AMI (12/20 vs. 2/7, P = 0.15), and more culprit lesions in the left anterior descending artery in patients with stable CAD (4/7 vs. 5/20, P = 0.12). Frequencies of drug-eluting stent use were similar in both populations. Median total estimated effective radiation dose from CTA and PET was 15.5 mSv (interquartile range, 14.6–18.1 mSv).
Preimaging Characteristics of AMI and Stable CAD Patients
Summary of Clinical Presentation and Measures of Stent-Site and Aortic 18F-FDG Uptake in Each Study Patient
In all cases, the newly placed stent was visible on the CTAC, and fusion of PET and coronary CTA at this site was successfully executed. The frequency of excess myocardial 18F-FDG uptake was similar in AMI and stable CAD patients (8/20 vs. 3/7).
Culprit Site 18F-FDG Uptake
As shown in Table 3, AMI patients had a higher frequency of maxTBR > 2.0 at the PCS site (12/20 vs. 1/7, P = 0.04). Examples of 18F-FDG uptake at PCS sites are shown in Figures 3 and 4. Interreader agreement for PCS site maxTBR > 2.0 was found in 25 cases (93%), with a κ-statistic of 0.85 (P < 0.01).
Comparison of Aortic and Stent-Site 18F-FDG Uptake Between AMI and Stable CAD Patients
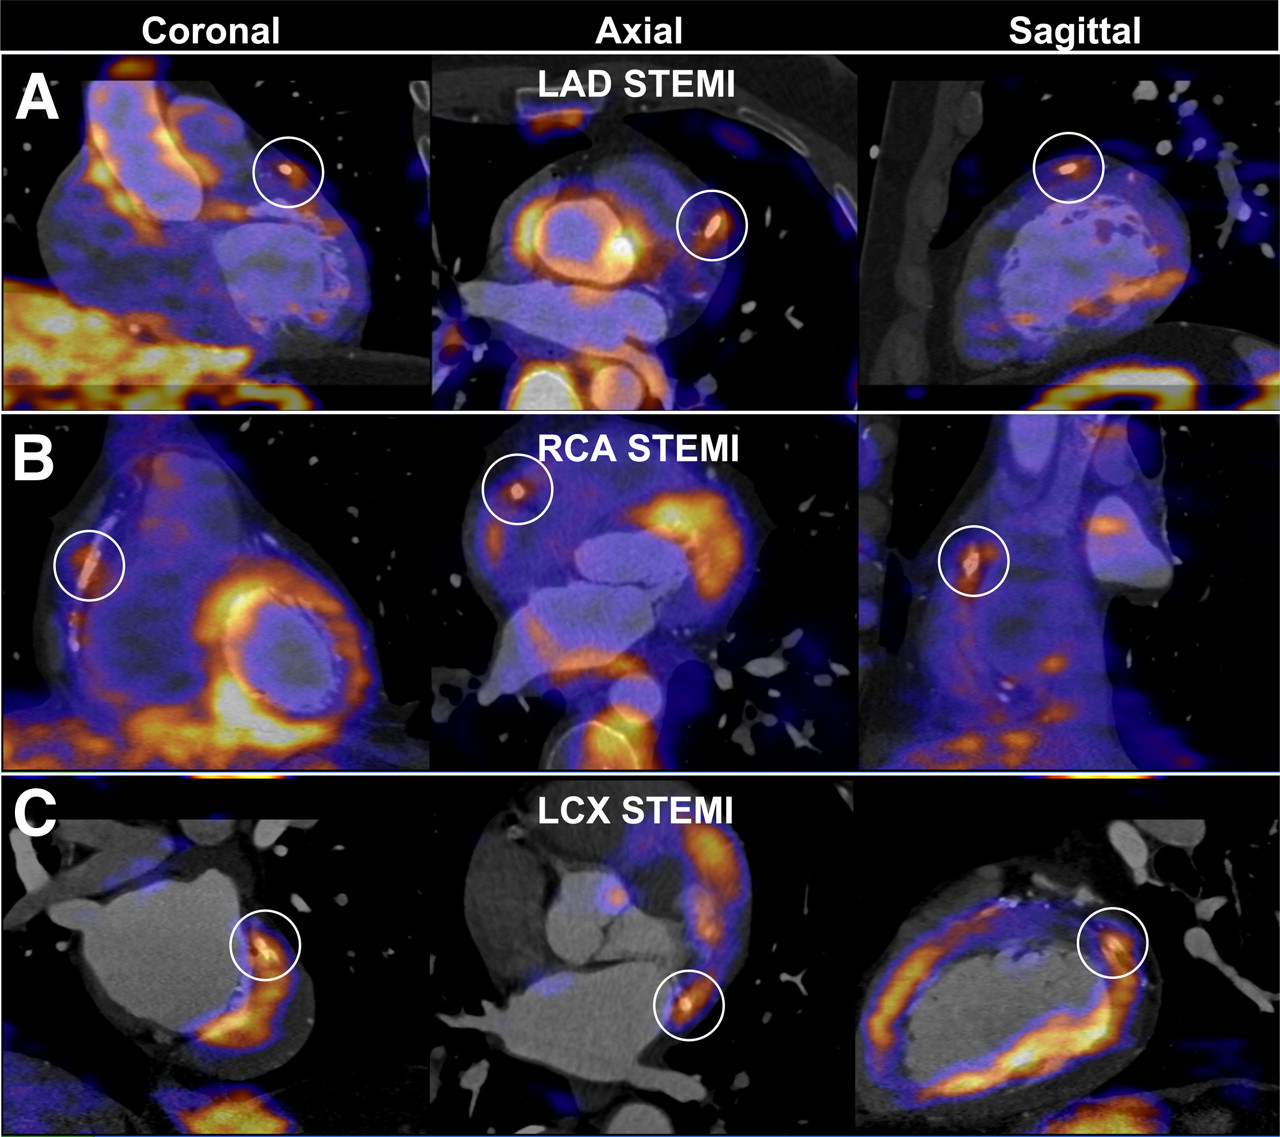
Examples of increased 18F-FDG uptake at stent site in patients with acute ST elevation myocardial infarction (STEMI). (A) A 54-y-old man imaged after percutaneous coronary stenting of proximal left anterior descending artery (LAD) for STEMI. maxTBR at stent site was 2.1 (white circles). (B) A 49-y-old man imaged after stenting of proximal RCA for STEMI. maxTBR at stent site was 2.1. (C) A 71-y-old man imaged after stenting of mid left circumflex artery (LCX) for STEMI. maxTBR at stent site was 4.0.

Examples of low 18F-FDG uptake at stent site in 2 patients with stable CAD. (A) A 71-y-old man imaged after percutaneous coronary stenting of mid RCA for ischemia demonstrated on myocardial perfusion imaging. After fusion of coronary CTA and PET images, stent site maxTBR was 1.5. (B) A 67-y-old man imaged after stenting of proximal left anterior descending artery (LAD) for ischemia on myocardial perfusion imaging. Stent site maxTBR was 1.7.
Rate of active smoking, pre-PCS aspirin use, time between successful PCS and 18F-FDG injection, stent–myocardium distance, and myocardial uptake intensity were evaluated for potential confounding. In univariable regression, the first 4 variables showed no significant relationship to maxTBR or maxTBR > 2.0. There were more cases of PCS site maxTBR > 2.0 when myocardial uptake was high (9/11 vs. 4/16 with low myocardial uptake, P < 0.01). After adjustment for all 5 aforementioned covariates, presentation of AMI was positively associated with occurrence of maxTBR > 2.0 at the PCS site (odds ratio, 31.6; 95% confidence interval, 1.1–905.7, P = 0.044).
Nonculprit Coronary Arterial 18F-FDG Uptake
A maxTBR > 2.0 in the proximal segment of a nonculprit artery was found in 7 AMI patients (35%, including 5 left main, 1 left anterior descending, and 1 left circumflex; maxTBR range, 2.1–3.7) and 1 stable CAD patient (14%, 1 left main; maxTBR, 2.9). This difference was not statistically significant (P = 0.30).
Aortic 18F-FDG Uptake
Coregistration of the ascending aorta at the level of the pulmonary trunk bifurcation was successful in all cases. Aortic maxTBR was not different in patients with AMI and patients with stable CAD (Table 2). Frequencies of patients with aortic maxTBR > 2.0 were low and not different between the groups (3/20 in AMI vs. 1/7 in stable CAD, P = 0.24). Interreader agreement for aortic maxTBR > 2.0 was found in 24 cases (89%), with a κ-statistic of 0.66 (P < 0.01).
Biomarkers
When patients were subgrouped by AMI or stable CAD, C-reactive protein was the lone biomarker that showed a difference (3.8 ± 4.4 in AMI vs. 0.4 ± 0.2 in stable CAD, P = 0.02). When patients were subgrouped by presence of maxTBR > 2.0 at the culprit site, there was no difference in any measured biomarker of inflammation. None of the biomarkers was significantly correlated with culprit site maxTBR.
DISCUSSION
The biochemical cascade that ultimately triggers plaque rupture is intimately tied to increased inflammation (1–3). Elevated 18F-FDG uptake detects such inflammation in active carotid artery plaque (7,8) and has sparked hope that the same may be possible in the coronary arteries. In this exploratory study, we combined PET and coronary CTA to demonstrate the potential of 18F-FDG PET for detecting the expected inflammation at sites of acute coronary arterial plaque rupture in the largest AMI population to date. Patients with AMI showed greater frequency of maxTBR > 2.0 at culprit sites after PCS than did patients with stable CAD.
Dunphy et al. (11) and Wykrzykowska et al. (21) provided early reports of 18F-FDG PET seemingly identifying coronary artery inflammation. Rogers et al. followed these reports by coregistering coronary CTA and PET to detect in vivo culprit plaque site 18F-FDG uptake after PCS. The latter study analyzed 8 patients with acute coronary syndrome (4 with AMI) requiring PCS and 15 patients with stable angina who received PCS, with reported median culprit site maxTBRs of 2.61 and 1.74, respectively (12). In comparison, our population demonstrated lower culprit site maxTBR, particularly patients with AMI (median, 2.1). This difference may have been due to variations in patient population and imaging technique. Most of our AMI population had culprit sites in the RCA (12/20). The RCA travels up to 5 cm during the cardiac cycle (22) and may have diluted 18F-FDG signal from the non–electrocardiogram-gated PET data. We performed imaging at a median of 1 d after PCS rather than the 8 d for acute coronary syndrome and 16 d for stable angina patients as done by Rogers et al. (12). It is possible that the increase in vascular 18F-FDG uptake due to acute plaque rupture may be higher at a later time after rupture. Finally, we used a more objective method for aligning PET and CTA data.
Studies before ours did not address problems posed by coronary artery motion and the often small (subcentimeter) sizes of culprit sites, both of which increase the difficulty of precisely coregistering coronary artery position on PET and CTA. When one is considering coronary artery motion, a major hurdle is in finding a reliable structure whereby the coregistration process can be initiated. One candidate is the aorta, which is usually seen on 18F-FDG PET. Rogers et al. used visible uptake in the ascending aorta on PET to begin coregistration (12). However, the coronary arteries do not move linearly with respect to the aorta during the cardiac cycle, and reliance on aortic root uptake for overlying PET and CTA images leaves structures that are farther from the coronary cusps—such as the coronary arteries—prone to misalignment. To work around this difficulty, we used the visible freshly placed stent in the CTAC as the principal location for fusing PET and CTA images. This technique offered 2 major advantages. First, in every patient, the stent was detectable by both CTAC and CTA, removing dependence on presence of 18F-FDG signal. Second, the stent also directly represented the culprit plaque site. Nevertheless, our approach was subject to the known imprecision from cardiac and respiratory motion when PET data are reconstructed using CTAC (23). As mentioned earlier, coronary artery motion may have played a particularly prominent role in diminishing 18F-FDG signal due to the high frequency of culprit plaques in the RCA. To enhance detection of signal from small structures, we reconstructed PET data using a high-definition algorithm that has been shown to improve spatial resolution (16,17).
Because of the limitations in PET spatial resolution, excess myocardial 18F-FDG uptake can hinder isolation of signal from the adjacent coronary artery. This problem is magnified when patients are imaged shortly after AMI, when both viable myocytes and damaged territories can avidly take up 18F-FDG (24,25). In our study, patients with elevated culprit site uptake often exhibited increased uptake in the neighboring myocardium. Although other groups have shown reduction in myocardial uptake by preparing patients with a high-fat diet before 18F-FDG injection (12,21,26,27), this technique was used in clinically stable patients, not 1–2 d after AMI, when many of our study patients were imaged. Furthermore, the safety and tolerability of ingesting a highly fatty meal within days of an acute myocardial infarction has not been confirmed. We chose a low-carbohydrate diet, followed by extended fasting, which is easily tolerated by patients with uncomplicated AMI and has demonstrated favorable myocardial signal-suppressing results at our center (13).
Although Rogers et al. also described increased aortic 18F-FDG uptake in patients with acute coronary syndrome, we found no difference in ascending aortic uptake between AMI and stable CAD patients. Two factors may have contributed to this difference. First, to improve precision of coregistration, we evaluated the aorta at a more cranial site (at the level of the pulmonary artery bifurcation). Second, the stable angina population studied by Rogers et al. included 10 patients in whom no PCS was performed. These patients likely experienced much less catheter manipulation within the aorta and subsequent trauma-related inflammation.
We detected no relationship between levels of inflammatory biomarkers and culprit site 18F-FDG uptake, contrasting with the population studied by Rogers et al., in whom culprit site maxTBR positively correlated with C-reactive protein, IgM, interleukin-12p70, and tumor necrosis factor α (12). Because both studies included small numbers of patients, the discrepancy may have been due to chance. Nevertheless, our finding is consistent with coronary artery inflammation as primarily a local phenomenon and hence much more likely to be detected by targeted imaging than systemic biomarkers.
Our exploratory work has several limitations. This study was designed to evaluate the feasibility of combined 18F-FDG PET and coronary CTA imaging of culprit site metabolism in AMI patients and thus included a small sample size. To avoid delay of timely revascularization for study patients, imaging was performed after PCS, removing the possibility of detailed assessment of the underlying culprit plaques. Fusion of PET and CTA used CTAC and was thus dependent on the quality of initial PET and noncontrast CT coregistration. Our results from this technique suggest that detection of coronary artery 18F-FDG uptake may be possible without CTA, provided that PET and CTAC images are optimally aligned. In addition, our coregistration method required the presence of a stent to mark the culprit plaque site. The contribution of in vivo acute (<7 d) local inflammation from the act of stent placement is unknown and was not measured in our study. However, this phenomenon would have been present in both AMI and stable CAD settings and therefore, if present, was unlikely to confound our results. Although rates of statin therapy at the time of PCS were similar among our AMI and stable CAD patients, we did not have data regarding treatment duration and dosage, which have been associated with attenuation of arterial 18F-FDG signal (28,29). Increased 18F-FDG uptake was assumed to represent increased inflammation based on prior work, because obtaining histology at PCS sites was not possible. Finally, as a work intended to demonstrate proof of concept, we did not study patients in whom this form of imaging might be clinically useful—the target population of coronary artery 18F-FDG imaging will likely be high-risk patients who have not experienced an event or undergone revascularization.
CONCLUSION
In our exploratory study, systematic fusion of 18F-FDG PET and coronary CTA showed increased culprit site 18F-FDG uptake more commonly in patients with AMI than in patients with stable CAD. However, this approach failed to detect increased signal at the culprit site in nearly half of AMI patients, highlighting the challenging nature of in vivo coronary artery plaque metabolic imaging. Nonetheless, our findings suggest that imaging of coronary artery inflammation is feasible, and further work evaluating 18F-FDG uptake in high-risk coronary plaques prior to rupture would be of great interest.
DISCLOSURE STATEMENT
The costs of publication of this article were defrayed in part by the payment of page charges. Therefore, and solely to indicate this fact, this article is hereby marked “advertisement” in accordance with 18 USC section 1734.
Acknowledgments
Dr. Cheng received funding from the Winnick Family General Clinical Research Center (M01-RR00425) and the National Heart, Lung, and Blood Institute (1K23HL107458-01). Dr. Berman received funding from the Lincy Foundation and the Diane and Gilford Glazer Foundation, both in Beverly Hills, California. No other potential conflict of interest relevant to this article was reported.
Footnotes
Published online Mar. 14, 2012.
- © 2012 by the Society of Nuclear Medicine, Inc.
REFERENCES
- Received for publication August 26, 2011.
- Accepted for publication December 16, 2011.


Jump to section
Related Articles
Cited By...
- Inflammation in coronary atherosclerosis: diagnosis and treatment
- Aortic sodium [18F]fluoride uptake following endovascular aneurysm repair
- Aortic sodium [18F]fluoride uptake following endovascular aneurysm repair
- Hot Spot Imaging in Cardiovascular Diseases: An Information Statement from SNMMI, ASNC, and EANM
- Low-dose interleukin 2 for the reduction of vascular inflammation in acute coronary syndromes (IVORY): protocol and study rationale for a randomised, double-blind, placebo-controlled, phase II clinical trial
- Positron emission tomography imaging in cardiovascular disease
- Can PET/MR Imaging Assess Coronary Artery Plaque Biology?
- Early Detection and Treatment of the Vulnerable Coronary Plaque: Can We Prevent Acute Coronary Syndromes?
- Molecular Imaging of Vulnerable Coronary Plaque: A Pathophysiologic Perspective
- Noninvasive Molecular Imaging of Disease Activity in Atherosclerosis
- Motion Correction of 18F-NaF PET for Imaging Coronary Atherosclerotic Plaques
- A Randomized Trial on the Optimization of 18F-FDG Myocardial Uptake Suppression: Implications for Vulnerable Coronary Plaque Imaging
- Efficient Radiosynthesis of 3'-Deoxy-3'-18F-Fluorothymidine Using Electrowetting-on-Dielectric Digital Microfluidic Chip
- Pioglitazone Decreases Coronary Artery Inflammation in Impaired Glucose Tolerance and Diabetes Mellitus: Evaluation by FDG-PET/CT Imaging
- Reply