


Abstract
The positron emitters 18F, 68Ga, 124I, and 89Zr are all relevant in small-animal PET. Each of these radionuclides has different positron energies and ranges and a different fraction of single photons emitted. Average positron ranges larger than the intrinsic spatial resolution of the scanner (for 124I and 68Ga) will deteriorate the effective spatial resolution and activity recovery coefficient (RC) for small lesions or phantom structures. The presence of single photons (for 124I and 89Zr) could increase image noise and spillover ratios (SORs). Methods: Image noise, expressed as percentage SD in a uniform region (%SD), RC, and SOR (in air and water) were determined using the NEMA NU 4 small-animal image-quality phantom filled with 3.7 MBq of total activity of 18F, 68Ga, 124I, or 89Zr. Filtered backprojection (FBP), ordered-subset expectation maximization in 2 dimensions, and maximum a posteriori (MAP) reconstructions were compared. In addition to the NEMA NU 4 image-quality parameters, spatial resolutions were determined using small glass capillaries filled with these radionuclides in a water environment. Results: The %SD for 18F, 68Ga, 124I, and 89Zr using FBP was 6.27, 6.40, 6.74, and 5.83, respectively. The respective RCs were 0.21, 0.11, 0.12, and 0.19 for the 1-mm-diameter rod and 0.97, 0.65, 0.64, and 0.88 for the 5-mm-diameter rod. SORs in air were 0.01, 0.03, 0.04, and 0.01, respectively, and in water 0.02, 0.10, 0.13, and 0.02. Other reconstruction algorithms gave similar differences between the radionuclides. MAP produced the highest RCs. For the glass capillaries using FBP, the full widths at half maximum for 18F, 68Ga, 124I, and 89Zr were 1.81, 2.46, 2.38, and 1.99 mm, respectively. The corresponding full widths at tenth maximum were 3.57, 6.52, 5.87, and 4.01 mm. Conclusion: With the intrinsic spatial resolution (≈1.5 mm) of this latest-generation small-animal PET scanner, the finite positron range has become the limiting factor for the overall spatial resolution and activity recovery in small structures imaged with 124I and 68Ga. The presence of single photons had only a limited effect on the image noise. MAP, as compared with the other reconstruction algorithms, increased RC and decreased %SD and SOR.
PET with 18F is widely used in a range of applications, using tracers such as 18F-FDG, 18F-fluoromisonidazole, 18F-fluoroazomycin arabinoside, and 18F-fluoro-3′-deoxy-3′-l-fluorothymidine (1). In some applications, other positron-emitting radionuclides are being used in the preclinical setting and have also found their way to clinical PET. The use of positron emitter–labeled monoclonal antibodies that combine the specificity of an antibody with the resolution of PET requires radionuclides with half-lives that match the half-life of antibodies in the circulation (>48 h). With half-lives of 100 and 78 h, respectively, 124I and 89Zr are potentially suitable for this purpose.
In many situations, a generator-produced radionuclide such as 68Ga is preferable over a cyclotron-produced radionuclide (such as 18F, 124I, and 89Zr), because it can be eluted from a generator on-site and does not require a cyclotron in the vicinity of the PET facility. Peptides conjugated to appropriate chelators such as 1,4,7,10-tetraazacyclododecane-1,4,7,10-tetraacetic acid or 1,4,7-triazacyclononane-1,4-7-triacetic acid can be labeled with 68Ga (2).
Some of these radionuclides have disadvantageous properties for PET: for instance, their high positron energy and corresponding large positron range in tissue (e.g., 68Ga and 124I) may reduce the spatial resolution of the image. Also, the presence of single γ-photons (e.g., 124I and 89Zr) can have detrimental effects. Single γ-photons with energy above the lower discriminator value of the energy window can lead to coincidence detections without spatial correlation with the location of the positron emission, leading to an additional, more or less uniform background concentration. Also, higher noise levels can be expected as a result of a higher rate of multiple detections, which effectively decreases the rate of detected true positron annihilation events. Finally, the single γ-photons may influence the dead-time and associated corrections of the scanner.
The effects of large positron range and additional singles emissions can be corrected to some extent. For a small object centered in the field of view (FOV), the emitted single γ-photons produce a uniform distribution of counts (3,4), allowing a simple uniform subtraction to correct for single photons. This is, however, not functional in the present scanner software (Inveon Acquisition Workplace 1.2.2.2 [IAW]; Siemens Medical Solutions). The effects of dead time are corrected for to some degree by the dead-time correction algorithm. The reconstruction software can use scatter correction to reduce the adverse effects of scatter of the annihilation photons on the reconstructed images. Correction for positron range has been described by Bai et al. (5) but is still experimental and not yet available in standard reconstruction software for commercial small-animal PET scanners.
It is relevant to establish the performance of a PET scanner for different radionuclides, not only in terms of spatial resolution and sensitivity but especially with regard to overall image quality. Performance evaluation guidelines for clinical PET scanners have been available for a long time (NEMA NU 2 (6–8)), but guidelines for small-animal PET have been introduced only recently (NEMA NU 4 (9)). For the Siemens Inveon small-animal PET scanner, performance characterizations have been established earlier using 18F or 22Na sources (10–13). The purpose of this study was to compare image-quality parameters of 18F, 68Ga, 124I, and 89Zr using the NEMA NU 4 image-quality phantom.
MATERIALS AND METHODS
PET Scanner
The Siemens Inveon is a high-resolution small-animal PET scanner consisting of 4 rings of 16 lutetium oxyorthosilicate detector blocks. The blocks are composed of 20 × 20 crystals, each 1.5 × 1.5 × 10 mm3. The detector ring diameter of 16.1 cm and axial length of 12.7 cm provide a relatively large maximum acceptance angle of 38.3° (aspect ratio, 0.79), contributing to the high-peak sensitivity exceeding 10% (10,11). Light guides couple the detector blocks to photomultiplier tubes. Emission data are acquired in list mode and can be sorted into 2-dimensional (2D) or 3-dimensional (3D) sinograms. To correct for photon attenuation, transmission measurements with a rotating 57Co point source can be performed.
The reconstruction algorithms available in IAW are filtered backprojection (FBP), 3D reprojection, 2D and 3D ordered-subset expectation maximization (OSEM2D and OSEM3D, respectively), and maximum a posteriori (MAP) reconstruction (14).
Radionuclides
The radionuclides selected for this study are 18F—as it is the most widely used and required for standard image-quality measurements by NEMA NU 4—and the following 3 others (with different properties), which are increasingly used in PET: 124I as a radionuclide with a high positron energy and a high abundance of singles, with an energy within the default 350–650 keV window; 68Ga, which also emits high-energy positrons but only an insignificant amount of singles; and 89Zr, which does not have high-energy positron emission and for which the specific challenge lies in the abundance of singles. With an energy of 909 keV, these photons fall outside the default energy window, apart from a portion of the down-scattered photons with lower energy. Their high yield (0.99 γ-photons vs. 0.23 positrons) could contribute to the detector dead time. An overview of the physical properties of the radionuclides is presented in Table 1 (15,16).
Physical Properties of 18F, 68Ga, 124I, and 89Zr
18F, 124I, and 89Zr were obtained from BV Cyclotron VU. The respective agents were 18F-FDG, a Na124I solution in 0.1 M NaOH, and a desferrioxamine-conjugated antibody labeled with 89Zr in NaCl–gentisic acid with 0.5% bovine serum albumin. 68GaCl3 was eluted with 0.1 M HCl from a (TiO-based) 68Ge/68Ga generator (Cyclotron Co.).
NEMA NU 4 Image-Quality Phantom
The NEMA NU 4-2008 image-quality phantom is a 50-mm-long, 30-mm-diameter cylinder made of polymethylmethacrylate and consists of different regions to analyze 3 distinct aspects of image quality. A schematic view of the phantom is shown in Figure 1. The first 20 mm of the phantom body are solid, with 5 fillable rods with diameters of 1, 2, 3, 4, and 5 mm. These are used to determine the recovery coefficient (RC), defined as the ratio between the measured activity concentration in the rods and the activity concentration measured in the uniform area. The RC is theoretically limited between 1 and 0 (0 < RC ≤ 1).
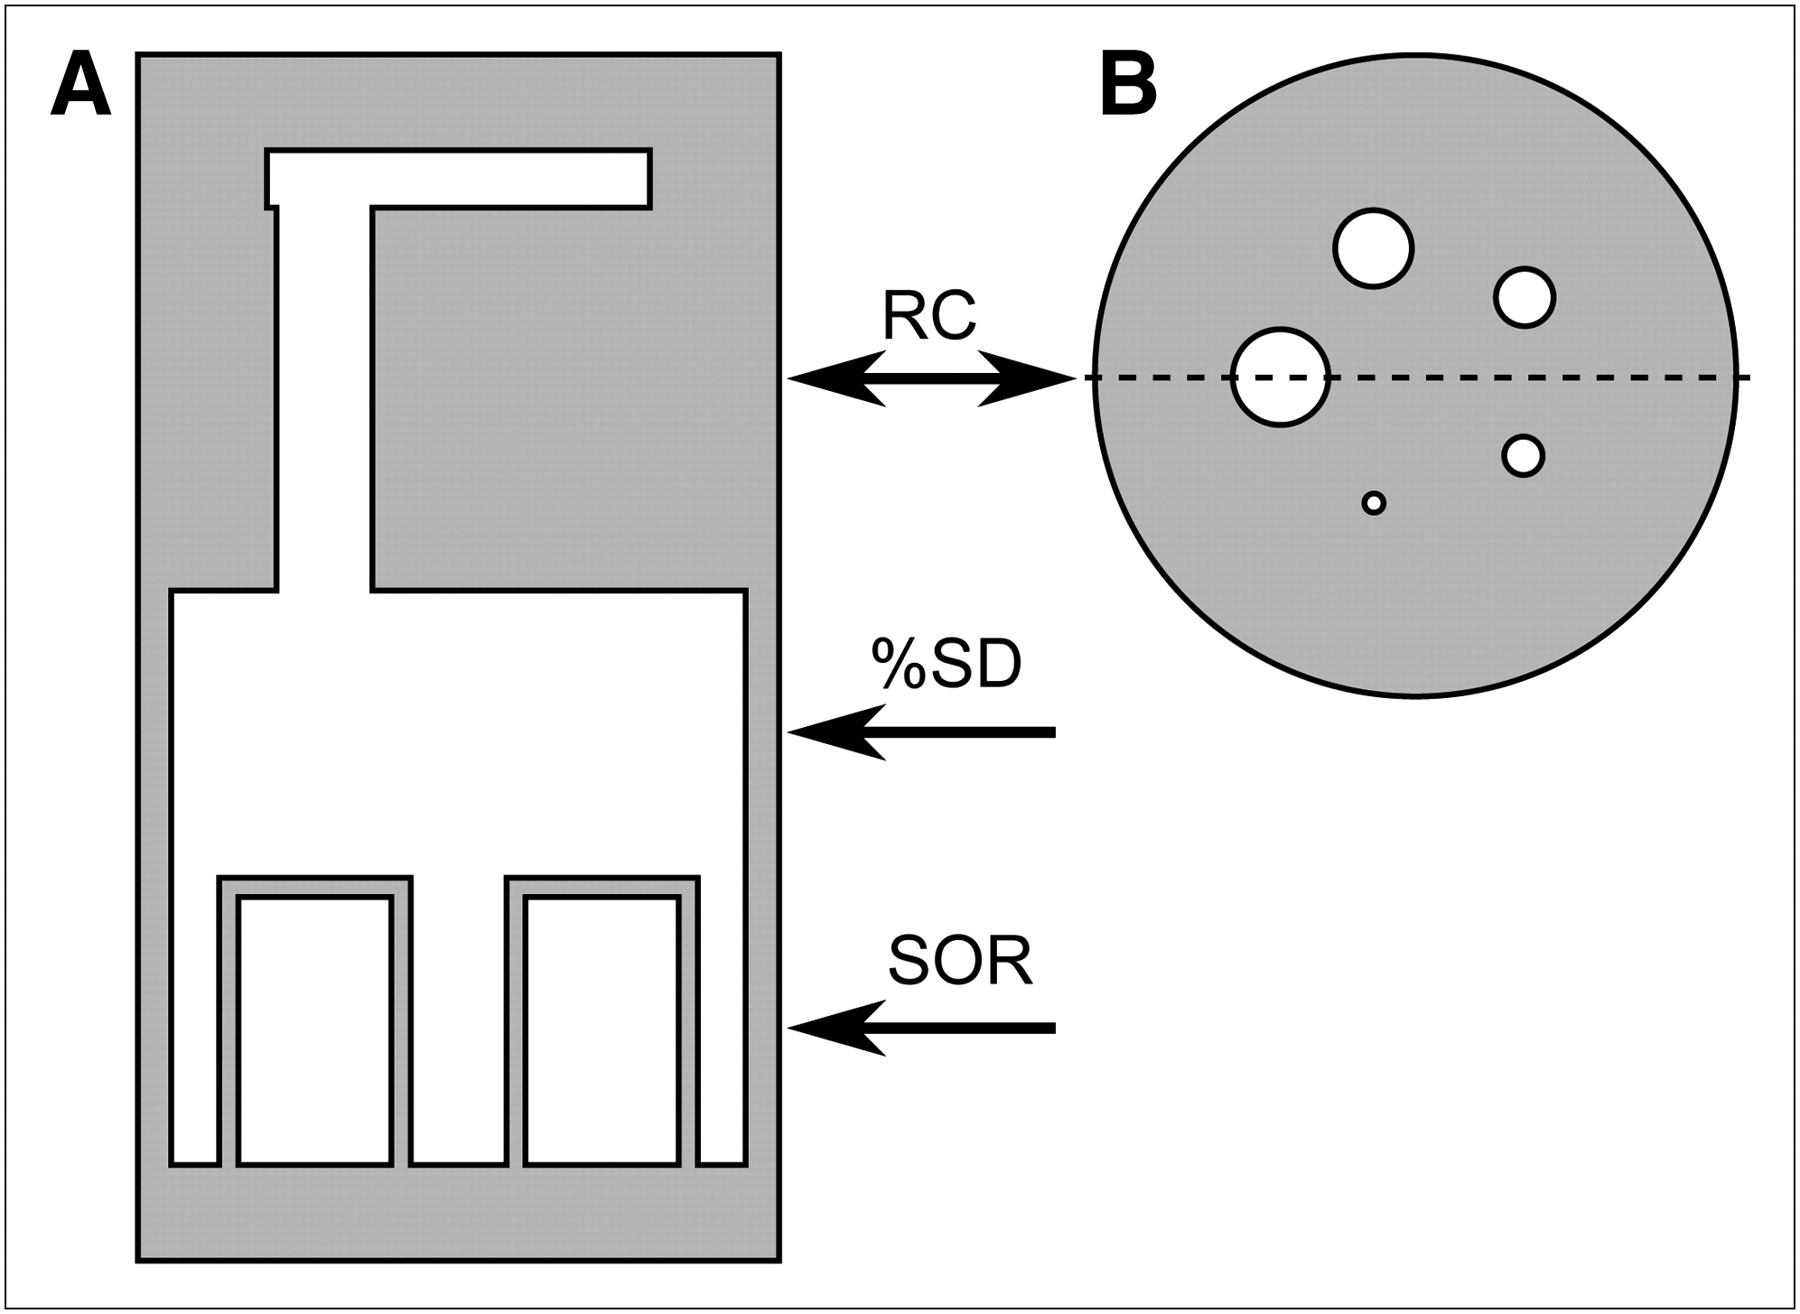
Cross-sectional diagram of NEMA NU 4 image-quality phantom. Gray represents solid polymethylmethacrylate, and white represents hollow, fillable compartments. Views are coronal (A) and transverse through rod (B).
A fillable cylindric chamber with 2 hollow cylinders (length, 14 mm; inner diameter, 8 mm) makes up the remaining 30 mm of the phantom. One of these cylinders is filled with air, the other with nonradioactive water. These 2 cylinders are used to determine the spillover ratio (SOR) in water and air, defined as the mean value in each cold cylinder divided by the mean in the uniform area. Both cylinders are nonradioactive, but as a result of scattered photons, nonzero positron range, randoms, or other effects, the reconstructed images may still display activity in these compartments. The SOR is theoretically limited between 1 and 0 (0 ≤ RC < 1).
The central, uniform region of the phantom is used to determine the percentage SD (%SD, the SD divided by the mean multiplied by 100%) as a measure of noise. The phantom was constructed according to the NEMA NU 4 specifications by Agile Engineering.
Before each measurement, the phantom was checked for and cleaned of any activity remaining from previous use. The total volume of the phantom regions filled with activity equaled 20.7 mL. The 5 rods and the large chamber, excluding the cold cylinders, were filled with radioactive solutions with an activity (at the start of the scan) of 3.7 MBq as defined by NEMA.
Glass Capillaries
In addition to the NEMA NU 4 image-quality assessment, the transaxial spatial resolutions of the 4 radionuclides were determined. According to NEMA specifications, resolution should be measured using 22Na point sources of less than 0.3 mm in diameter. However, the 4 radionuclides used in this study cannot be easily converted into point sources with these dimensions. Therefore, more practical line sources were used. Glass capillaries of 1.15-mm inner diameter (1.55-mm outer diameter) were filled with radioactive solutions. Activity concentrations of greater than 30 MBq/mL were used in a volume of about 70 μL. The glass capillaries were placed in a 2-cm-diameter plastic tube filled with water.
Data Acquisition and Image Reconstruction
Settings for NEMA NU 4 Image-Quality Phantom
The standard NEMA NU 4 protocol advises a 20-min emission scan with an initial 18F activity of 3.7 MBq. However, these numbers have been specifically tailored for 18F, and because of the differences in positron yield (or branching fraction) and half-life, the numbers may not be directly applicable for scanning other radionuclides. For a proper comparison of different radionuclides, equal numbers of positrons need to be emitted from the phantom during the scan. This can be achieved by adjusting either the total scan duration or the start activity. In Table 2, the total number of positron emissions that would occur under exact NEMA NU 4 specifications—that is, during a 20-min acquisition with an initial activity of 3.7 MBq—is given in column 1. The values in column 2 represent the length of acquisition required to obtain 4.03 × 10⁹ positron emissions given a start activity of 3.7 MBq. In column 3, the required start activity is given to obtain 4.03 × 10⁹ positron emissions during a 20-min scan. In this study, the scan duration was adjusted.
Required Scan Durations or Start Activities to Obtain Equal Numbers of Emitted Positrons for Each Radionuclide
The phantom was positioned on the scanner bed and manually centered in the FOV, using the built-in lasers of the scanner for guidance. The phantom always contained 178.7 Bq/μL (corresponding to a total activity of 3.7 MBq) at the start of the scan. Default energy and timing window settings of 350–650 keV and 3.432 ns, respectively, were used. Other window settings have not been considered in this study, to allow for comparison with results in the literature and because NEMA NU 4 requires these acquisition parameters to be constant throughout all tests.
For all radionuclides, a transmission scan of the phantom was made for about 3,600 s with a 57Co point source of 82 MBq. Because the scans were not obtained on the same day, the transmission scan durations were adjusted to account for transmission source decay to ensure an identical statistical quality of the attenuation correction.
All default settings were used for histogramming; that is, the emission data were histogrammed into 3D sinograms with a span of 3 and a maximum ring difference of 79, delays were subtracted, and global dead-time correction was applied. The transmission data were rebinned into single slices, with a span of 17 and a ring difference of 42, and global dead-time correction was applied.
The PET data were reconstructed with various algorithms to compare their performance for different radionuclides. The image matrix size was 256 × 256 × 159 with pixel sizes of 0.43 × 0.43 × 0.80 mm3 for MAP and 0.39 × 0.39 × 0.80 mm3 for FBP and OSEM2D. FBP was used with a ramp filter (cutoff at Nyquist frequency), and OSEM2D was performed using 4 iterations and 16 subsets. Before these 2D reconstructions, the 3D sinogram data were Fourier rebinned. OSEM3D–MAP reconstructions were performed using 2 OSEM3D iterations and 16 subsets, followed by 18 MAP iterations. The smoothing factor β in MAP reconstructions was set to 0.1, and the uniformity constraint was set to uniform variance. These settings led to the most favorable results using 18F, considering both RC and %SD (unpublished results).
All MAP reconstructions were preceded by 2 OSEM3D iterations, because OSEM3D converges faster than MAP. Here, MAP will refer to this combined OSEM3D and MAP reconstruction.
IAW provides a scatter-correction algorithm based on direct calculation from analytic formulas and source and object geometry (17). Although NEMA recommends reconstruction with all corrections applied, we opted for reconstruction with and without scatter correction, mainly because of some unexpected deformations induced by the correction algorithm.
Settings for Glass Capillaries
The glass capillaries were positioned in the center of the FOV, aligned with the axis of the scanner, and scanned until at least 3.5 million counts were acquired using the default energy window of 350–650 keV and timing window of 3.432 ns. Images were obtained using FBP with the default settings (ramp filter with a cutoff at Nyquist frequency) and 512 × 512 × 159 matrices with pixel sizes of 0.19 × 0.19 × 0.80 mm. This matrix size was selected to obtain a profile with a sufficient number of datapoints to allow for the accurate determination of spatial resolution. Attenuation and scatter corrections were not applied.
Image Analysis
The reconstructed images were processed with a program written in Matlab (version R2008a; The MathWorks) to determine the various image-quality parameters and full width at half and at tenth maximum (FWHM and FWTM, respectively) for the glass capillaries. The program provided accurate and reproducible placement of volumes of interest (VOIs) in all images.
The %SD were determined in a 22.5-mm-diameter (75% of the inner phantom diameter), 10-mm-long cylindric VOI drawn over the center of the uniform region of the phantom.
To determine the RCs, the image slices containing the central 10 mm of the rods were averaged and circular regions of interest were drawn around each rod with a diameter twice their physical diameter. The positions of the maximum values in these regions of interest were used to create line profiles in the axial direction through the rods. The RCs were determined from the mean values along these 5 profiles, divided by the mean activity concentration in the uniform area.
Two 4-mm-diameter (50% of the physical inner diameter), 7.5-mm-long cylindric VOIs were drawn over the center of the air- and water-filled compartments. The means of these cold regions divided by the mean of the uniform radioactive area provide the SOR.
As mentioned above, the NEMA NU 4 image-quality guidelines have been created for the use of 18F, but with a few adjustments these can also be used for other radionuclides. However, the determination of the SORs is not completely applicable to long-range positron emitters. Because the radius of the scatter compartments is relatively small, the measured activity in these regions not only is due to scattered photons but also contains contributions from positrons emitted in the body part of the phantom and annihilating in the scatter compartments. For a fair comparison, the 2 effects should be separated. Decreasing the diameter of the VOI in the scatter compartments is the only method achievable in the NEMA NU 4 image-quality phantom, but the diameter of the compartments is too small to fully eliminate positron range effects. However, by assessing the difference in SOR between the compartments filled with water and air, the accuracy of corrections can be evaluated. Whereas the SOR in water comprises photon scatter and the effect of positron range, only scattered photons contribute to the SOR in air; because of the large positron range (>1 m), almost no annihilations occur in air.
Capillary Measurements
The slices containing the capillary in the reconstructed images were aligned by placing their maximum in the center before being summed to form a single image. Profiles in tangential and radial directions through the center were averaged to determine the FWHM and FWTM for all radionuclides. These widths were determined according to NEMA NU 4 guidelines: maxima were determined in a parabolic fit through the peak pixel and its 2 nearest neighboring pixels. The FWHM and FWTM were determined by linear interpolation between adjacent pixels at half and one tenth of this maximum, respectively. FWHM and FWTM were not corrected for source geometry.
RESULTS
In the following sections, the results for each of the NEMA NU 4 image-quality parameters are presented. A complete list of all the obtained parameter values can be found in Supplemental Tables 1–4 (supplemental materials are available online only at http://jnm.snmjournals.org).
Spatial Resolution
Results of the spatial resolution measurements using the glass capillaries are summarized in Table 3. For gaussian profiles, the FWHM-to-FWTM ratio equals  . Nongaussian profiles with extended tails are characterized by smaller FWHM-to-FWTM ratios. Palmer et al. (18) have modeled spatial resolutions for a hypothetical imaging system with an intrinsic spatial resolution of 1.5 mm. Corresponding FWHM-to-FWTM ratios have been added for comparison, as well as the mean positron energies. The data in Table 3 indicate that 18F yielded the best approximation (0.51) of the theoretic gaussian ratio. The measured and modeled ratios for 68Ga (0.38 and 0.39, respectively) and 124I (0.41 and 0.39, respectively) are substantially lower, indicating a larger tail section of the curve. Figure 2 shows the measured profiles.
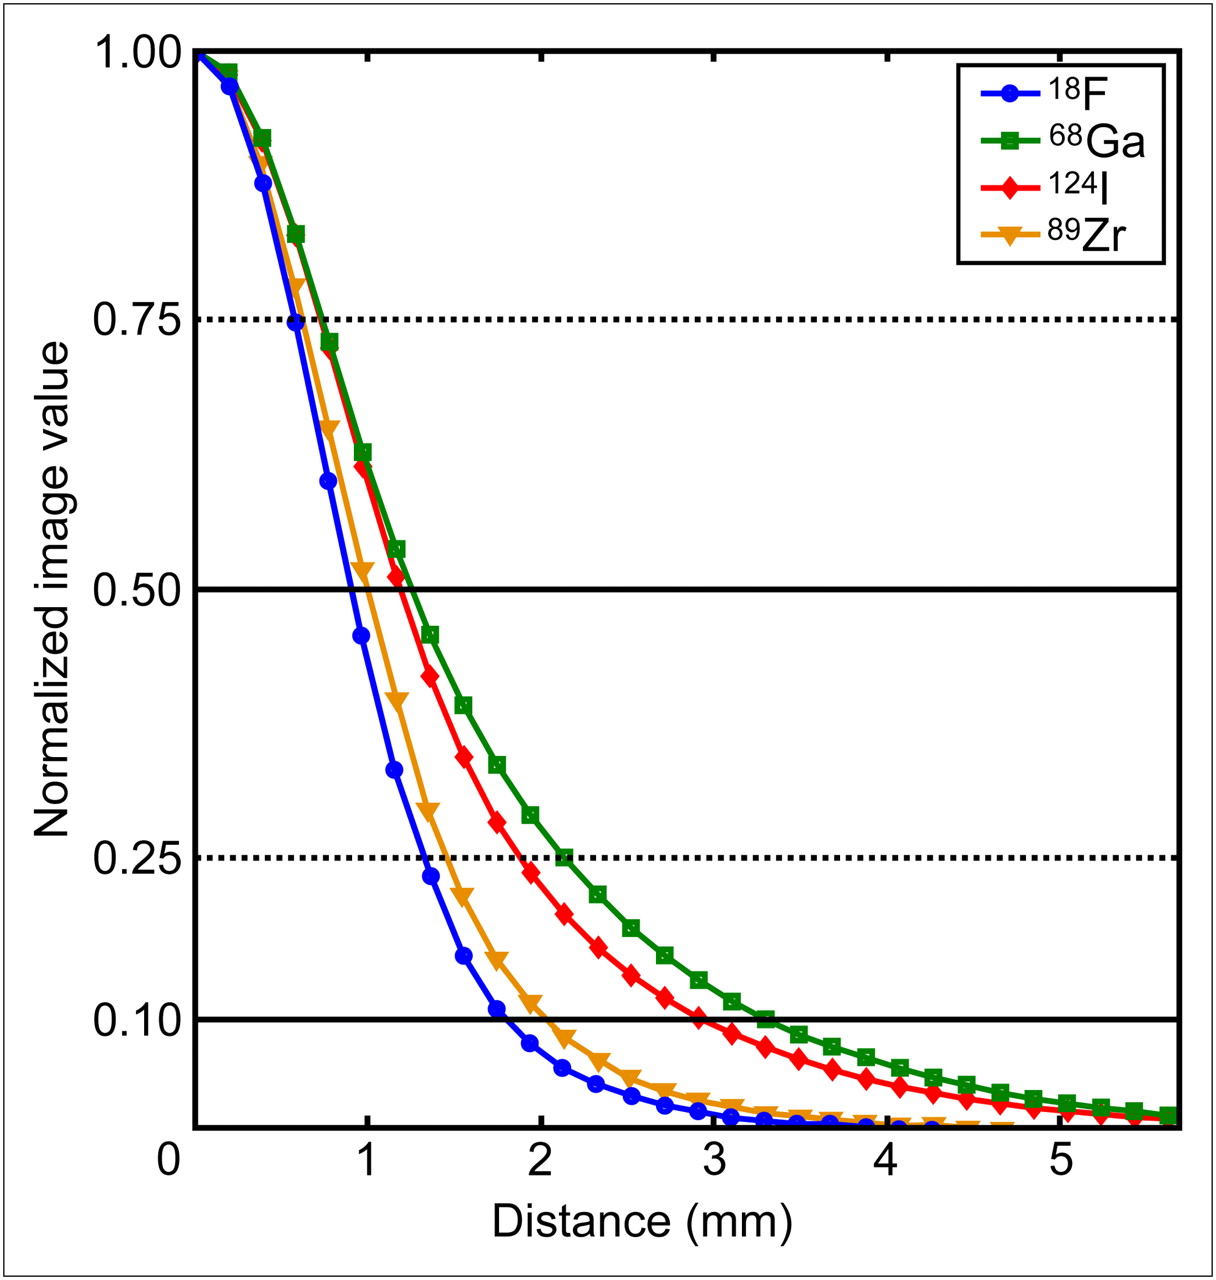
Measured line profiles through glass capillaries filled with positron-emitting aqueous solutions, surrounded by water. Profiles were obtained from 512 × 512 FBP reconstruction by aligning and summing image slices containing capillary and averaging profiles in tangential and radial directions through center. Profiles are shown in 1 direction only. Values were not corrected for source dimensions.
Spatial Resolutions for 4 Radionuclides Measured with Glass Capillaries Surrounded by Water
Uniformity
The %SD of the NEMA NU 4 image-quality phantom is shown in Figure 3. The largest differences are not found among different radionuclides but among the various reconstruction algorithms for the same radionuclide. MAP yields more than 2 times smaller %SD values than OSEM2D and FBP. The differences per reconstruction algorithm between the 4 radionuclides are much smaller, with a maximum SD of 0.8 percentage point for MAP. Scatter correction had a limited effect on %SD, with a maximum decrease of 0.8 percentage point for 124I in the OSEM2D images.

%SD in uniform phantom region. *Reconstruction performed with scatter correction.
RCs
The RCs of the 5 different rods are shown in Figure 4. Because the result obtained with 89Zr is similar to that obtained with 18F, and 124I is similar to 68Ga, the 4 radionuclides can be clearly separated into 2 groups: the long- and short-range positron emitters. The influence of scatter correction on RC was limited (data not shown). The largest differences in RC were introduced by the choice of reconstruction algorithm. This especially holds for the short-range positron emitters, for which the 2D reconstruction algorithms clearly showed lower RC values than did reconstruction with MAP, with a maximum difference between OSEM2D and MAP of 36%. With MAP, for large-diameter rods, the recovery even rose beyond the ideal limit of 1. This effect could possibly be attributed to an overshoot at the edges, commonly referred to as the Gibbs effect (19).

RCs of different rods for various radionuclides, reconstructed with FBP (A) and MAP (B). OSEM2D results were similar to those of FBP.
For the long-range positron emitters, the differences in RC were smaller, but FBP and OSEM2D still showed lower values than did MAP, with a maximum difference between OSEM2D and MAP of 18%.
Accuracy of Corrections
In Figure 5, the SORs in the water and air compartments are shown for the 4 radionuclides for different reconstruction algorithms with and without scatter correction. The differences in SOR were large, especially in water. Again, 2 groups can be distinguished: the short-range positron emitters, with a clearly lower SOR (mean value for all reconstruction algorithms, 0.03 for 18F and 0.04 for 89Zr), and the large-range positron emitters (mean value for all reconstruction algorithms, 0.10 for 68Ga and 0.14 for 124I). A reduction in SOR was achieved by MAP, as compared with OSEM2D and FBP. In the case of air, this reduction is evident for all radionuclides except 89Zr. In the case of water, the reduction is obvious only for 18F. Scatter correction lowered SOR, especially for 124I.
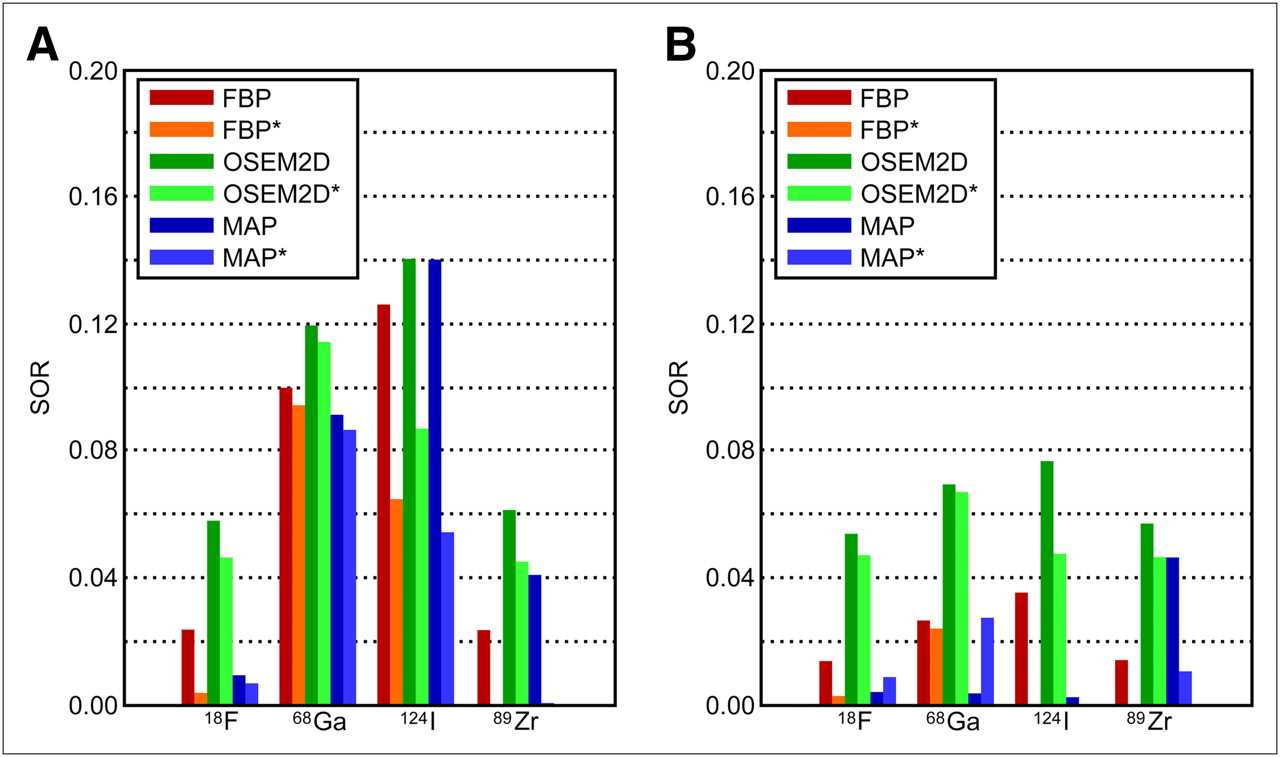
SORs in water (A) and air (B) compartments for various radionuclides, reconstructed with 3 different algorithms. Some SOR values are (close to) zero, and not visible in graph. *Reconstruction performed with scatter correction.
Two unexpected features were also observed in the data. First, MAP performed poorly without scatter correction in the case of 124I. The SOR was lowered substantially (a decrease of 0.09) with scatter correction enabled, possibly related to the abundance of single γ-photons in the 350–650 keV energy window. Second, only for 89Zr, MAP produced a relatively high SOR in air (0.05), which is even higher than the SOR in water (0.04).
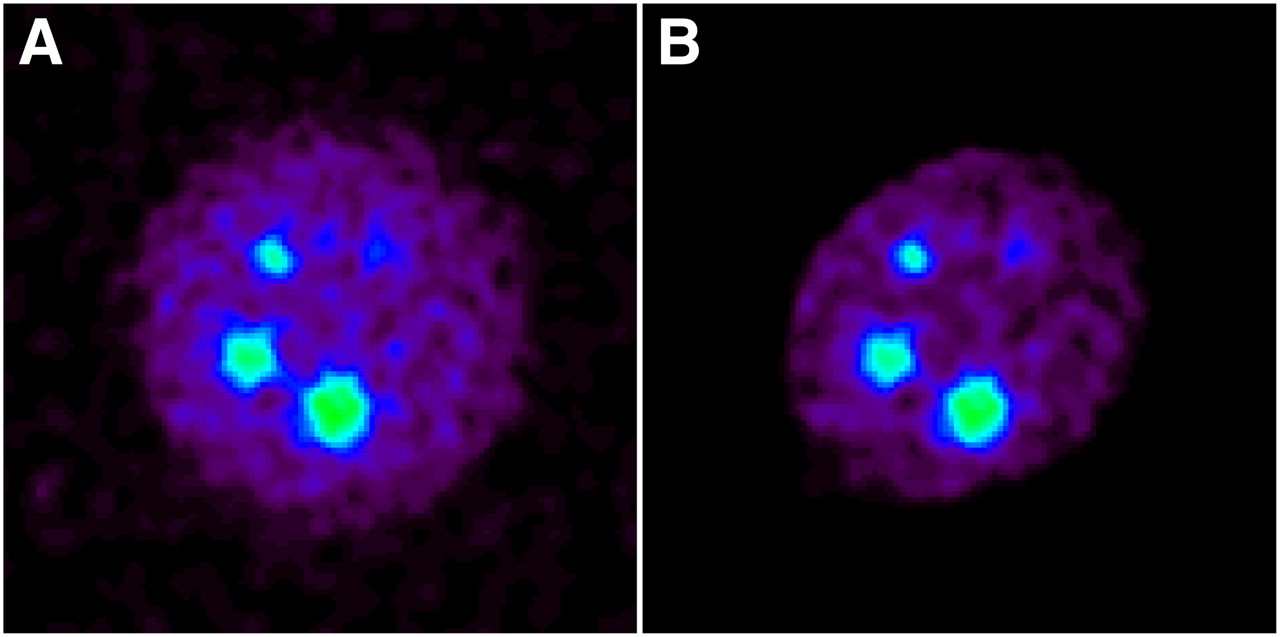
The scatter-correction algorithm included in IAW introduced certain deformation artifacts in some parts of the reconstructed images, as shown in Figure 6. The 124I image, especially, was affected, whereas the effect was not prominent in the images of the other radionuclides. This could again be related to an abundance of single γ-photons for 124I in the 350–650 keV energy window, for which correction was unavailable. No abnormalities, however, arose in the NEMA NU 4 parameters by this artifact.

Transverse cross-section through rod area of phantom filled with 124I solution. Images without (A) and with (B) scatter correction are shown. Scatter-corrected image clearly displays ellipsoid deformation.
DISCUSSION
From the results for the RCs of the small rods and capillary measurements, this study shows that the positron range limits the spatial resolution for modern small-animal PET scanners. This is in line with the observations by Liu and Laforest (20), who analyzed 5 different radionuclides (18F, 61Cu, 68Ga, 94mTc, and 86Y). These were, however, not measured using the standard NEMA NU 4 image-quality phantom and parameter definitions and were for a different type of scanner (microPET Focus 120; Siemens).
The SORs in water were considerably higher for 124I and 68Ga than for 18F and 89Zr. These results should, however, be interpreted carefully. The high SOR values for the long-range positron emitters in water do not imply incorrect scatter- or other correction algorithms for these radionuclides, because they are largely caused by positrons emitted in the body part of the phantom and annihilating in the water-filled scatter compartment. Selecting a smaller VOI within the scatter compartments could partly improve this. However, with a maximum positron range of more than 10 mm and an inner diameter of the compartment of only 8 mm, no valid volume can be drawn. For a real evaluation of the SOR in water, either a different phantom should be used, or correction for positron range should be applied during reconstruction. In air, the average positron range for all radionuclides is greater than 1 m, and scattered and single photons will be the main contributors to the SOR in air, allowing analysis of correction algorithm performance.
As mentioned before, the additional single γ-photons for 124I and 89Zr could have contributed to the image noise, resulting in a higher %SD. However, this was not observed. Activities normally injected in small animals (<10 MBq) remain well below the maximum noise-equivalent counting rate measured by Bao et al. (10) and Kemp et al. (12) for 18F. System dead time does not play a large role for these activities. As the activity in the FOV increases, increasing numbers of multiple detections will occur. No differences (in count-rate performance) are to be expected for 68Ga, 124I, and 89Zr, because the total number of emitted γ-photons (both annihilation and single γ-photons) is lower for these 3 radionuclides than for 18F.
In addition to image quality, accurate quantification is an important factor in PET. There are 2 issues concerning quantification, one of which depends on a properly performed cross-calibration. During this procedure, a known amount of radioactivity is used in a calibration phantom. With a scaling factor, the measured PET counts per pixel are correlated to the true activity concentration. Another quantification issue concerns the proper scaling of regions with different activity concentrations within the same phantom or animal. In the case of large numbers of single photons (e.g., for 124I), this could be a problem. Without correction, these singles give an additive, nearly uniform contribution to the activity concentrations in all regions. However, a fixed scaling factor obtained from cross-calibration will lead to concentration-dependent quantification errors, because the spurious activity concentration from the single emissions should have been subtracted before applying the scaling. Because the NEMA NU 4 image-quality phantom contains 1 activity concentration (apart, of course, from all cold regions with zero activity), performance measurements with respect to quantification should be the subject of further study.
In earlier studies with PET radionuclides that emitted single γ-photons in the acquisition energy window—such as 124I (21–23), 76Br (3,24–26), and 86Y (24,27–29)—quantification proved to be affected by the single γ-photons. Both under- and overestimation of activity concentration occurred, depending on the activity concentration used for cross-calibration.
Basically, MAP performs better than the other 2 algorithms for all 3 image-quality parameters. Accurate modeling of the system response and the statistical nature of the data and incorporation of these during reconstruction improves the resolution recovery of the MAP algorithm. Another distinctive feature of the MAP algorithm is the smoothing factor β, which regulates the variance and resolution in the image (14). Both aspects improve the image quality of MAP, as compared with both FBP and OSEM2D.
CONCLUSION
In terms of image-quality parameters, the Inveon small-animal PET scanner performs best for 18F. The largest differences in the RC and SOR are found between the group of radionuclides with large positron ranges (124I and 68Ga) and the one with short ranges (18F and 89Zr). Only the %SD is unaffected by the positron range.
The abundance of single γ-photons affects only slightly the image-quality parameters; all 4 radionuclides yield roughly the same values for %SD.
Although scatter correction leads in some cases to deformation artifacts in the images, this technique is beneficial for the SOR and affects only slightly the %SD and RC. Especially with respect to the RC and %SD, the MAP algorithm performs much better than do the other reconstruction techniques.
Acknowledgments
This work was supported by NIH grant 1R01 AG 030328-01.
Footnotes
-
COPYRIGHT © 2010 by the Society of Nuclear Medicine, Inc.
References
- Received for publication July 26, 2009.
- Accepted for publication January 11, 2010.


Jump to section
Related Articles
Cited By...
- Radiolabeling of PSMA-617 with 89Zr: A Novel Use of DMSO for Radiochemical Yield Enhancement and Preliminary Small-Animal PET Results
- Hepatic stearoyl CoA desaturase 1 deficiency increases glucose uptake in adipose tissue partially through the PGC-1{alpha}-FGF21 axis in mice
- Reproducibility and Comparability of Preclinical PET Imaging Data: A Multicenter Small-Animal PET Study
- Functional Renal Imaging with 2-Deoxy-2-18F-Fluorosorbitol PET in Rat Models of Renal Disorders
- A Promising Future: Comparable Imaging Capability of MRI-Compatible Silicon Photomultiplier and Conventional Photosensor Preclinical PET Systems
- Retention Kinetics of the 18F-Labeled Sympathetic Nerve PET Tracer LMI1195: Comparison with 11C-Hydroxyephedrine and 123I-MIBG
- Beyond 18F-FDG: Characterization of PET/CT and PET/MR Scanners for a Comprehensive Set of Positron Emitters of Growing Application--18F, 11C, 89Zr, 124I, 68Ga, and 90Y
- 89Zr-Labeled Versus 124I-Labeled {alpha}HER2 Fab with Optimized Plasma Half-Life for High-Contrast Tumor Imaging In Vivo
- Preclinical Comparison of Al18F- and 68Ga-Labeled Gastrin-Releasing Peptide Receptor Antagonists for PET Imaging of Prostate Cancer
- Central Nervous System Expression and PET Imaging of the Translocator Protein in Relapsing-Remitting Experimental Autoimmune Encephalomyelitis
- Bone Marrow Stromal Cell Transplantation Enhances Recovery of Local Glucose Metabolism After Cerebral Infarction in Rats: A Serial 18F-FDG PET Study
- Clinical PET of Neuroendocrine Tumors Using 64Cu-DOTATATE: First-in-Humans Study
- Quantitative, Simultaneous PET/MRI for Intratumoral Imaging with an MRI-Compatible PET Scanner
- Imaging of Human Epidermal Growth Factor Receptor Type 2 Expression with 18F-Labeled Affibody Molecule ZHER2:2395 in a Mouse Model for Ovarian Cancer
- Using the NEMA NU 4 PET Image Quality Phantom in Multipinhole Small-Animal SPECT