


Abstract
We recently completed construction of a small-animal PET system—the MiniPET-3—that uses state-of-the-art silicon photomultiplier (SiPM) photosensors, making possible dual-modality imaging with MRI. In this article, we compare the MiniPET-3 with the MiniPET-2, a system with the same crystal geometry but conventional photomultiplier tubes (PMTs). Methods: The standard measurements proposed by the National Electrical Manufacturers Association NU 4 protocols were performed on both systems. These measurements included spatial resolution, system sensitivity, energy resolution, counting rate performance, scatter fraction, spillover ratio for air and water, recovery coefficient, and image uniformity. The energy windows were set to 350–650 keV on the MiniPET-2 and 360–662 keV on the MiniPET-3. Results: Spatial resolution was approximately 17% better on average for the MiniPET-3 than the MiniPET-2. The systems performed similarly in terms of peak absolute sensitivity (∼1.37%), spillover ratio for air (∼0.15), spillover ratio for water (∼0.25), and recovery coefficient (∼0.33, 0.59, 0.81, 0.89, and 0.94). Uniformity was 5.59% for the MiniPET-2 and 6.49% for the MiniPET-3. Minor differences were found in scatter fraction. With the ratlike phantom, the peak noise-equivalent counting rate was 14 kcps on the MiniPET-2 but 24 kcps on the MiniPET-3. However, with the mouselike phantom, these values were 55 and 91 kcps, respectively. The optimal coincidence time window was 6 ns for the MiniPET-2 and 8 ns for the MiniPET-3. Conclusion: Images obtained with the SiPM-based MiniPET-3 small-animal PET system are similar in quality to those obtained with the conventional PMT-based MiniPET-2.
Efforts to integrate PET and MRI have advanced significantly in recent years, fostered mainly by new photosensor technologies (1–4). Conventional photomultiplier tube (PMT) detectors benefit from high signal gain in the range of 105–107 (5,6). Low noise and fast transit time (∼100 ps) are also available today and have made PMTs the first candidate for applications involving time-of-flight PET technology. In addition, PMTs have lower noise than avalanche photodiode or silicon photomultiplier (SiPM) detectors (5). However, in strong magnetic fields PMTs cannot produce position maps that are acceptable for imaging purposes. In contrast, avalanche photodiodes can be used efficiently as a photosensor for PET when near strong magnets. Some successful approaches using avalanche photodiodes have already been introduced for combined PET/MRI applications (2,7,8). However, avalanche photodiodes have significantly higher rise times than PMTs (up to 2–3 ns) (5), preventing the timing resolution from being adequate for time-of-flight PET. The low gain (∼102) is also a disadvantage of avalanche photodiodes (2,5).
By coupling lutetium oxyorthosilicate crystals with new SiPM technology, a timing resolution sufficient for time-of-flight PET measurements has already been reached (9). The considerably lower noise of SiPMs than of avalanche photodiodes and the high gain (∼106) are additional features making this technology promising for PET photodetectors in high magnetic fields. Some approaches to the inclusion of SiPM in a full-ring PET detector system have already been introduced (4,10,11). At the University of Debrecen, we recently developed a preclinical PET system, the MiniPET-3, based on the gantry parameters of the MiniPET-2 (12) with lutetium-yttrium oxyorthosilicate crystal detectors. However, the conventional PMT detectors of the MiniPET-2 were replaced with SiPM technology (ST Microelectronics) for use in the MiniPET-3. In addition, although the scintillation crystal geometry in the gantry remained the same for both systems, the readout boards were slightly altered in terms of the signal encoding of the SiPMs and PMTs.
Because the only significant difference between the two systems is the detector technology, they provide us with a method to compare the imaging capabilities and performance of the new MRI-compatible SiPM photosensors (on the MiniPET-3) and the conventional PMTs (on the MiniPET-2). We performed this comparison by obtaining measurements as specified in the National Electrical Manufacturers Association (NEMA) NU 4 protocols without operation in MRI high magnetic fields.
MATERIALS AND METHODS
System Description
The technical and geometric parameters of the two systems are listed in Table 1. They have the same gantry size, detector crystal material, crystal size, crystal pitch, and detector module configuration. The significant difference between them lies in the photosensors: the MiniPET-2 has conventional PMTs, whereas the MiniPET-3 has SiPMs and a readout system optimized for this type of detector. A row-column readout of the SiPM matrix was used without applying individual signal-processing channels to each matrix element. Weighting circuits were connected directly to the row and column outputs as proposed by Wang et al. (13) but modified to reduce the dark noise. The overlap between the crystals and the SiPM-sensitive areas was determined during design of the SiPM sensors to optimize position encoding. The lutetium-yttrium oxyorthosilicate crystal matrix and the SiPM sensor board were attached together with a light-guide designed to receive light from every scintillation crystal. SiPM sensors were arranged to overlap with crystal clusters of 3 rows and 3 columns. Light from these clusters was collected at a relatively high efficiency compared with crystal elements, which did not overlap with the SiPM as shown in Figure 1. Regarding the crystal elements, 59.5% were located at regions of relatively high-efficiency light collection, whereas 40.5% were located in regions of relatively low-efficiency light collection. In total, 324 SiPM sensors (18 × 18) were arranged in 2 × 2 blocks, and these quads were produced in a 9 × 9 configuration. The area of active SiPM matrix was 48 × 48 mm, and the size of each SiPM sensor was 1.95 × 2.2 mm. The number of microcells in each sensor was 833. An epoxy light guide (Philips Research) with a thickness of 1.3 mm was used between the SiPM tile and the crystal matrix. For the MiniPET-2, the PMTs were attached to the lutetium-yttrium oxyorthosilicate scintillation crystal matrixes with V-788 optical coupling compound (Visilox Systems, Inc.); the thickness of the optical coupling remained under 0.5 mm. Digital signals were fed into a Virtex4 (Xilinx Inc.) field-programmable gate array board, where time stamp generation, energy calculation, signal recognition, and status checking took place (12). Data from the detector modules were transmitted to the data acquisition computer via a 100BASE-TX ethernet network. A custom-made multimodal medical imaging software library (M3I; University of Debrecen) was developed (14) for data collection, primary data processing, system calibration, image reconstruction, image processing, and evaluation of performance parameters. This software tool arranges the data into 3-dimensional (3D) lines of response or single-event list-mode data files that can be graphed into 2-dimensional (2D) sinograms. The M3I performs 2D maximum-likelihood expectation maximization (15), which we used for image quality measurements. To evaluate the spatial resolution of the systems, we used filtered backprojection. All other images in this evaluation were reconstructed using maximum-likelihood expectation maximization, as implemented in M3I, with 20 iterations and no postreconstruction filtering. The same system matrix was used for both systems.
Physical and Technical Parameters of MiniPET-2 and MiniPET-3

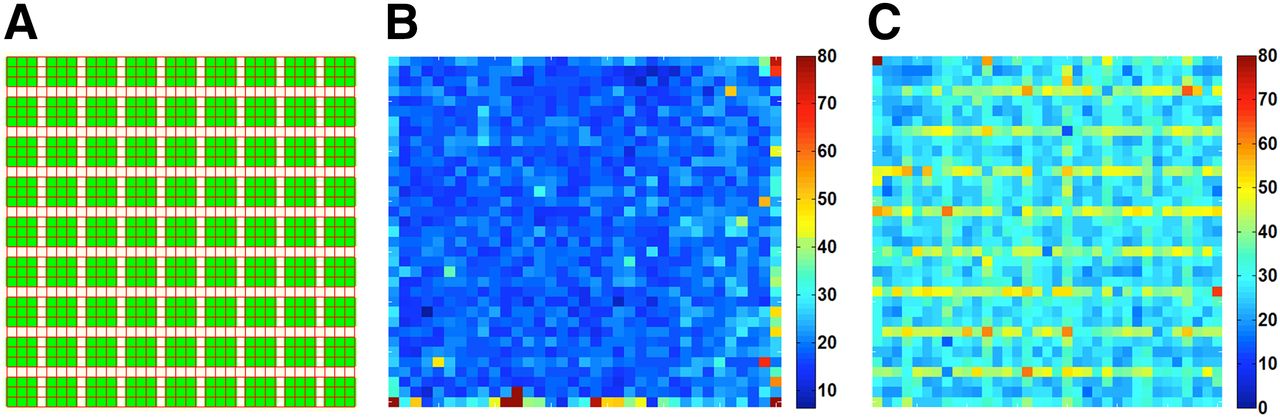
(A) Overlap positions for lutetium-yttrium oxyorthosilicate scintillation crystal (red) and SiPM sensor (green) in MiniPET-3 detector module. (B and C) Energy resolution maps of MiniPET-2 (B) and MiniPET-3 (C).
Position Encoding and Energy Resolution
Measurements for position encoding and energy resolution were performed with a 4-MBq 18F point source positioned in the center of the field of view axially and transaxially. A 1,200-s list-mode dataset was acquired in each case. From the list-mode data, events were sorted into energy histograms for every crystal element, and the full widths at half maximum (FWHMs) of the 511-keV peaks were calculated. The 18F energy resolution was calculated as the FWHM divided by the peak channel number multiplied by 100. Measurements on the MiniPET-3 took into account the nonlinearity between SiPM signals and photon energies. The lower energy threshold was set to 360 keV using 131I measurements, and the upper energy threshold was set to 662 keV with 137Cs. These isotopes have definite signal peaks at the mentioned energies. This same measurement protocol was used for position-encoding purposes, and the position maps for each detector module were determined.
Optimization of Coincidence Time Window (τ-Value)
An optimal τ-value must balance the need to maximize the true coincidence counting rate with the need to minimize the random coincidence rate. This optimization depends on both the source activity and the FWHM of the τ-value histogram. To determine the optimal τ-value on the MiniPET-3, we used a 68Ga-filled cylindric phantom (inner diameter, 45 mm; length, 200 mm). Raw data were acquired at an initial activity of 17.05 MBq for 2 min using a τ-value of 2 ns. Nineteen subsequent measurements were taken with the τ-value increased by 2-ns increments. The actual true and random coincidence rates were obtained during the measurement. In addition, we calculated a parameter similar to noise-equivalent counting rate (NEC) defined as true2/[true + (2 × random)], which was used to find the optimal τ-value. For the MiniPET-2, the optimal τ-value was determined in a previous study (12). Each detector module is in coincidence with 3 other modules on the opposite side of the gantry. For both MiniPET systems, time alignment for all 18 detector-connections was performed by appropriately shifting the τ-value histograms.
Spatial Resolution
Spatial resolution for both systems was measured using a 1 × 1 × 1 cm cast acrylic cube (Eckert and Ziegler Isotope Products, Inc.) containing a 0.25-mm3 spheric 22Na point source at its center. Individual measurements using this point source were performed at a radial offset of 0, 5, 10, 15, 25, and 35 mm from the central axis of the scanner. These measurements were repeated using the same radial locations but shifted to one-quarter offset from the axial center. The 3D data were then rebinned into 2D lines of response using the single-slice rebinning algorithm. As proposed by the NEMA standard, we used 2D filtered backprojection for image reconstruction of the spatial resolution acquisitions. For each of the 12 measurements, a profile through the point was obtained. The FWHM of this profile was then used to determine the spatial resolution for each image.
Sensitivity
Sensitivity was measured using a 22Na point source initially placed in the center of the field of view. Subsequent images were taken by shifting the point source axially toward the edge of the detector ring in 1.35-mm increments, resulting in a total of 35 scans. The absolute sensitivity for each ith (i = 1, 2,…35) acquisition was calculated as follows:
 Eq. 1
Eq. 1where Acal is the activity of the point source, 0.905 is the branching ratio of 22Na, and Ri and RB,i are the source and background total counting rate, respectively, for the ith acquisition. System peak absolute sensitivity is defined as the SA,i at the center of the field of view (13). Total absolute sensitivity (SA,tot) was calculated using the following equation:
 Eq. 2
Eq. 2where SA,i is the absolute sensitivity at slice i and n is the maximal slice index (35 in our case) (12). This formula follows the concept of some recent articles (12,16,17) and the extension of the NEMA NU-4 in 2011.
Image-Quality Phantom Study
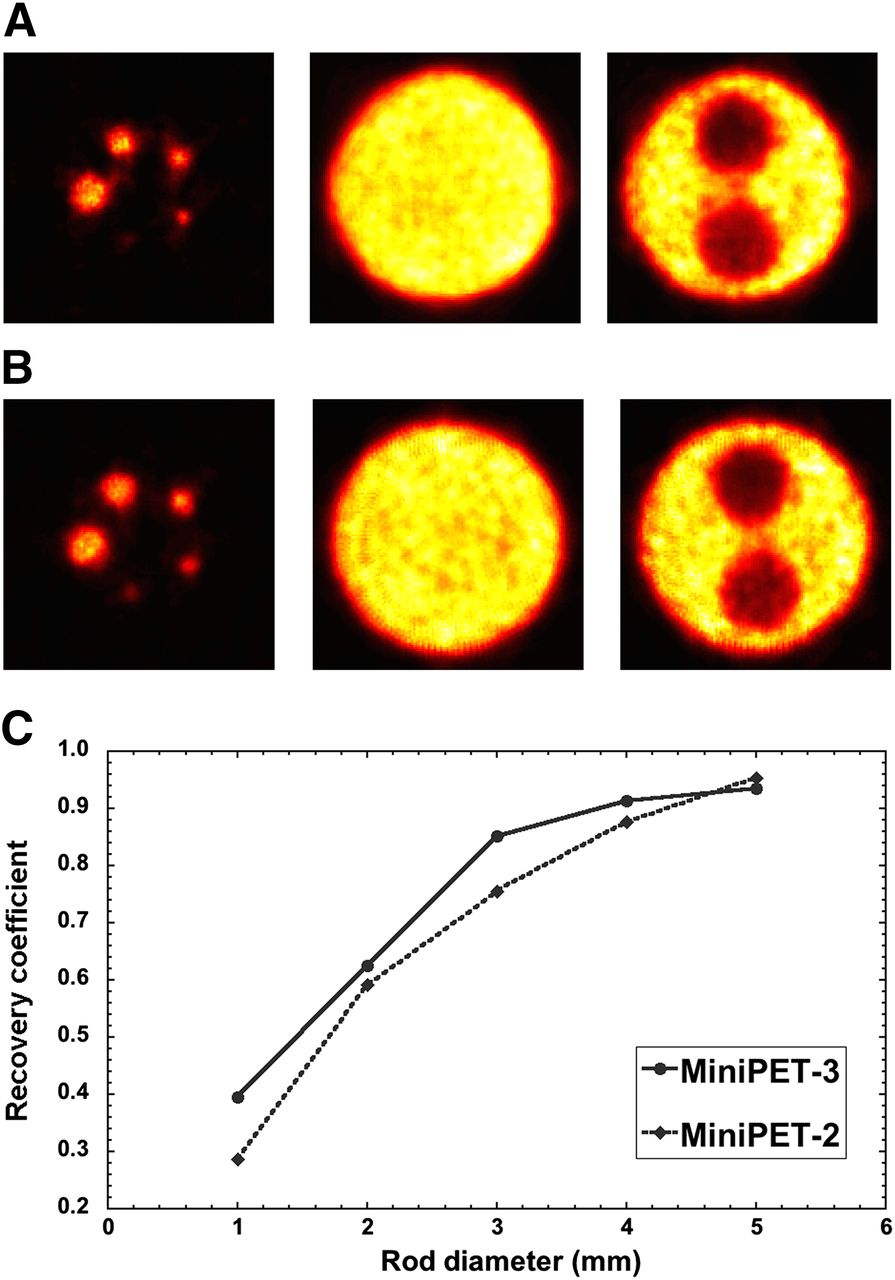
For the image-quality measurements, we used the NEMA NU4 IQ phantom, which is cylindric and has fillable rods of various diameters drilled into a cold, solid background for computing recovery coefficients. In addition to computing recovery coefficients, the NEMA standard includes protocols for determining image uniformity and spillover ratios using a homogeneous region and 2 cylindric chambers (cold chambers) within the IQ phantom. Uniformity is calculated as percentage SD, which equals USD/(Umean × 100%), where Umean and USD are the means and SDs for the homogeneous region. Image acquisition, creation of histograms, and reconstruction were similar between the MiniPET-2 and MiniPET-3. The images were acquired from the NU 4 IQ phantom filled with 18F at an initial activity of 3.7 MBq. One of the cold chambers was filled with water, the other with air. The phantom was positioned on the animal bed port of the system along its central axis. In both cases, data were acquired using the 1,200-s list-mode dataset of the phantom. The list-mode raw data were binned into 3D coincidence lines of response, representing the geometry of the system. These 3D data were then rebinned into 2D lines of response using the single-slice rebinning algorithm. Images were reconstructed from the 2D rebinned data using maximum-likelihood expectation maximization with 20 iterations. From the reconstructed images, we determined recovery coefficient, spillover ratio, and uniformity using our cross-validated software.
Scatter Fraction and Counting Rate Performance
The counting rate protocol allows determination of the true and random ratios, as well as NEC. The scatter fraction was determined from data measured at low activity levels, when the random ratio is negligible. The measurements were performed using 2 cylindric scattering phantoms (the so-called rat and mouse phantoms) with a high-activity line-source insert as recommended by the NEMA NU 4 standard.
RESULTS
Position Encoding and Energy Resolution
The flood-field images of both MiniPET systems are shown in Figure 2. These images illustrate the difference between the position-mapping capabilities of the lutetium-yttrium oxyorthosilicate crystals when used with PMTs versus SiPMs. Although the position map of the MiniPET-2 seems more homogeneous, fewer crystals can be identified at the border area. On the other hand, nonuniform patterns can be seen in the MiniPET-3 position maps. This effect is due to the periodically changing overlap between the crystal elements and the sensitive area of the SiPMs. Moreover, some of the crystal elements are arranged into 3 × 3 clusters overlapping the SiPM sensors, whereas other crystal elements are located between the sensitive areas of SiPM sensors. Representative profiles from the MiniPET-2 and MiniPET-3 position maps are shown in Figure 2. The average top-to-valley ratios for the MiniPET-2 and MiniPET-3 detector modules are 5.20 ± 0.21 and 5.73 ± 1.03, respectively. The highest top-to-valley ratio of the MiniPET-3 is more pronounced if we consider only the crystals in the high-efficiency light collection position. In this case the average top-to-valley ratio is 6.6 ± 0.43. The energy spectra for each crystal position were also investigated, and the related energy resolutions were calculated. Figures 1B and 1C show the energy resolution related to each crystal element for the representative detector modules. The average energy resolutions were 19.98% ± 7.59% for the MiniPET-2 and 31.74% ± 11.30% for the MiniPET-3. The energy resolution pattern of the MiniPET-3 correlated well with the flood-field image. Furthermore, the energy resolutions were higher for crystal positions with high-efficiency light collection and lower for crystal positions with low-efficiency light collection.

Position maps (A and B) and line profiles (C and D) of MiniPET-2 (A and C) and MiniPET-3 (B and D).
τ-Value Optimization, Spatial Resolution, and Sensitivity
The τ-value data illustrate that the true coincidence rate began to plateau at between 8 and 12 ns (Fig. 3); however, the random coincidence rate was reasonably low within that range. The NEC-like measure had a maximum of about 8 ns as shown in Figure 3. Therefore, the default τ-value was set to 8 ns to keep the random-to-true coincidence rate as low as possible and near the close-to-optimal true event rate. For the MiniPET-2, the optimal τ-value was 6 ns based on former measurements (12).
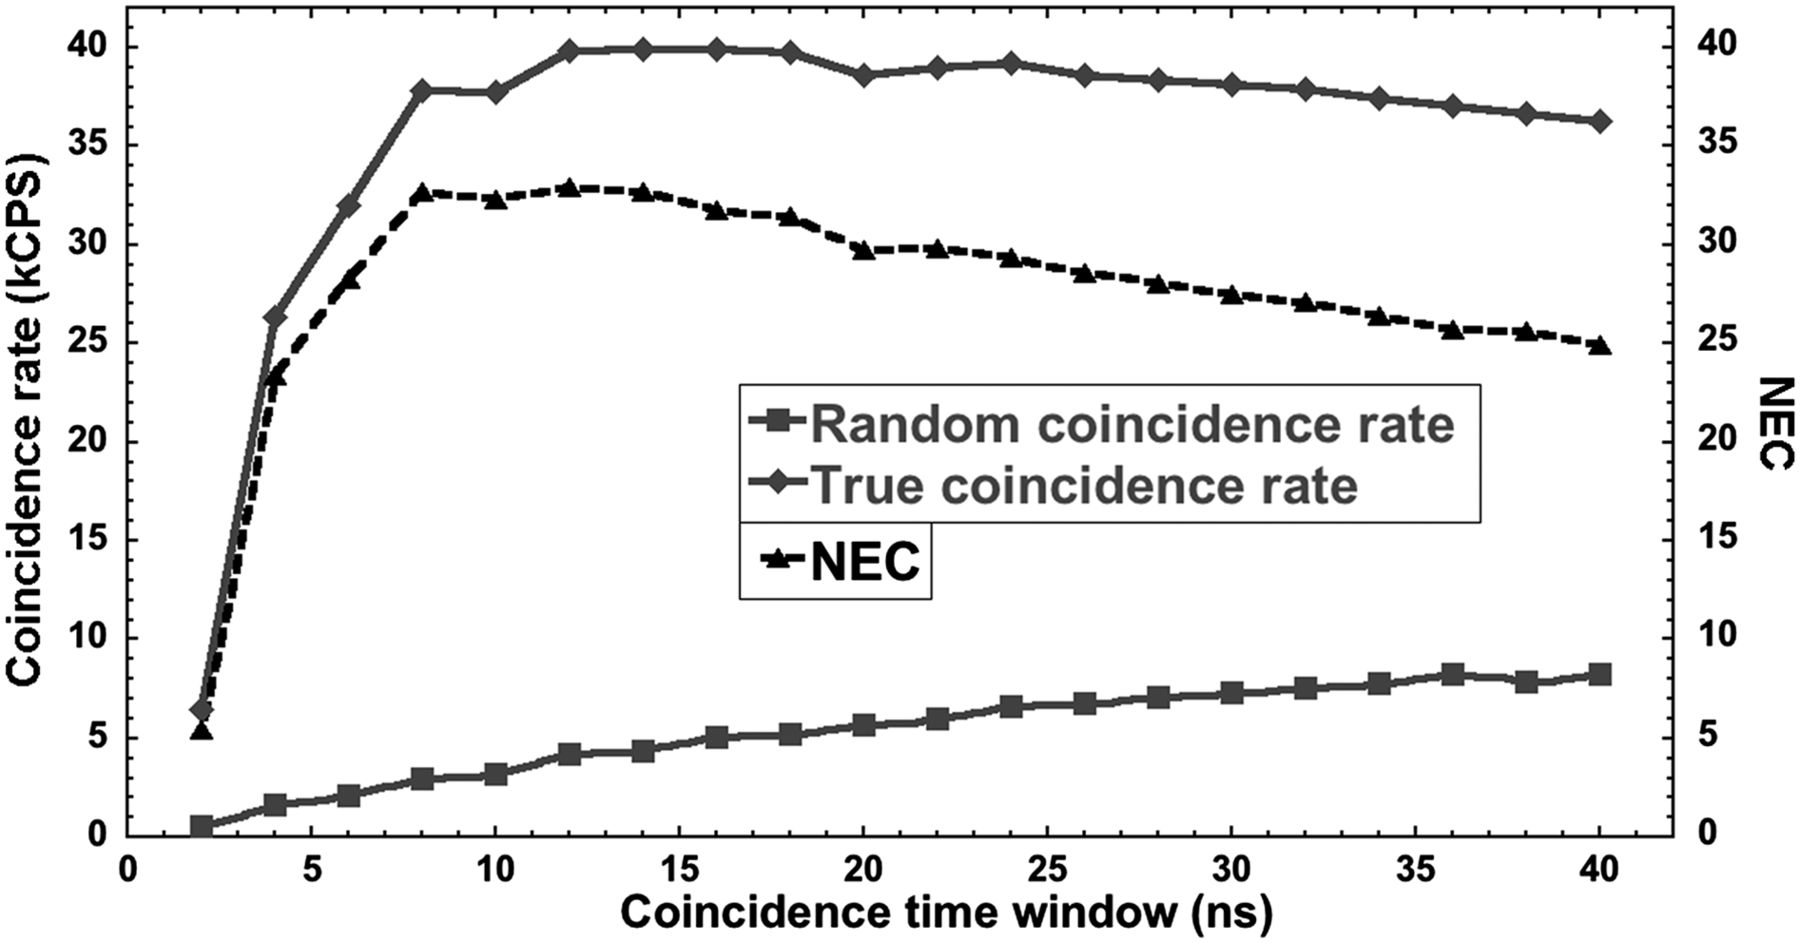
Dependence of coincidence timing window on random, true, and NEC-like [true2/(true + 2 × random)] counting rates for MiniPET-3.
Spatial resolution was also measured using the FWHM of the radial, axial, and tangential profiles as a function of radial distance from the axial center for the MiniPET-2 and MiniPET-3 at the one-quarter offset from the axial center as seen in Figure 4. These values were about 17% better, on average, for the MiniPET-3 than the MiniPET-2. For the MiniPET-2, the minimal spatial resolution for all 3 directions (radial, tangential, and axial) was approximately 1.35 mm at the center, increasing to 2.33 mm at the radial edge. On the other hand, the minimal spatial resolution of the MiniPET-3 was approximately 1.15 mm and increased to 1.87 mm at the radial edge. The effective transaxial FWHM spatial resolution proposed by Goertzen et al. (16) was 1.34 mm for the MiniPET-2 and 1.25 mm for the MiniPET-3.

Dependence of FWHM on radial distance at one-quarter offset from axial center for MiniPET-2 (A) and MiniPET-3 (B).
The axial absolute sensitivity profiles were calculated as recommended in NEMA-NU4 and were similar for both systems. Peak absolute sensitivity and total absolute sensitivity are summarized in Table 2.
Sensitivity and Spatial Resolution Parameters of MiniPET-2 and MiniPET-3
Image-Quality Phantom Study, Scatter Fraction, and Counting Rate Performance
Three different sections of the NU-4 IQ phantom for both MiniPET systems are displayed in Figures 5A and 5B: the fillable rods (left), uniform cylinder (center), and water and air chambers (right). The smallest rod is more visible in the image acquired with the MiniPET-3 than in the image acquired with the MiniPET-2. The spillover ratios for the two systems were similar (∼0.15 for air and ∼0.25 for water), whereas uniformity was 5.59% for the MiniPET-2 and 6.49% for the MiniPET-3 (Table 2). Recovery coefficients were comparable for both systems, whereas 4 rods had slightly higher values for the MiniPET-3 (Fig. 5C).

(A and B) Reconstructed images of NEMA NU 4 image-quality phantom for MiniPET-2 (A) and MiniPET-3 (B). (C) Corresponding recovery coefficient dependence on rod radius for both systems.
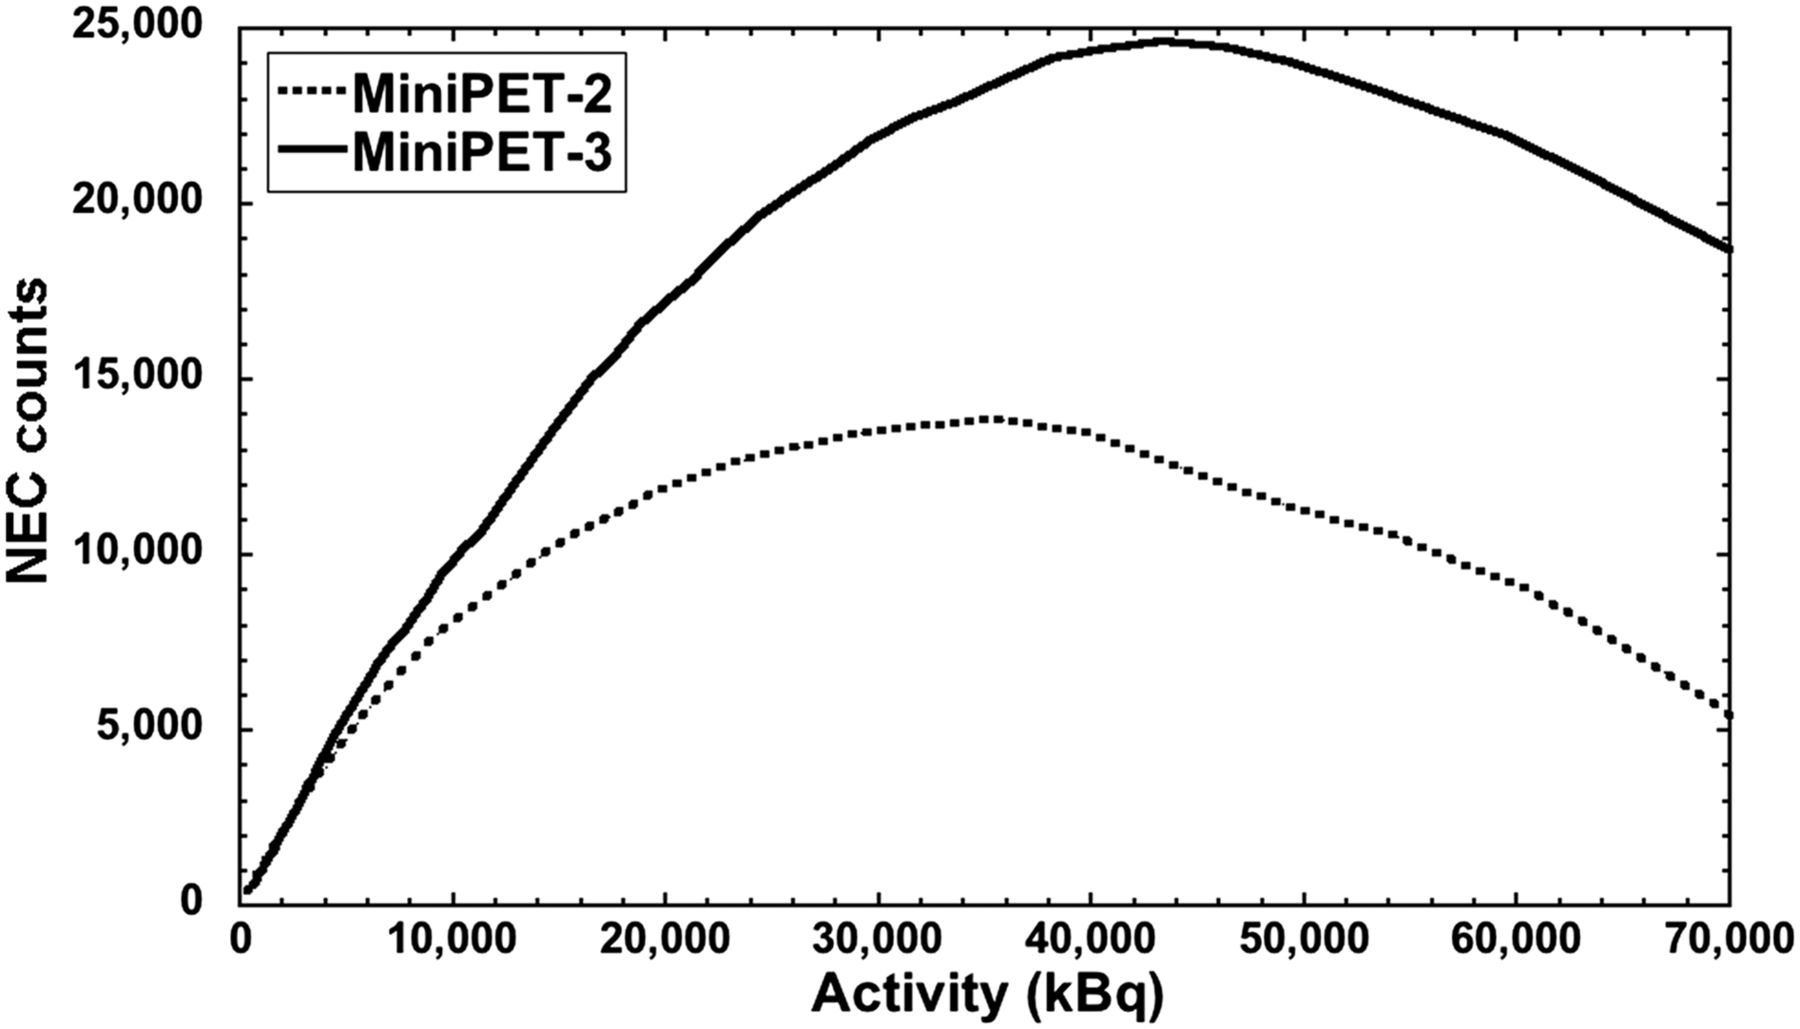
NEC was higher (better performance) for the MiniPET-3 than the MiniPET-2, whereas scatter fraction was slightly lower for the MiniPET-3 for both phantoms (Table 2). The NEC performance for the two systems as measured with the larger phantom geometry is displayed in Supplemental Figure 1 (supplemental materials are available at http://jnm.snmjournals.org). The total NEC performance for both systems had a maximum at around a 40-MBq activity level, whereas the maximum accepted NEC was approximately twice as high for the MiniPET-3 (Fig. 6).

NEC performance measured with NEMA NU 4 rat phantom for MiniPET-2 and MiniPET-3.
DISCUSSION
There have been many successful attempts to merge MRI and PET systems in recent years (4,9–11). Some authors have reported on the performance parameters of SiPM-based full-ring preclinical PET systems or MRI inserts (4,10,18,19). However, only some of the NEMA NU 4 measurement protocols have been performed on these systems. To comprehensively compare an SiPM-based system with a conventional PMT-based one, we performed all the NEMA NU 4–recommended measurements on both the MiniPET-2 and the MiniPET-3. Comparison was facilitated by the fact that the two systems share nearly identical scintillation crystal geometry. Dark noise problems can be minimized if each SiPM matrix element has an individual signal-processing channel (4,10,11), but this solution would need a tremendous number of electronic channels. To reduce the number of channels, a special readout arrangement was developed in row-column manner for the SiPM matrix. In addition, appropriate weighting circuits were directly connected to the row and column outputs, allowing the 81 SiPM signals to be decoded into 4 outputs.
From the flood-field images one can conclude that the MiniPET-3 performs about 1.5 times better in terms of peak-to-valley ratios than the MiniPET-2. In addition, discrepancies in light sharing for the two photodetectors might explain the differences in spatial resolution between the two systems. Moreover, the MiniPET-3 exhibited superior axial, radial, and tangential spatial resolution. This improvement was even more pronounced as the source was moved toward the radial edges. The overall axial system sensitivity showed similar characteristics between the systems as expected from the nearly identical scintillation crystal material and geometry. The image quality study is currently the gold standard for determining the imaging characteristics of many preclinical PET systems (8,12,16,20,21) and showed similar recovery coefficients and spillover ratios for both MiniPET systems. Better spatial resolution results in noisier images for the same number of counts, which explains the worse uniformity for the MiniPET-3. The NEC peaks occurred at similar activity levels, around 50 MBq for both systems, but these values were lower for the MiniPET-2 primarily because of the significantly higher dead time factor (680 vs. 250 ns). The inferior dead time of the MiniPET-2 resulted from differences in the pulse shaping of the front-end preamplifiers, as well as digital processing of each signal. The calculated scatter fractions from both the rat-sized and the mouse-sized phantom experiments showed comparable results, whereas the MiniPET-3 performed slightly better and the improved performance correlated with the somewhat better spillover ratios (Table 2). This finding seems to contradict the fact that the energy resolutions for the two systems are not the same. Indeed, the average energy resolution is about 32% (instead of 20%) for the SiPM-based system, 60% worse than for the PMT-based system. One reason for this discrepancy is that the calculated SF defined by the NEMA NU 4 protocol does not represent all scattered events. In fact, it includes only the photons scattered in the body. In addition, for preclinical PET systems the number of scatters is definitely higher in the scintillation crystal than in the tissue (∼50% vs. 10%) (22); thus, the energy blurring has even less effect. A second explanation for the surprising scatter fraction results is that no significant correlation could be found between the scatter fraction and the energy resolution in other preclinical systems (16).
The main disadvantage of the MiniPET-3 compared with the MiniPET-2 is the known dependence of the semiconductor-based detectors on ambient temperature (23,24). A limitation of this study is that we did not take into account the performance of the systems in high magnetic fields. However, other research groups have already proved the stability and proper performance of SiPMs in MRI systems (18,19). Although both MiniPET systems have a relatively small field of view compared with other preclinical PET systems (16,21,25), the main goal of this study was to compare SiPM with PMT technology while keeping scintillation crystal geometry, system matrix, slice rebinning algorithm, and even image reconstruction identical.
CONCLUSION
The main imaging capabilities of the SiPM-based MiniPET-3 small-animal PET system do not differ significantly from those of the conventional PMT-based MiniPET-2. On the basis of these results, we can conclude that the MRI-compatible MiniPET-3 provides results comparable to those of the conventional technology, producing high-quality small-animal images.
DISCLOSURE
The costs of publication of this article were defrayed in part by the payment of page charges. Therefore, and solely to indicate this fact, this article is hereby marked “advertisement” in accordance with 18 USC section 1734. This work was supported under the project “Central Nervous System Imaging” by the Hungarian National Development Agency (ENIAC_08-1-2011-0002) and by the ENIAC Joint Undertaking (120209). This research was supported by the European Union and the State of Hungary, cofinanced by the European Social Fund in the framework of TÁMOP-4.2.4.A/2-11/1-2012-0001 “National Excellence Program.” No other potential conflict of interest relevant to this article was reported.
Acknowledgments
We thank Darrel Hathcock, Russel Chun, Attila Forgacs, and Andrew L. Goertzen for their contributions and thoughtful conversations during the period of these measurements and evaluations.
Footnotes
Published online Oct. 8, 2015.
- © 2015 by the Society of Nuclear Medicine and Molecular Imaging, Inc.
REFERENCES
- Received for publication March 17, 2015.
- Accepted for publication August 12, 2015.


