


Abstract
Glial neuroinflammation is associated with the development and progression of multiple sclerosis. PET imaging offers a unique opportunity to evaluate neuroinflammatory processes longitudinally in a noninvasive and clinically translational manner. 18F-PBR111 is a newly developed PET radiopharmaceutical with high affinity and selectivity for the translocator protein (TSPO), expressed on activated glia. This study aimed to investigate neuroinflammation at different phases of relapsing–remitting (RR) experimental autoimmune encephalomyelitis (EAE) in the brains of SJL/J mice by postmortem histologic analysis and in vivo by PET imaging with 18F-PBR111. Methods: RR EAE was induced by immunization with PLP139–151 peptide in complete Freund's adjuvant. Naive female SJL/J mice and mice immunized with saline–complete Freund's adjuvant were used as controls. The biodistribution of 18F-PBR111 was measured in 13 areas of the central nervous system and compared with PET imaging results during different phases of RR EAE. The extents of TSPO expression and glial activation were assessed with immunohistochemistry, immunofluorescence, and a real-time polymerase chain reaction. Results: There was significant TSPO expression in all of the central nervous system areas studied at the peak of the first clinical episode and, importantly, at the preclinical stage. In contrast, only a few TSPO-positive cells were observed at the second episode. At the third episode, there was again an increase in TSPO expression. TSPO expression was associated with microglial cells or macrophages without obvious astrocyte labeling. The dynamics of 18F-PBR111 uptake in the brain, as measured by in vivo PET imaging and biodistribution, followed the pattern of TSPO expression during RR EAE. Conclusion: PET imaging with the TSPO ligand 18F-PBR111 clearly reflected the dynamics of microglial activation in the SJL/J mouse model of RR EAE. The results are the first to highlight the discrepancy between the clinical symptoms of EAE and TSPO expression in the brain, as measured by PET imaging at the peaks of various EAE episodes. The results suggest a significant role for PET imaging investigations of neuroinflammation in multiple sclerosis and allow for in vivo follow-up of antiinflammatory treatment strategies.
Multiple sclerosis (MS), a severe disorder of the central nervous system (CNS), is characterized by inflammation, myelin loss, gliosis, varying degrees of axonal degeneration, and oligodendrocyte pathology (1). The majority of MS patients experience relapsing–remitting (RR) symptoms followed by a secondary progressive phase leading to permanent disability once chronic disease has set in.
Consequently, experimental autoimmune encephalomyelitis (EAE), an animal model of MS, provides a powerful tool for investigating the pathogenesis of MS. Immunization of several rodent strains with various neuroantigens has resulted in the induction of different types of EAE (2–4) that correspond to different phases of the human disease (5). Because of the variable inflammation, demyelination, remyelination, glial proliferation, and neurodegeneration in the CNS white matter and gray matter, information (obtained noninvasively) about the early symptoms and diagnosis of MS, disease progression, and responses to various treatments would be beneficial for MS management.
In addition to conventional radiologic methods (6–8), noninvasive molecular imaging modalities (PET and SPECT) have gained importance as tools for the in vivo assessment of neuroinflammation. Significantly, upregulation of the translocator protein (TSPO) (9) is considered to be a hallmark of neuroinflammation.
In a healthy brain, the TSPO is expressed at low levels on astrocytes and resting microglial cells (10), where it is mostly involved in steroidogenesis (11) and mitochondrial function (12). However, its levels are markedly increased during neuroinflammation and neurodegeneration. Consequently, it has been suggested that TSPO functions may be important in modulating neuronal damage (12) and hence may support accelerated microglial proliferation. Furthermore, because TSPO expression in healthy subjects is not detectable, quantitative PET imaging provides an excellent opportunity to image the early symptoms of diseases through the use of radiotracers that target the TSPO (13–15).
The TSPO ligand 11C-PK11195 was one of the first PET ligands used for the imaging of activated microglia in various neurodegenerative diseases (16), and several clinical studies have been performed (17,18). Although 11C-(R)-PK11195 has been widely used, its high levels of plasma protein binding, high levels of nonspecific binding, relatively poor blood–brain barrier permeability, and short half-life limit its use in routine brain imaging (19). This fact has prompted the development of alternative PET radioligands for the TSPO, including analogs bearing the longer-lived 18F. The imidazopyridine 18F-PBR111 (20) is a high-affinity, specific radiotracer for the TSPO with excellent in vivo characteristics for use as an imaging neuroinflammation biomarker (20,21).
The aim of this project was to investigate brain neuroinflammation with postmortem histologic analysis and in vivo PET/CT with 18F-PBR111 at different phases of RR EAE in the SJL/J mouse model.
MATERIALS AND METHODS
Radiotracer
18F-PBR111 was prepared on the Tracerlab FXFN modules (GE Healthcare) as described elsewhere (22). The product was formulated to a concentration of 20 MBq/100 μL in saline containing less than 1% ethanol. The specific activity of 18F-PBR111 was 150–400 GBq/μmol. For biodistribution and competition studies, the product was diluted to 0.70 MBq/100 μL. For imaging studies, 18F-PBR111 was formulated to 0.06 nmol/100 μL of PBR111.
Animals
Female SJL/J mice were obtained from the Animal Resource Centre (Perth, Western Australia, Australia). They were housed in groups of 2 or 3 under a 12-h light–dark cycle in a temperature- and humidity-controlled environment. Food and water were freely available. This study was approved by the ANSTO or Australian Nuclear Science and Technology Organization Animal Ethics Committee, and all procedures complied with the Australian Code of Practice for the Care and Use of Animals for Scientific Purposes.
RR EAE
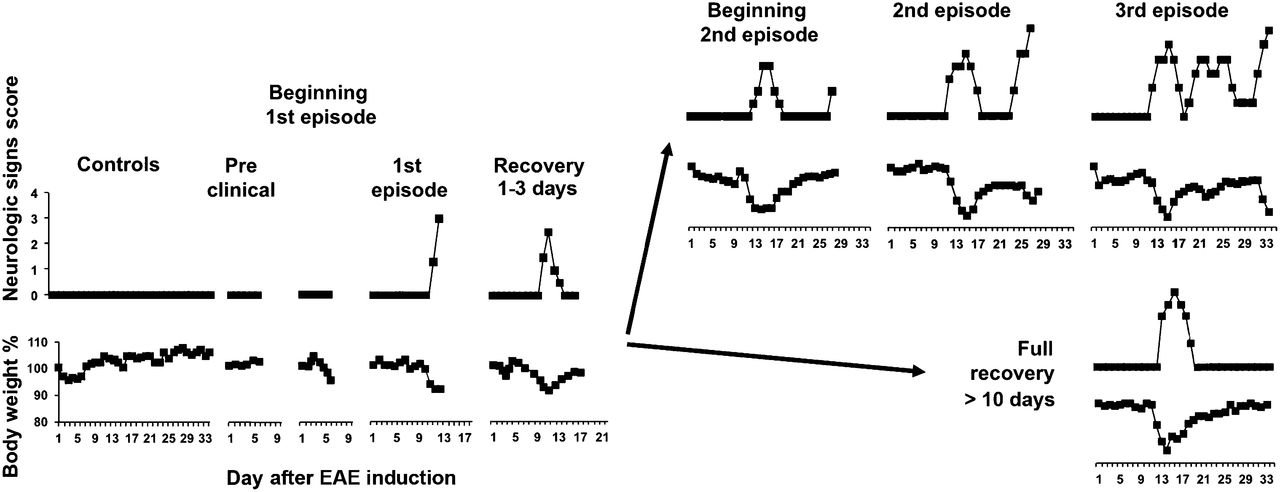
The mice (n = 75) were immunized subcutaneously in both flanks with 100 μL of an emulsion containing 50 μL of PLP139–151 peptide (50 μg of PLP139–155 peptide carboxamide, HSLGKLGHPDKF-NH2) (PLP) and 50 μL of complete Freund's adjuvant (Mycobacterium tuberculosis H37RA at 8.3 mg/mL and Mycobacterium butyricum at 0.5 mg/mL) (CFA). The mice were examined daily, and a neurologic score was assigned according to the following scale: 0, asymptomatic; 0.5, tip of the tail flaccid; 1, distal half of the tail flaccid; 1.5, 3/4 of the tail flaccid; 2, entire tail flaccid; 2.5, ataxia and difficulty righting; 3, weakness of hind limbs; and 3.5, dragging of hind feet. The body weight was also monitored, and the clinical stages of EAE were assigned according to neurologic signs and weight loss as follows: preclinical, no neurologic symptoms and no weight loss; episodes, weight loss and neurologic symptoms; recovery from episodes, decrease in neurologic symptoms and increase in body weight. Two types of controls were used: naive mice (n = 11) and mice immunized with saline–CFA (n = 14).
Biodistribution
The mice were assessed at different EAE stages: preclinical (score of 0, n = 6), first episode (scores of 1.5–3.5, n = 9), recovery from first episode (1–2 d at score of 0, n = 4), full recovery from first episode (more than 10 d at score of 0, n = 8), and second episode (scores of 0.5–3.5, n = 6). Naive mice (n = 5) and mice immunized with saline–CFA (13 d after immunization, n = 5) served as controls. The animals were injected via the tail vein with 0.70 MBq of 18F-PBR111 in 0.1 mL of saline. Tissue samples obtained from the CNS (olfactory bulbs, frontal cortex, posterior cortex, hippocampus, hypothalamus, midbrain, cerebellum, medulla oblongata, medulla pons, cervical enlargement, thoracic spinal cord, and lumbar spinal cord), peripheral organs (heart, lungs, and kidneys), and blood were removed 1 h later, weighed, and the radioactivity was measured with an automated γ-counter. The percentage injected dose was calculated by comparison with a diluted standard solution derived from the injected solution. Radioactivity concentrations were expressed as the percentage injected dose/g of wet tissue.
Competition Studies
The in vivo specificity of 18F-PBR111 was evaluated in 10 mice at the first EAE episode (clinical scores of 2–2.5). Five mice were injected with PK11195 (1 mg/kg; dissolved in saline containing 5% dimethyl sulfoxide) 5 min before the injection of 0.70 MBq of the radiotracer 18F-PBR111. Uptake in the brain and peripheral organs was compared with that in mice (n = 5) injected with 18F-PBR111 only. The mice were sacrificed 1 h later, and tissue samples were recovered for analysis. Radioactivity concentrations were calculated as described earlier.
PET Imaging
Longitudinal imaging and displacement studies were performed on an Inveon (Siemens) small-animal PET/CT imaging system. For 18F-PBR111 distribution, 12 mice immunized with PLP–CFA were imaged 6 times over a period of 35–41 d. Imaging was performed before immunization with PLP–CFA for baseline comparisons and on days 6, 13, 20, 27, 35, and 41 after immunization. Therefore, the numbers of animals at different clinical stages of EAE were as follows: preclinical (score of 0, n = 4), first episode (scores of 1.5–3.5, n = 8), recovery from first episode (score of 0.5, n = 3), recovery from first episode (3–7 d at score of 0, n = 5), full recovery from first episode (more than 10 d at score of 0, n = 5), second episode (scores of 1.5–3.5, n = 3), recovery from second episode (score of 1, n = 2), recovery from second episode (3–10 d at score of 0, n = 2), and third episode (scores of 3–3.5, n = 2). A group of control mice given saline–CFA (n = 4) and a group of naive mice (n = 6) were imaged 3 or 4 times each during the same period.
The mice were injected via the tail vein with 18F-PBR111 (0.06 nmol) and anesthetized with isoflurane (in medical oxygen; induction, 4.5%; maintenance, 1%–3%) 20 to 30 min later for PET imaging. The body temperature was maintained with a feedback-regulated heating pad. One or 2 mice were placed with their heads carefully positioned at the center of the field of view of the PET/CT scanner, and physiologic parameters (heart rate, respiration, and body temperature) were monitored (BioVet; m2m Imaging Corp.) for the entire scanning period. To avoid movement, the mouse was restrained with a webbed sock and adhesive tape. Lacri-lube (Allergan) was placed in the mouse’s eyes to prevent drying while the mouse was anesthetized.
A CT scan was conducted for 9 min on each animal (for atlas anatomic information), and then a PET acquisition was conducted for 10 min (40 min after injection of 18F-PBR111). This optimal time point was selected on the basis of preliminary studies in which animals were imaged over a period of 2 h. After each imaging study, the mouse was removed from the animal bed and placed in a warm cage to recover from anesthesia.
The displacement of 18F-PBR111 was evaluated 13 d after immunization in 10 mice, 5 of which were immunized with PLP–CFA (at the first episode; clinical scores of 2–2.5) and 5 of which were immunized with saline–CFA (controls). The mice were anesthetized with isoflurane, positioned in the PET/CT scanner as described earlier, and injected via the tail vein with 18F-PBR111 (0.06 nmol); scanning commenced simultaneously with the injection. After 50 min of imaging, PBR111 (1 mg/kg in 2% acetic acid–saline) was injected, and imaging was continued to 100 min. The mice were sacrificed by CO2 overdose, and their brains and spinal cords were removed and frozen in liquid nitrogen for immunochemistry or treated with triazole for a real-time (RT) polymerase chain reaction (PCR). Two mice that reached a clinical score of 3.5 and did not show remission over 24 h were sacrificed before the end of the longitudinal study, and their brains were removed for RT PCR.
PET Data Analysis
All PET data were reconstructed with an ordered-subset expectation maximization 3-dimensional maximum a posteriori algorithm (5 ordered-subset expectation maximization 3-dimensional iterations with 16 subsets, followed by 10 maximum a posteriori iterations; β = 0.1) (23). The dynamic PET data were converted into histograms in 30 frames (4 × 30 s, 4 × 120 s, 7 × 300 s, 1 × 240 s, 7 × 30 s, 4 × 120 s, 3 × 600 s) before reconstruction. PET and CT volumes were automatically coregistered for each of the scans. All CT volumes for the same mouse were manually coregistered to the first one (reference) with image visualization and processing software (24), and a mouse brain atlas (25) was finally coregistered to the reference. Regions of interest from the atlas were used to compute statistics. Data were converted to activity concentrations (kBq/mL) with calibration factors.
RT PCR
The olfactory bulbs, cerebellum, medulla oblongata, and lumbar spinal cords were collected from naive animals (n = 3), from animals immunized with saline–CFA (n = 3), and at the following EAE stages: first episode (n = 3), second episode (n = 3), and third episode (n = 1). The tissue samples were kept in triazole at −80°C. Total RNA was prepared according to the instructions of the manufacturer (Invitrogen). The purity of RNA was determined by the absorption by 260 nm divided by the absorption at 280 nm. RNA (5 μg) for each sample was reverse transcribed into complementary DNA with an Omniscript RT kit (Qiagen). RT PCR based on SYBR Green (Qiangen) was used to measure relative TSPO gene expression. Each sample was assayed in duplicate with the β-actin–specific primers that were used as an internal standard. Negative controls lacking the complementary DNA template were run with every assay to assess specificity. The mouse TSPO primer sets used in this study were (R) 5′-TCC CAG CTC TTT CCA GAC TAT GT and (F) 5′-TGG TAT GCT AGC TTG CAG AAA CC. PCR amplification was performed in a PCR system (Applied Biosystems). Relative quantification with the comparative threshold (Ct) method was used for analysis. The results were expressed as fold change relative to the values for controls.
Immunohistochemistry and Immunofluorescence
Brain TSPO expression was visualized by immunohistochemistry in 3 naive mice (controls) and at the first (score of 2.5, n = 3), second (score of 2.5, n = 3), and third (score of 3, n = 1) EAE episodes. Air-dried 18-μm cryostat sections were fixed in cold (−15°C) acetone for 4 min. After incubation at room temperature with Fc receptor blocking for 30 min and with 5% bovine serum albumin in phosphate-buffered saline for 1 h, the sections were incubated with an anti-TSPO antibody (goat anti–human, rat, and mouse antibody; W-12; Santa Cruz Biotechnology) overnight at 4°C. The secondary antibody was horseradish peroxidase–labeled rabbit anti-goat IgG (Santa Cruz Biotechnology), and peroxidase development was done with a Vector Laboratories kit (Vectastain DAB).
For immunofluorescence studies, blocking and labeling with the anti-TSPO antibody were done as described earlier. Astrocytes were labeled with rabbit polyclonal anti–glial fibrillary acidic protein (GFAP) antibody (Sapphire). The secondary antibody for the TSPO was phycoerythrin-labeled anti-goat IgG (Santa Cruz Biotechnology), and that for the GFAP was fluorescein isothiocyanate–labeled anti-rabbit IgG. Fluorescein isothiocyanate–labeled anti-mouse macrophage F4/80 (clone A3-1; BioLegend) and fluorescein isothiocyanate–labeled anti-mouse CD11b (BD Biosciences Pharmingen) antibodies were used to visualize activated macrophages or microglial cells. Corresponding sera and antibodies were used as controls. Fluorescence was examined with confocal microscope Leica TCS SP5 (Leica Microsystems).
Statistical Analysis
Statistical analysis was performed with Prism v5.0 (GraphPad Software Inc.). Values for control mice and mice immunized with PLP–CFA were compared by use of a one-way ANOVA followed by a Tukey or Dunnett post hoc test. A P value of less than 0.05 was considered significant. Data are expressed as mean ± SD.
RESULTS
RR EAE
Of the mice immunized with PLP–CFA (n = 75), 90% developed clinical EAE. The signs of the first episode occurred at approximately day 12, and all mice recovered from the first episode. Of the mice monitored for 35 d, 50% relapsed to a second episode, and 6% relapsed to a third episode.
A representation of the course of EAE (monophasic or RR), based on changes in neurologic symptoms and body weight, is shown in Figure 1.

Clinical course of EAE induced by PLP–CFA in SJL/J mice.
Biodistribution of and Competition with 18F-PBR111 in Mice with EAE
All groups of animals showed similar levels of uptake of 18F-PBR111 in peripheral tissues. The disease severity had no influence on 18F-PBR111 uptake or distribution in peripheral tissues. Because the levels of CNS uptake of 18F-PBR111 in the 2 types of controls (naive mice and mice immunized with saline–CFA) were not significantly different, the results (data not shown) were combined and used for comparison with the results for mice with EAE.
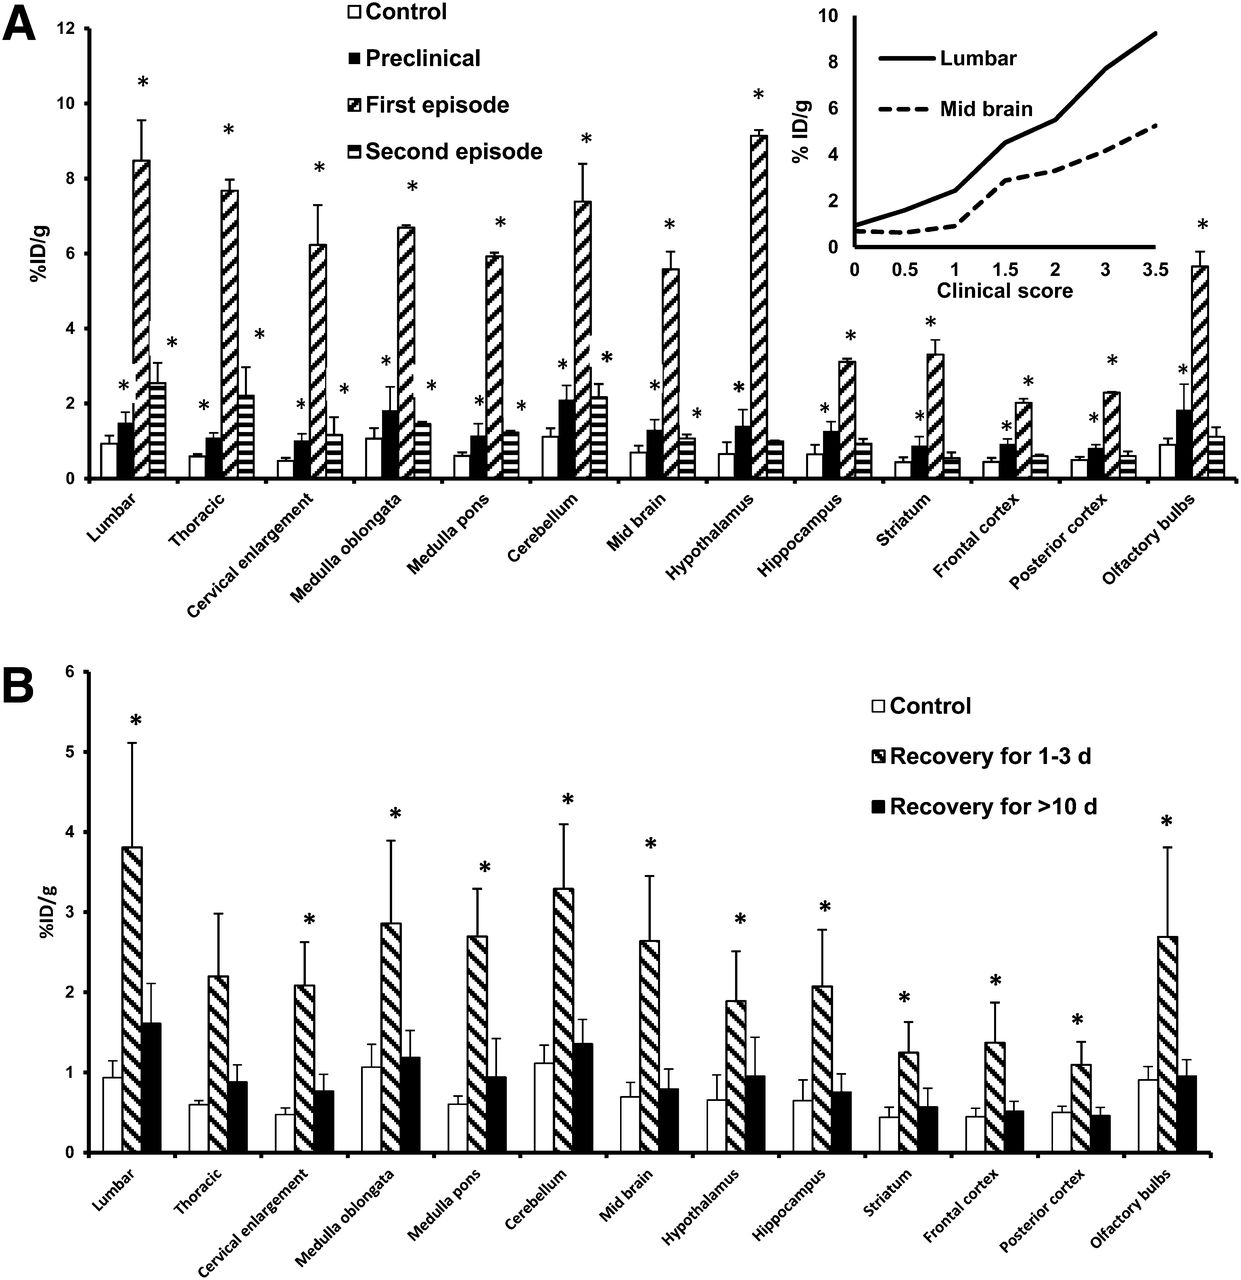
The uptake of radioactivity in the CNS reflected the clinical stage of the inflammatory process because there was a statistically significant difference (P < 0.05) between mice with clinical signs of EAE (independently of the episode) and controls (Fig. 2A). In the preclinical group (n = 6), there was a significant increase in radioactivity in all areas of the CNS (60%–100%) above the control values. The olfactory bulbs, cerebellum, and hippocampus responded first to the autoimmune inflammation, as indicated by the increased uptake of 18F-PBR111 in mice that were not yet showing any decrease in body weight (n = 2). The increase escalated to 100%–500% at the beginning of the first episode and reached 300%–1,100% at its peak. The clinical severity of EAE was reflected by an increase in the amount of ligand bound to all CNS areas and was positively correlated with the clinical scores at the first episode (Fig. 2A, inset).

Uptake of 18F-PBR111 in CNS. (A) Uptake in CNS of mice immunized with PLP–CFA. (Inset) Correlation between 18F-PBR111 uptake and clinical score at first EAE episode (n = 6–9). (B) Uptake in CNS at recovery from first EAE episode (n = 4–8). *P < 0.05 (vs. control). %ID = percentage injected dose.
Interestingly, compared with the findings for the first episode, there was a modest increase in CNS 18F-PBR111 uptake at the second episode (50%–300%). The lumbar spinal cord and thoracic spinal cord showed the largest increase (150%–300%), whereas the hippocampus, striatum, frontal cortex, posterior cortex, and olfactory bulbs were not affected at the second episode. The increase in radioactivity in the medulla oblongata, cerebellum, midbrain, and hypothalamus was between 40% and 100% (Fig. 2A).
After the first episode, as animals recovered (weight gain and decrease in neurologic deficits; 1–3 d at score of 0), the uptake of 18F-PBR111 in the CNS decreased by 50%, first in the posterior cortex and then in the frontal cortex and striatum. In mice that regained their initial body weight and did not enter a second episode, the cerebellum and spinal cord were the last to return to normal. When the animals were at score 0 for more than 10 d, the radioactivity in all CNS areas was similar to the control values (Fig. 2B).
The administration of PK11195 before the injection of the radiotracer reduced the uptake of 18F-PBR111 in the CNS by 50%–80% (Fig. 3), confirming the specificity of 18F-PBR111 binding.
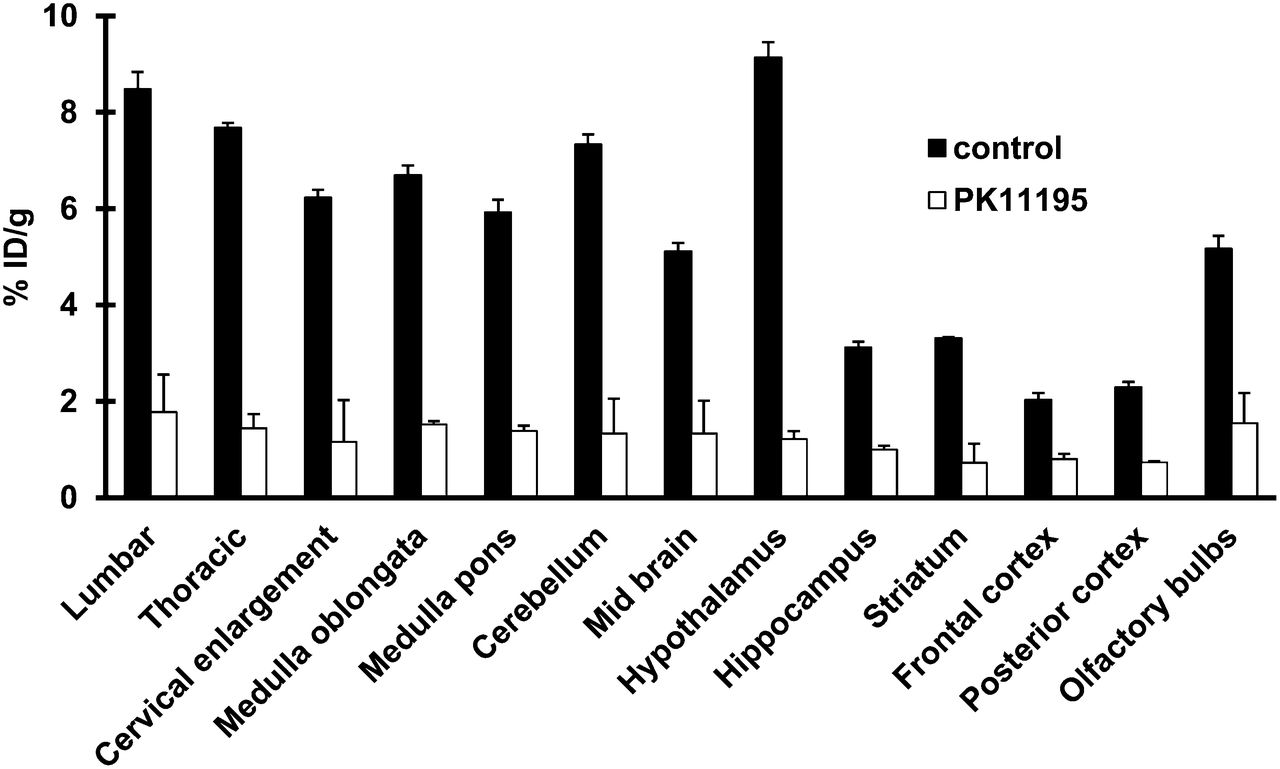
Blocking of 18F-PBR111 uptake by PK11195 in CNS of mice at first EAE episode, with clinical scores of 2–2.5 (n = 5). *P < 0.05 (vs. control). %ID = percentage injected dose.
PET Imaging
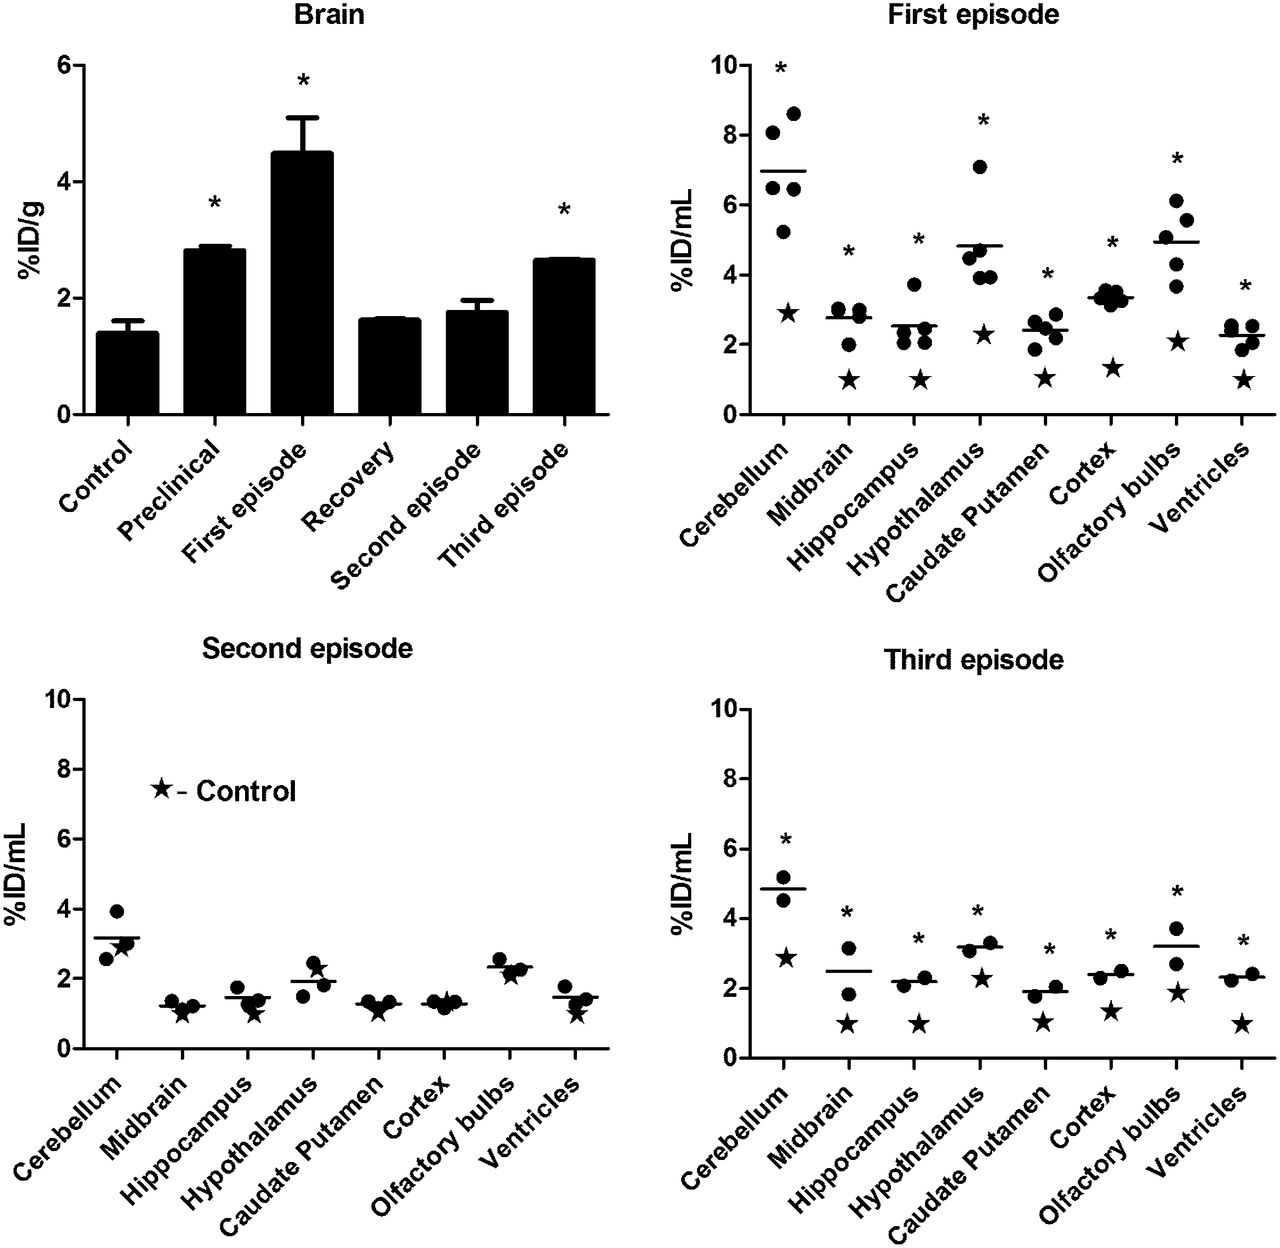
The feasibility of using the TSPO as a marker to assess the degree of glial activation in living mice was evaluated with 18F-PBR111 on a small-animal PET/CT imaging system. The average 18F-PBR111 uptake (expressed as the percentage injected dose ± SD/mL) in the brain before immunization with PLP–CFA and in naive controls (6 animals imaged 20 times; percentage injected dose, 1.4 ± 0.2/mL) was the same as the average uptake in controls immunized with saline–CFA and imaged during the 35-d study (4 animals imaged 12 times; percentage injected dose, 1.5 ± 0.1/mL). The peak average increase in radioactivity in the whole brain, 135% ± 20%, was reached at the first episode and was followed by a return to almost baseline values (5%) in animals with a clinical score of 0 for more than 10 d and no relapse (Fig. 4). Analysis of the PET images from 8 brain areas confirmed the significant difference among the 3 EAE episodes (Fig. 4). The region of the ventricles was also included, and this region exhibited the same dynamics as the others studied.

Uptake of 18F-PBR111 in CNS, as measured by PET. Brain regions at different disease stages are shown (n = 2–5): first episode, with EAE scores of 2–2.5 (n = 5); second episode, with EAE scores of 1.5–3.5 (n = 3); and third episode, with EAE scores of 3–3.5 (n = 2). *P < 0.05 for control vs. EAE. %ID = percentage injected dose.
The uptake of 18F-PBR111 in the brain, as assessed by the longitudinal PET imaging study during the course of the disease, showed a large increase in the uptake of activity at the first episode and a decrease at recovery. In agreement with the biodistribution data, the increase in the uptake of activity at the second episode was not significant, but a significant increase in uptake occurred at the third episode.
The specificity of the TSPO ligand 18F-PBR111 was demonstrated in a PET displacement study in which PBR111 was injected 50 min after the administration of the radiotracer (Fig. 5). A marked reduction in the radioactivity in the peripheral organs expressing the TSPO and in the brain (39.7% ± 3.3%; n = 5; P < 0.05) was observed. Figure 5 also shows an example of the specificity of 18F-PBR111 during PET imaging in the brain.
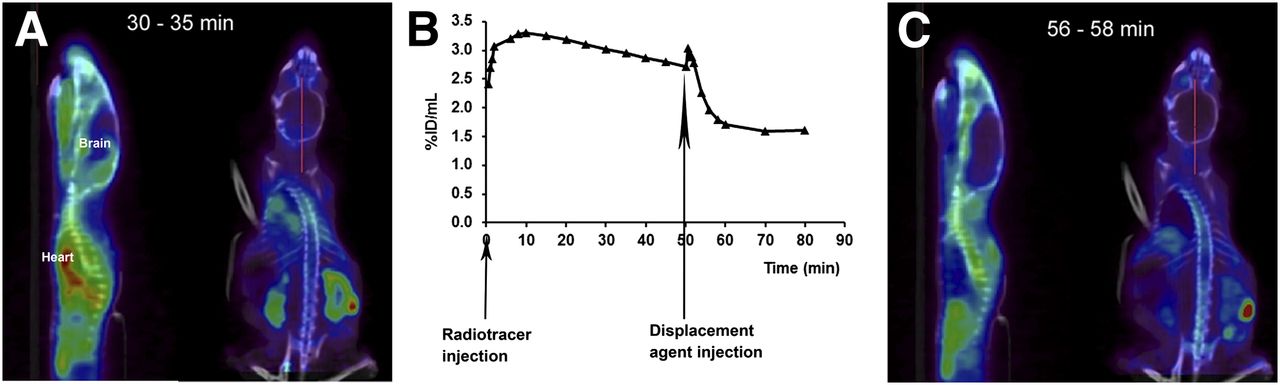
PET study of displacement of 18F-PBR111 uptake in brain at first EAE episode, with clinical score of 2, by PBR111. (A) Representative PET/CT images of 18F-PBR111 uptake at 30–35 min after radiotracer injection. (B) Representative 18F-PBR111 uptake in brain during displacement study. (C) Representative PET/CT images of 18F-PBR111 uptake after injection of PBR111. %ID = percentage injected dose.
Immunohistochemistry and RT PCR
To corroborate the uptake of 18F-PBR111 with TSPO expression (as protein and messenger RNA) in different brain structures during the EAE episodes, we performed immunohistochemistry and RT PCR (Fig. 6). By immunohistochemistry, numerous cells were found TSPO positive during the first EAE episode, whereas only a few positive cells were observed during the second episode. The number of TSPO-positive cells increased during the third episode (Fig. 6A). The dynamics of TSPO expression measured as protein closely corresponded to the expression of TSPO messenger RNA in the 4 analyzed CNS structures (olfactory bulbs, cerebellum, medulla oblongata, and lumbar spinal cord) in mice during the first, second, and third EAE episodes (Fig. 6B). TSPO expression increased significantly (P < 0.5) in the 4 regions only during the first EAE episode.
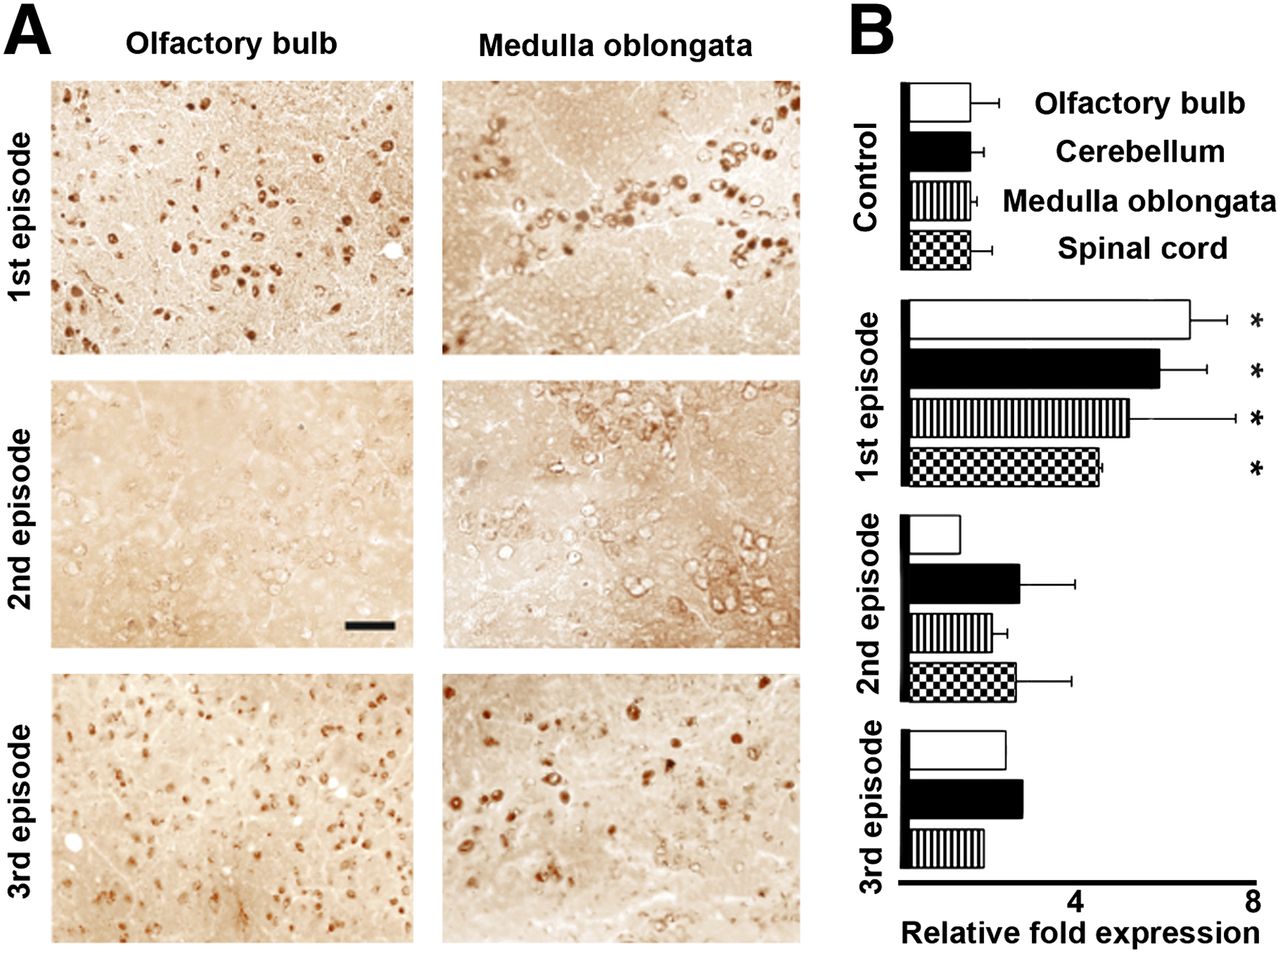
Dynamics of TSPO expression (as protein and messenger RNA) during 3 episodes of EAE induced by PLP–CFA. (A) Immunohistochemical labeling for TSPO. Bar, 25 μm. (B) RT PCR for TSPO in 4 brain areas. *P < 0.05 for EAE vs. control.
Immunofluorescence
The large differences in the CNS uptake of the TSPO ligand 18F-PBR111 during 3 EAE episodes warranted the study of cells expressing the TSPO. Double staining for astrocytes (GFAP positive) and the TSPO and double staining for activated macrophages or microglial cells (F4/80 and CD11b positive) and the TSPO were performed on brain cryosections. Figure 7 shows a good correlation between the labeling of activated macrophages or microglial cells and TSPO expression. The intense labeling of activated macrophages or microglial cells during the first episode and the weaker labeling during the third episode paralleled the significantly high level of 18F-PBR111 uptake during the first episode and the lower level of 18F-PBR111 uptake during the third episode. Only single cells appeared positive for both—F4/80 and the TSPO—during the second episode. In all the regions assessed, astrocytes (GFAP-positive cells) were TSPO negative.

Double immunostaining for astrocytes and TSPO and for activated macrophages or microglial cells and TSPO during 3 episodes of PLP-induced EAE. (Top) Activated macrophages or microglial cells were labeled for F4/80 (green) or CD11b (green; inserts) and TSPO (red). Bar, 10 μm. (Bottom) Astrocytes were labeled for GFAP (green) and TSPO (red).
DISCUSSION
In previous work, we monitored TSPO expression in rats with monophasic EAE induced by myelin basic protein–CFA (26) and transferred EAE induced by myelin basic protein–specific T lymphoblasts (27) as well as in a model of demyelination induced by cuprizone (28). In vitro and in vivo analyses with the SPECT TSPO ligand 123I-CLINDE(26–28) confirmed literature data indicating that the TSPO is expressed during neuroinflammation (14) and indicated that 123I-CLINDE is a sensitive and specific tracer of astroglial activation.
The method of EAE induction that we used resulted in the development of 1 episode with full recovery, 1 relapse with full recovery, and 2 separate relapses. This heterogeneous pattern of clinical EAE gave us the opportunity to study and compare a variety of neurologic situations.
One of the most striking results, demonstrated by both in vivo biodistribution and PET imaging, was the strong TSPO expression observed in the CNS during the first disease episode, before the appearance of any clinical signs of EAE.
It is commonly thought that EAE in rodents progresses from caudal to rostral areas of the CNS. Although this may be the case for the spinal cord as a unit, it does not always hold true for the CNS because, as shown in mice with PLP-induced EAE, there is early (preclinical) blood–brain barrier breakdown, particularly in the cerebellum (29). Similar observations obtained with histochemical and MR imaging techniques have been reported (3,30,31). The regional differences in the sensitivity of brain areas to upregulation of inflammatory molecules earlier or more rapidly (after encephalitogenic T cells producing a variety of proinflammatory molecules have passed through these areas) influence the susceptibility of different brain regions to neuroinflammation. Thus, the “easier access” for encephalitogenic lymphoblasts may explain the earlier glial activation and increased TSPO expression in the cerebellum.
With respect to the involvement of the olfactory bulbs early in the neuroinflammatory process, one should consider that the destiny of the mitotically active cells of the subventricular zone (SVZ) in adult rodents is to migrate to the olfactory bulbs, where they contribute to the replacement of granular and periglomerular neurons. In another model of RR EAE (induced with MOG35–55 in C57BL/6 mice) (32,33), it was demonstrated that EAE enhanced the migration of SVZ-derived neural stem/progenitor cells (NSC) to the olfactory bulbs and that the adult mouse SVZ is a source of newly generated oligodendrocytes that may contribute, along with oligodendrocyte precursors, to the replacement of oligodendrocytes in inflammatory demyelinating diseases of the CNS. Because it is highly probable that the same would be valid for RR EAE in SJL/J mice, the activated NSC could then express the TSPO, which would reflect the increased uptake of 18F-PBR111. Also, although morphologically mature mouse forebrain neurons are TSPO immunonegative, noninduced neural stem cells and neurons in the early stages of in vitro–induced differentiation can produce the TSPO (34).
With respect to PET imaging, our results for RR EAE parallel the PET imaging results for ethanol-induced injury in the rat striatum; that is, the extent of TSPO expression is dependent on the level of microglial activation (35).
The pattern of the relative TSPO values in different brain areas (reflecting the nonuniform distribution of microglia in these brain areas) was repeated during the 3 episodes. However, the strong increase in TSPO expression during the first EAE episode was followed by an absence of TSPO expression during the second episode and another elevation (as both messenger RNA and protein) during the third episode.
Recent reports of RR, primary–progressive, or secondary–progressive EAE models were compared with phases in the development of MS (36,37). The involvement of multipotent NSC in CNS repair after injury was reviewed. NSC reside within specialized compartments or niches in the adult mammalian CNS, and the SVZ of the lateral ventricles in the brain is one such reservoir. During the acute phase of disease, NSC become activated and initiate regeneration but lose this ability during the chronic phases of disease, and a hypothesis was raised that chronic microglial activation contributes to the failure of NSC repair potential in the SVZ.
We also found fluctuations in the PET imaging results in the zone of the ventricles (Fig. 4), and the following values for the uptake of 18F-PBR111 (compared with that in controls) were calculated: first episode, increased by 160%; second episode, increased by 18%; and third episode, increased by 100%. One could speculate that, although there was a recovery from the neurologic symptoms after the first episode, the brain microglial cells had not fully “exited” the state of activation before the beginning of the second episode and chronic microglial activation contributed to the failure of NSC repair potential in the SVZ.
However, the situation was not repeated during the third episode. The aggravation of the clinical symptoms of EAE started about 1 wk after the peak of the second episode. This finding could be attributed to the new notion that the activation of resident microglia contributes to both detrimental and protective aspects of the inflammatory process (4,38). Thus, depending on the timing, brain microglia participates in inflammation (as in the first EAE episode), does not participate in inflammation (as in the second EAE episode), or participates again (as in the third EAE episode). The third episode started about 10 d after the neurologic score of the first episode returned to 0. Ten days was also the time needed for TSPO expression to return to control values (Fig. 2B). Three markers of microglial activation (the TSPO, F4/80, and CD11b) followed these dynamics, providing support for speculation that the brain microglia may also have a protective role during the second EAE episode.
In the spinal cord, TSPO expression was also statistically increased during the second episode, although to much lower levels than during the first episode. This discordance is now under investigation. To our knowledge, the results presented are the first to highlight the discrepancy between the clinical symptoms of EAE and TSPO expression in the brain, as measured by PET imaging at the peak of different EAE episodes. Some of these findings may be clarified in ongoing clinical trials involving 18F-PBR111 and microglial activation in patients with MS.
CONCLUSION
At the first episode of RR EAE, there was a large increase in TSPO expression in several brain areas and in the spinal cord. Importantly, during preclinical RR EAE, a significant increase in 18F-PBR111 binding in all CNS areas (60%–100% above control values) suggests the potential use of TSPO screening for the early diagnosis of neuroinflammatory diseases with PET imaging.
DISCLOSURE
The costs of publication of this article were defrayed in part by the payment of page charges. Therefore, and solely to indicate this fact, this article is hereby marked “advertisement” in accordance with 18 USC section 1734. This work was supported by NHMRC grant 418092. Maria Staykova is a Visiting Fellow at The John Curtin School of Medical Research, The Australian National University. No other potential conflict of interest relevant to this article was reported.
Acknowledgments
The authors sincerely thank Dr. David Willenborg for his encouragement and advice. The authors thank Elaine Bean, Cathy Gillespie, Alexis Berard, Nicholas Howell, Emma Millard, and Kerynne Belbin for assistance with cryosections, the confocal microscope, imaging processing, and dissection.
Footnotes
Published online Jan. 15, 2013.
- © 2013 by the Society of Nuclear Medicine and Molecular Imaging, Inc.
REFERENCES
- Received for publication May 31, 2012.
- Accepted for publication September 14, 2012.


Jump to section
Related Articles
Cited By...
- In Vivo Detection of Age- and Disease-Related Increases in Neuroinflammation by 18F-GE180 TSPO MicroPET Imaging in Wild-Type and Alzheimer's Transgenic Mice
- PET Imaging of Disease Progression and Treatment Effects in the Experimental Autoimmune Encephalomyelitis Rat Model
- In Vivo Assessment of Brain White Matter Inflammation in Multiple Sclerosis with 18F-PBR111 PET
- Detection of Microglial Activation in an Acute Model of Neuroinflammation Using PET and Radiotracers 11C-(R)-PK11195 and 18F-GE-180