


Abstract
Peripheral T-cell lymphoma (PTCL) is a heterogeneous group of aggressive non-Hodgkin lymphomas with poor outcomes on current therapy. We investigated whether response assessed with PET/CT combined with baseline total metabolic tumor volume (TMTV) could detect early relapse or refractory disease. Methods: From 7 European centers, 140 patients with nodal PTCL who underwent baseline PET/CT were selected. Forty-three had interim PET (iPET) performed after 2 cycles (iPET2), 95 had iPET performed after 3 or 4 cycles (iPET3/4), and 96 had end-of-treatment PET (eotPET). Baseline TMTV was computed with a 41% SUVmax threshold, and PET response was reported using the Deauville 5-point scale. Results: With a median of 43 mo of follow-up, the 2-y progression-free survival (PFS) and overall survival (OS) were 51% and 67%, respectively. iPET2-positive patients (Deauville score ≥ 4) had a significantly worse outcome than iPET2-negative patients (P < 0.0001, hazard ratio of 6.8 for PFS; P < 0.0001, hazard ratio of 6.6 for OS). The value of iPET3/4 was also confirmed for PFS (P < 0.0001) and OS (P < 0.0001). The 2-y PFS and OS for iPET3/4-positive (n = 28) and iPET3/4-negative (n = 67) patients were 16% and 32% versus 75% and 85%, respectively. The eotPET results also reflected patient outcome. A model combining TMTV and iPET3/4 stratified the population into distinct risk groups (TMTV ≤ 230 cm3 and iPET3/4-negative [2-y PFS/OS, 79%/85%]; TMTV > 230 cm3 and iPET3/4-negative [59%/84%]; TMTV ≤ 230 cm3 and iPET3/4-positive [42%/50%]; TMTV > 230 cm3 and iPET3/4-positive [0%/18%]). Conclusion: iPET response is predictive of outcome and allows early detection of high-risk PTCL patients. Combining iPET with TMTV improves risk stratification in individual patients.
Peripheral T-cell lymphoma (PTCL) encompasses a heterogeneous and rare group of aggressive lymphomas derived from postthymic T cells. PTCL represents only 10%–15% of all non-Hodgkin lymphomas, pooling many different clinical–pathologic subtypes. Nodal subtypes, or subtypes with characteristic nodal involvement, are the most frequent subtypes encountered in white patients and account for 80% of these aggressive lymphomas (1,2). They include 4 distinct entities: PTCL not otherwise specified (PTCL-NOS), angioimmunoblastic T-cell lymphoma (AITL), and anaplastic large cell lymphoma (ALCL), either anaplastic lymphoma kinase (ALK)–positive or ALK-negative. PTCLs exhibit a poor outcome (3), with an estimated overall survival (OS) of 4.5 y and progression-free survival (PFS) of 47%–70% or 38%–61%, depending on subtype (4). The treatment approach has traditionally been based on CHOP (cyclophosphamide, doxorubicin, vincristine, and prednisone) or a CHOP-like regimen (2 miniCHOP, 18 CHOEP, 1 COEP, 1 COPADEM). However, the overall response rate is only 70%. Early progression is observed in at least 30% of patients, who exhibit a very poor outcome and are not candidates for autologous stem cell transplantation or any other consolidation therapy (4). Therefore, there is an urgent need for earlier identification of these high-risk chemoresistant patients to provide them with alternative treatment strategies. Different prognostic models have been proposed without affecting current treatment recommendations. Recently, we reported that total metabolic tumor volume (TMTV) as an estimate of the total tumor burden was predictive of outcome in PTCL (5) and may assist the early detection of high-risk patients. Detecting these patients using 18F-FDG PET/CT for response assessment during the first few cycles of chemotherapy (interim PET [iPET]) would be another prognostic approach. iPET is predictive of outcome in diffuse large B-cell lymphoma (6) and Hodgkin lymphoma (7), in which it has been successfully used to guide the treatment strategy (8). In PTCL, data concerning early response assessment with iPET are limited, as are the data on PET at the end of treatment (eotPET) for remission assessment. Studies have included relatively small numbers of patients with few comparisons between iPET and eotPET, with conflicting results (9–15). In this study, we evaluated the predictive value of PET restaging—both iPET and eotPET—and ascertained whether treatment response could be combined with TMTV to improve early stratification in nodal PTCL.
MATERIALS AND METHODS
Patients
This retrospective analysis included 140 consecutive patients from 7 European centers (France, Belgium, Switzerland, and Denmark) who, between April 2006 and May 2014, received a histologic diagnosis of PTCL (PTCL-NOS, AITL, or ALCL). Six centers were members of the Lymphoma Study Association. To be eligible, a patient had to undergo baseline 18F-FDG PET/CT and a first-line anthracycline-based chemotherapy. We evaluated all scans performed at initial diagnosis, during treatment after 2 cycles of chemotherapy (iPET2), and during treatment after 3 or 4 cycles of chemotherapy (iPET3/4), as well as eotPET. In no case was therapy changed on the basis of the iPET response, except for 3 patients in whom clinical progression was clearly observed at iPET4, leading to second-line therapy. Clinical prognostic indices, such as Ann Arbor stage, International Prognostic Index (IPI) factors and score, bone marrow involvement on biopsy, and Prognostic Index for Peripheral T-Cell Lymphoma (PIT) score (16), were evaluated. Of the 140 patients, 108 were part of a previously published study on the prognostic value of TMTV (5). In addition, 14 Danish patients were part of another previously published study (14); in the current study, the follow-up period of that previous study was extended from 29 to 47 mo. The current study was conducted in accordance with the Helsinki declaration and was approved by the Ethical Committee with a waiver of informed consent because of its retrospective, observational nature. All the data were anonymized.
18F-FDG PET/CT
All the centers followed the recommended rules for performing oncologic 18F-FDG PET/CT (17), using a Biograph Sensation 16 Hi-Rez (Siemens Medical Solutions), Gemini GXL or Gemini TOF (Philips), or Discovery (GE Healthcare) scanner (18). Five centers were accredited by EANM Research Ltd., one was accredited through a French network for multicenter-trial quality control as previously reported (5), and one followed the manufacturers’ guidelines. In every center, the same scanner was used for both baseline and posttreatment 18F-FDG PET/CT. iPET was performed as recommended (19,20), as close as possible to the successive cycles, and eotPET was performed at least 3 wk after the last exposure of the patient to anticancer drugs. Baseline TMTV, summing the metabolic volumes of all nodal and extranodal lesions, was computed using the 41% SUVmax threshold method (21) with semiautomatic software packages (Planet Onco, version 2.0 [DOSIsoft], and the Beth Israel plug-in for FIJI [Fiji Is Just ImageJ]) (22)). Bone marrow involvement was included in the volume measurement only if there was focal uptake. The spleen was considered involved if there was focal or diffuse uptake higher than 150% of the liver background. Response on iPET and eotPET was assessed using the Deauville 5-point scale, with a score of 4–5 for positivity (18F-FDG uptake higher than in the liver) (20). PET scans were independently analyzed by 2 experienced nuclear medicine physicians. The percentage decrease in SUVmax between PET0 and PET2 and between PET0 and PET4 was calculated, with iPET2 being considered negative when the former was greater than 66% (23) and iPET3/4 being considered negative when the latter was greater than 73% (24).
Statistical Analysis
PFS and OS were calculated according to the revised National Cancer Institute criteria (19). Survival functions were estimated using the Kaplan–Meier method and compared using the log-rank test. The TMTV optimal cutoff for survival prediction was determined by receiver-operating-characteristic analysis and X-tile software analysis. Data obtained at iPET3/4 were grouped, and data obtained at iPET2 and eotPET were separately analyzed. Multivariate analyses were performed using a Cox proportional-hazards model, testing each step of PET response against IPI, PIT, or TMTV. Differences between the results of comparative tests were considered significant if the 2-sided P value was less than 0.05. Clinical and baseline PET data were combined with iPET data whenever statistically relevant for PFS and OS prediction. Statistical analysis was conducted using MedCalc software.
RESULTS
Baseline Patient Characteristics and Baseline Prognostic Factors
The characteristics of the 140 patients enrolled in the study are summarized in Table 1. Most patients were treated with CHOP or a CHOP-like regimen, and the others received ACVBP (cyclophosphamide, doxorubicin, vindesine, and bleomycin); one patient received a regimen consisting of ifosfamide, cyclophosphamide, and etoposide. Consolidation therapy with stem cell transplantation, either autologous (n = 26) or allogeneic (n = 6), was performed on 32 patients under 60 y old.
Baseline Patient Characteristics (n = 140)
With a median follow-up of 43 mo, the 2-y PFS and OS of the whole population were 51% and 67%, respectively. The respective 2-y PFS and OS were 42% and 46% for PTCL-NOS, 43% and 67% for AITL, and 50% and 60% for ALK-negative ALCL. ALK-positive ALCL patients had a much better outcome, with the median PFS and OS not being reached (only 2 PFS and 1 OS events).
On univariate analysis (Table 2), an IPI greater than 2 and a PIT greater than 1 were significantly associated with an inferior prognosis for both PFS and OS, and positivity on BM biopsy was significantly prognostic of PFS. Both receiver-operating-characteristic analysis and X-tile analysis determined that the best TMTV cutoff for predicting PFS (Miller–Seigmund P < 0.0001) and OS (P = 0.0047) in this population was 230 cm3, as already published (5). TMTV was highly predictive of outcome (P < 0.0001 for PFS and P = 0.0002 for OS). In a multivariate analysis testing in 2 separate models, baseline TMTV with IPI or PIT, only TMTV remained significant for PFS (P = 0.0004, hazard ratio [HR] = 2.6, and P = 0.0008, HR = 2.5, respectively). For OS, TMTV and IPI or PIT were independently prognostic (P = 0.016, HR = 2.1, and P = 0.024, HR = 2.0, respectively, for IPI; P = 0.019, HR = 2.1, and P = 0.017, HR = 2.1, respectively, for PIT).
PET and Clinical Parameters Associated with PFS and OS on Univariate Analysis
We observed no significant impact of PFS or OS prognosis on the chemotherapy regimen (CHOP vs. other regimens) or the postinduction treatment (autologous stem cell transplantation vs. standard consolidation).
Predictive Value of PET Response Assessment
Forty-three patients underwent iPET2, 95 underwent iPET3/4, and 96 underwent eotPET. The positivity rates were 37% for iPET2, 29% for iPET3/4, and 26% for eotPET (Fig. 1).
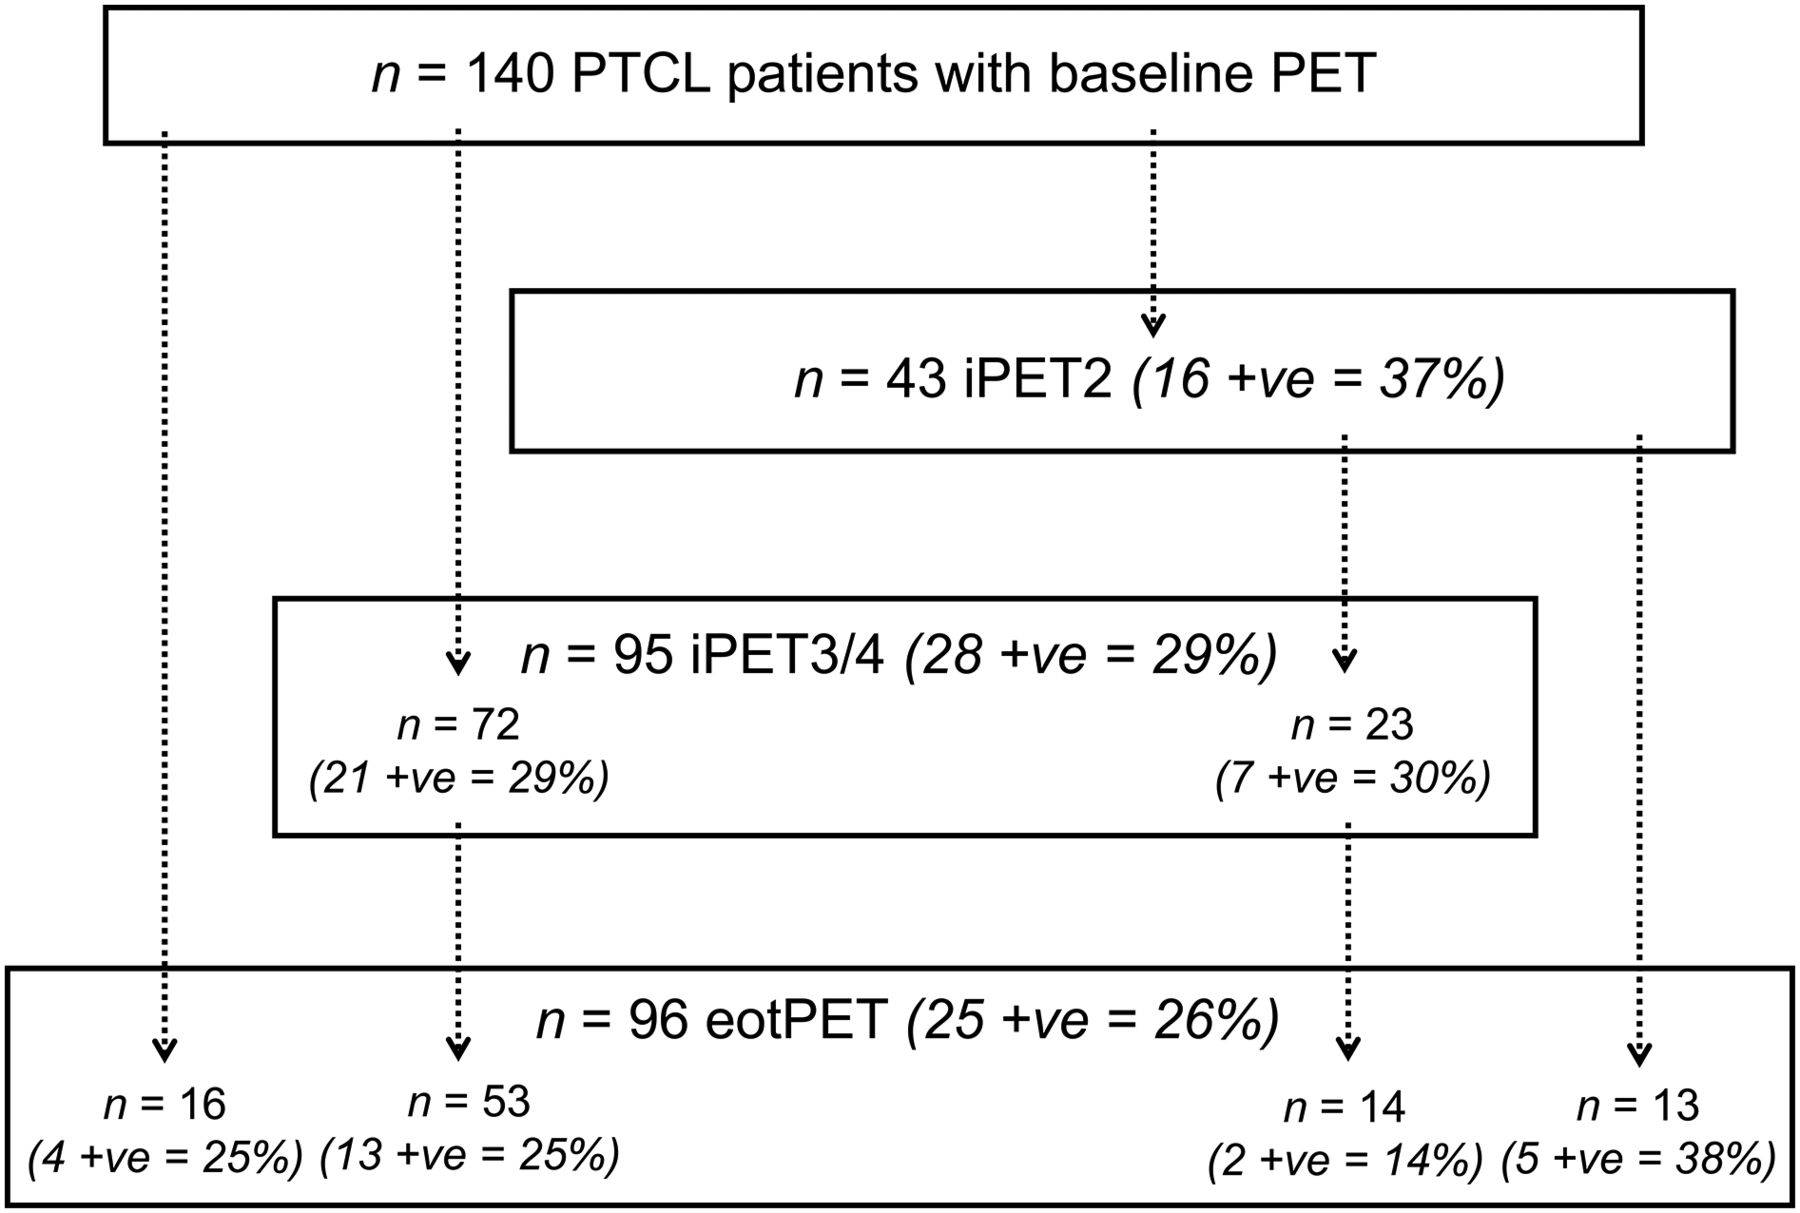
Time frame distribution of PET studies. +ve = PET-positive.
iPET2
On iPET2 (Figs. 2A and 2B), nearly all patients showing positive results relapsed within 2 y: their 2-y PFS was 6%, compared with 73% in the 63% of patients who achieved an early complete metabolic response (P < 0.0001, HR = 6.8). iPET2-positive patients also had a much lower OS than iPET2-negative patients, with a 2-y OS of 22%, compared with 84% (P < 0.0001, HR = 6.6). Patients with an SUVmax reduction of more than 66% (n = 33) also had a significantly better PFS (P = 0.0003, HR = 4.1) and OS (P = 0.0001, HR = 5.0), but an SUVmax reduction was not more prognostic than a Deauville-scale cutoff of 4.
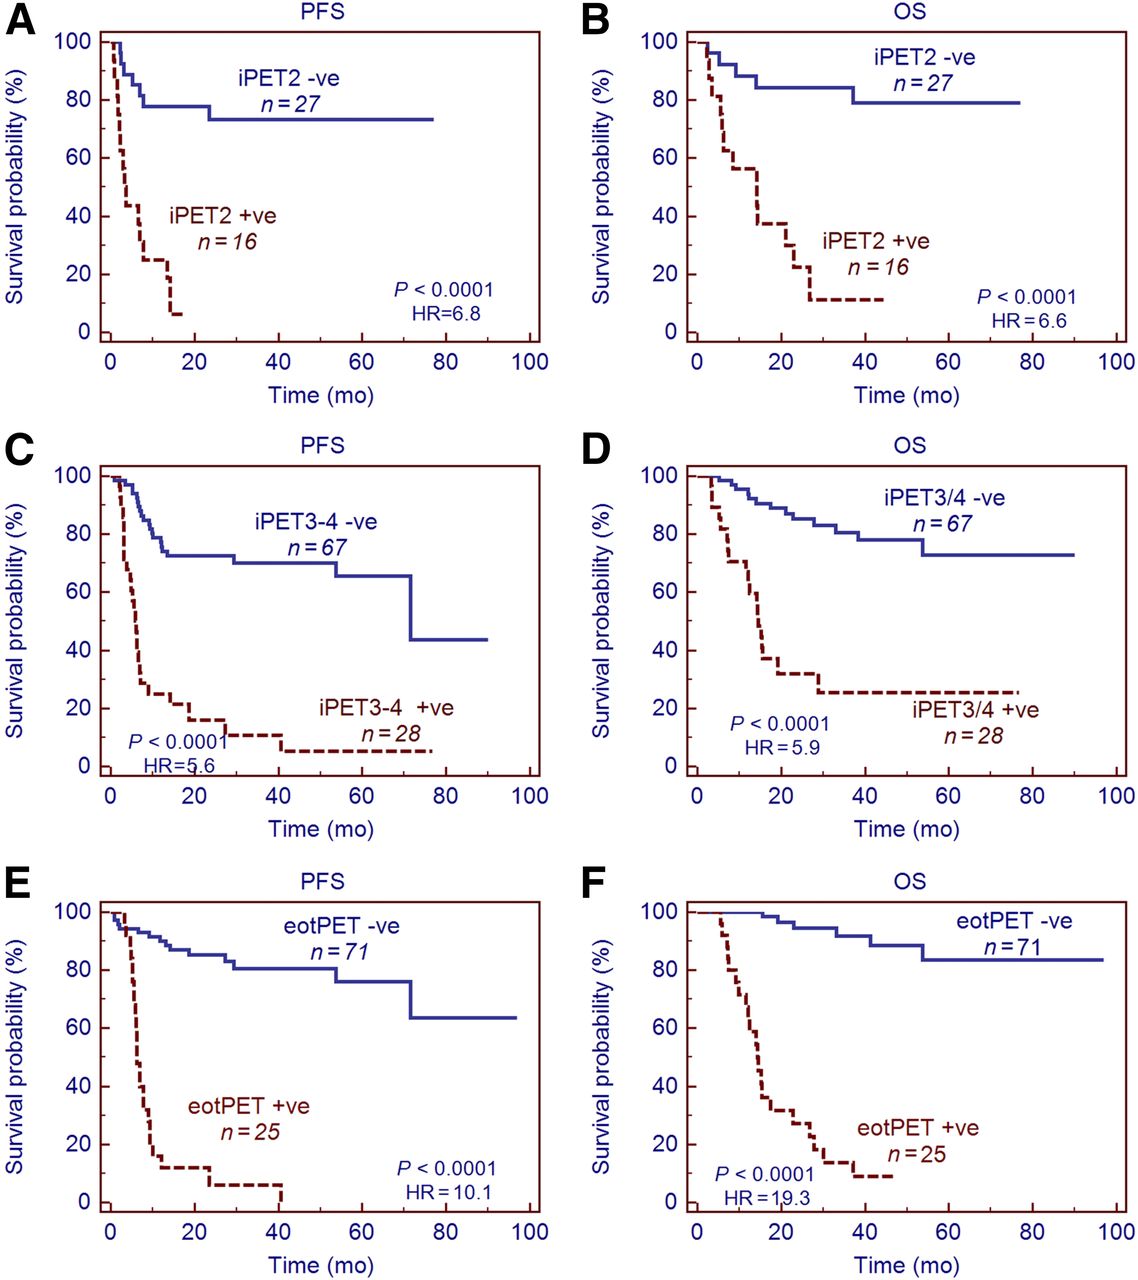
Kaplan–Meier estimates of PFS and OS according to iPET2 (A and B), iPET3/4 (C and D), and eotPET (E and F). +ve =PET-positive; -ve = PET-negative.
iPET3/4
iPET3/4 (Figs. 2C and 2D) showed similar differences: patients achieving negative iPET3/4 status had a much better prognosis, both for PFS and for OS (P < 0.0001 for both), with 2-y estimates of 72% and 85%, respectively, compared with 16% and 32% in the iPET3/4-positive group. Among the 28 iPET3/4-positive patients, 25 progressed or relapsed and 19 died. The positive predictive values of iPET3/4 for PFS and OS were 89% and 68%, respectively, and the respective negative predictive values were 69% and 81%. No significant difference in frequency of high TMTV, high IPI, or age above 60 y was observed between iPET3/4-positive and -negative patients. iPET3/4 remained a strong prognosticator for AITL, PTCL-NOS, and ALK-negative ALCL patients, for both PFS (P = 0.0001, HR = 4.8; P = 0.0012, HR = 4.8; and P = 0.0002, HR = 6.8, respectively) and OS (P = 0.0002, HR = 5.9; P = 0.0163, HR = 4.5; and P = 0.0036, HR = 5.4, respectively). iPET3/4 was not prognostic for ALK-positive ALCL patients (for whom there was only one PFS event). Patients with an SUVmax reduction of more than 73% (n = 68) also had a significantly better PFS (P < 0.0001, HR = 3.3) and OS (P < 0.0001, HR = 3.9).
eotPET
eotPET (Figs. 2E and 2F) was predictive of PFS and OS (P < 0.0001): the respective 2-y PFS and OS were 85% and 96% for eotPET-negative patients versus 6% and 27% for eotPET-positive patients. The positive predictive values were 96% and 84% and the negative predictive values were 80% and 91% for PFS and OS, respectively. In a subanalysis, eotPET maintained its predictive value for both PFS and OS for the 2 largest groups: AITL (P < 0.0001, HR = 9.8, and P = 0.0002, HR = 7.7, respectively) and PTCL-NOS (P = 0.0001, HR = 5.5, and P < 0.0001, HR = 12.3, respectively).
Evolution of PET Response During Treatment
Twenty-three patients had both iPET2 and iPET3/4 evaluations (Fig. 1). Of the 6 of 23 iPET2-positive patients, 5 remained positive at iPET3/4 and 1 became negative. Two iPET2-negative patients became positive at iPET3/4.
Twenty-seven patients had both iPET2 and eotPET. Seven were iPET2-positive, and of these, 4 (57%) remained positive at eotPET. Interestingly, all 7 iPET2-positive patients had PFS events during follow-up, including the 4 who became negative at eotPET.
In total, 67 patients had both iPET3/4 and eotPET: 16 were iPET3/4-positive, and among these, 10 (63%) remained positive at eotPET. Of the 6 patients who turned negative between iPET3/4 and eotPET, only 2 did not have PFS or OS events. Twenty-eight patients did not undergo eotPET; 12 were iPET3/4-positive, and of these, 8 died during first-line therapy.
iPET Combined with Baseline Parameters
When TMTV, the only statistically significant baseline parameter on multivariate analysis, was tested in a bivariate analysis against iPET2 or iPET3/4, both factors were independent predictors for PFS (0.0002 and 0.0078; P = 0.0001 and P < 0.0001, respectively). For OS, both factors were borderline-significant at iPET2 (P = 0.054 for TMTV and P = 0.057 for iPET2), but at iPET3/4, PET response remained significant (P < 0.0001) whereas TMTV had only borderline significance (P = 0.07). Therefore, we constructed a prognostic model combining TMTV with early PET response. With iPET3/4, TMTV stratified the population into 4 groups categorized by risk (P < 0.0001, HR = 14.3; Fig. 3). Group 1, with a 2-y PFS of 79%, included patients who had a TMTV of 230 cm3 or less and were iPET3/4-negative (43/95, 45%). Group 2, with a 2-y PFS of 59%, included patients who had a TMTV of more than 230 cm3 and were iPET3/4-negative (24/95, 25%). Group 3, with a 2-y PFS of 42%, included patients who had a TMTV of at least 230 cm3 and were iPET3/4-positive (12/95, 13%). Group 4, with a 2-y PFS of 0%, included patients who had a TMTV of more than 230 cm3 and were iPET3/4-positive (16/95, 17%). The worst prognostic group comprised 17% of the population but 35% of total events. Among iPET3/4-negative patients (n = 67), there was a trend for a lower PFS in those with a high tumor burden than in those with a low tumor burden (P = 0.06). The OS of the whole population was also significantly stratified (P < 0.0001) according to TMTV and iPET, with a 2-y OS of only 18% for the worst group (Fig. 3).

Kaplan–Meier estimates of PFS and OS according to iPET2 combined with baseline TMTV (A and B) and iPET3/4 combined with TMTV (C and D). +ve = PET-positive; -ve = PET-negative.
Similar results were found when iPET2 was combined with TMTV (P < 0.0001 for PFS and P = 0.0001 for OS; Fig. 3). Patients with a high TMTV and a poor response included 30% of the population but 59% of the total events. In a subanalysis of the iPET2-negative group (n = 27), the 7 patients with a high TMTV had a lower PFS than the 20 with a low TMTV (P = 0.0001, HR = 11.8). Most patients in the iPET2-positive group had a baseline high TMTV (13/16).
Clinical indices (IPI and PIT) and iPET2 or iPET3/4 were independent predictive factors for PFS and OS on multivariate analysis (Table 3, Supplemental Table 1; supplemental materials are available at http://jnm.snmjournals.org). IPI or PIT (Supplemental Fig. 1) combined with iPET response significantly stratified the population into 4 different risk groups for both PFS and OS.
Multivariate Analysis Testing IPI vs. iPET2, iPET3/4, or eotPET as Cofactor for Prediction of PFS and OS
DISCUSSION
In this series of 140 PTCL patients representing the major histologic entities found in Europe, we observed that imaging performed as early as iPET2 was able to identify a subset of high-risk patients with a poor outcome. This observation was further confirmed at iPET3/4. The predictive value of iPET is independent of baseline clinical indices (IPI or PIT scores). This early response could be combined with baseline TMTV for better risk stratification. Our results also emphasize the strong prognostic value of eotPET for remission assessment.
Early identification of high-risk patients with PTCL is an important step toward enabling testing of alternative therapeutic approaches. More than 12 clinical indices have been proposed to improve risk stratification (16), but with unsatisfactory results. PET restaging has been evaluated for this purpose in several studies (9–13,15,25). However, these studies included small numbers of patients, often fewer than 50, or comprised an admixture of primary-nodal and extranodal PTCL subtypes, including natural killer T-cell lymphoma, which may account for half the population in a series (11,15). Unlike nodal PTCL, which is a disseminated disease, extranodal natural killer T-cell lymphoma presents more often at stage I or II with small tumor burden. Some of the small, early studies did not find any significant predictive value for iPET, possibly because of differences in the criteria used for PET reporting (12), but patient selection was also a confounding factor (14). The initial study from El-Galaly et al. (14) included patients with a better prognosis, lower-risk IPI/PIT, less advanced stage (71%, vs. 86% in the present study), and shorter follow-up. Our results, although retrospective, rely on the largest multicenter series assessing the predictive value of PET performed at different time points during first-line therapy in the 4 main nodal PTCL entities, using the Deauville criteria for PET reporting. The positivity rate observed for early PET is within the range reported by the other studies that have included a majority of nodal PTCL (23%–31%). The data presented herein demonstrate that iPET positivity can identify high-risk patients with a very high positive predictive value. The 89% positive predictive value observed for iPET3/4 positivity is much higher than the values reported for other aggressive lymphomas, reflecting the number of high-risk patients (33%) included in our population. Conversely, patients who show a good response and iPET negativity have a favorable outcome, superior to the expected outcome observed in the PTCL population (4). eotPET confirmed but did not add much prognostic value to iPET evaluation, with a slight increase in positive predictive value from 89% to 96%. Indeed, although 37% of iPET3/4-positive patients achieved a complete metabolic response at eotPET, 75% of these patients experienced progression or died. The predictive value identified for iPET2 in this study agrees with the data recently reported from the PETAL prospective multicenter trial (NCT00554164) (26). In 76 PTCL patients, iPET2 positivity (25% of the patients), defined by an SUVmax decrease of 66% or less, was significantly predictive of outcome, with a 2-y OS of 25%, versus 79% for iPET2-negative patients (26). In the current study, the comparison with Deauville scoring clearly shows that the approach based on a percentage decrease in SUVmax has no advantage in PTCL, probably because of the very bad prognosis for this group of diseases. All these results confirm that iPET2, as a marker a chemosensitivity, is a tool for early prediction of outcome and can be used early on to determine whether a change in therapy for PTCL is needed.
The second important finding of our study is that accounting for baseline TMTV increased the predictive power of iPET. By combining iPET with baseline TMTV, we improved risk stratification for both iPET-positive and iPET-negative patients. For instance, within the PET-negative group, baseline TMTV defined a population with an excellent outcome, those with a small metabolic volume, and a population with a more moderate prognosis, those with a large metabolic volume. One advantage of the relative method of volume measurement used in this study is that, in principle, it is moderately affected by differences in instrumentation, provided all the quality controls are regularly performed and published guidelines are followed (18). However, in future prospective trials, the use of a filtered PET dataset for harmonized quantification should improve the results obtained with the new devices (27). Similar approaches combining baseline TMTV and early response have been proposed for diffuse large B-cell lymphoma (28) and Hodgkin lymphoma (29).
Finally, our findings suggest that it should also be possible to stratify the risk of progression by combining early PET with current prognostic indices, though such an approach would be less predictive.
CONCLUSION
This large body of data in a rare and heterogeneous disease provides the rationale to investigate alternative therapeutic strategies for iPET-positive patients, who are, in the main, chemoresistant to current first-line treatments. New drugs have been proposed for patients with refractory PTCL, such as the histone deacetylase inhibitor romidepsin or the anti-CD30 brentuximab in phase II trials. Early guided therapy based on iPET2 response is important to avoid undue treatment toxicity and improve the results of second-line intensified treatment. In addition, the combination of iPET data with baseline PET data identifies these poor-prognosis patients earlier and could be a useful tool for PET-adapted therapy in future trials.
DISCLOSURE
No potential conflict of interest relevant to this article was reported.
Acknowledgments
We thank Romain Ricci from the LYSARC.
Footnotes
Published online Sep. 1, 2017.
- © 2018 by the Society of Nuclear Medicine and Molecular Imaging.
REFERENCES
- Received for publication March 27, 2017.
- Accepted for publication July 18, 2017.


Jump to section
Related Articles
Cited By...
- Application of the Lugano Classification for Initial Evaluation, Staging, and Response Assessment of Hodgkin and Non-Hodgkin Lymphoma: The PRoLoG Consensus Initiative (Part 1--Clinical)
- Automated Segmentation of Baseline Metabolic Total Tumor Burden in Diffuse Large B-Cell Lymphoma: Which Method Is Most Successful? A Study on Behalf of the PETRA Consortium
- RESISTing the Need to Quantify: Putting Qualitative FDG-PET/CT Tumor Response Assessment Criteria into Daily Practice
- Time to Prepare for Risk Adaptation in Lymphoma by Standardizing Measurement of Metabolic Tumor Burden
- Baseline and interim functional imaging with PET effectively risk stratifies patients with peripheral T-cell lymphoma
- Does PET Reconstruction Method Affect Deauville Score in Lymphoma Patients?