


Abstract
18F-florbetaben is a novel 18F-labeled tracer for PET imaging of β-amyloid deposits in the human brain. We evaluated the kinetic model–based approaches to the quantification of β-amyloid binding in the brain from dynamic PET data. The validity of the practically useful tissue ratio was also evaluated against the model-based parameters. Methods: 18F-florbetaben PET imaging was performed with concurrent multiple arterial sampling after tracer injection (300 MBq) in 10 Alzheimer disease (AD) patients and 10 age-matched healthy controls. Regional brain-tissue time–activity curves for 90 min were analyzed by a 1-tissue-compartment model and a 2-tissue-compartment model (2TCM) with metabolite-corrected plasma data estimating the specific distribution volume (VS) and distribution volume ratio (DVR [2TCM]) and a multilinear reference tissue model estimating DVR (DVR [MRTM]) using the cerebellar cortex as the reference tissue. Target–to–reference tissue standardized uptake value ratios (SUVRs) at 70–90 min were also calculated. Results: All brain regions required 2TCM to describe the time–activity curves. All β-amyloid binding parameters in the cerebral cortex (VS, DVR [2TCM], DVR [MRTM], and SUVR) were significantly increased in AD patients (P < 0.05), and there were significant linear correlations among these parameters (r2 > 0.83). Effect sizes in group discrimination between 8 β-amyloid–positive AD scans and 9 β-amyloid–negative healthy control scans for all binding parameters were excellent, being largest for DVR (2TCM) (4.22) and smallest for VS (3.25) and intermediate and the same for DVR (MRTM) and SUVR (4.03). Conclusion: These results suggest that compartment kinetic model–based quantification of β-amyloid binding from 18F-florbetaben PET data is feasible and that all β-amyloid binding parameters including SUVR are excellent in discriminating between β-amyloid–positive and –negative scans.
- 18F-florbetaben
- 18F-BAY 94-9172
- 18F-AV-1
- Alzheimer disease
- β-amyloid
- compartment model
- positron emission tomography
- PET
Several PET radiotracers that bind to β-amyloid deposits in the human brain are currently in research applications for the evaluation of Alzheimer disease (AD). After the successful introduction of Pittsburgh compound B, an 11C-labeled tracer with a thioflavin-T–derived structure for β-amyloid PET imaging (1–4), fluorinated radiotracers have also been developed and successfully applied to image β-amyloid depositions in human brains. The half-life of 18F (110 min) is approximately 5.5 times the half-life of 11C, a great advantage in the routine clinical setting.
18F-florbetaben (previously known as 18F-BAY 94-9172 and 18F-AV-1) is an 18F-labeled stilbene derivative with high binding affinity (Ki = 6.7 nM) to postmortem human AD brain homogenates (5). Other 18F-labeled PET radiotracers include the fluorinated Pittsburgh compound B derivative 18F-flutemetamol (18F-GE067) (6,7), the stilbene derivative 18F-florbetapir (18F-AV-45) (8,9), and the benzofuran radioligand 18F-AZD4694 (10). 18F-florbetapir was approved for clinical use by the U.S. Food and Drug Administration in April 2012 (11).
Early-phase clinical 18F-florbetaben PET studies have demonstrated high diagnostic accuracy in the differentiation between AD patients and healthy controls (HCs) (12,13), as well as between AD patients and frontotemporal lobe degeneration (14). The utility of 18F-florbetaben PET imaging was further confirmed by a recent multicenter phase 2 study that evaluated the sensitivity and specificity of 18F-florbetaben PET in discriminating between probable AD patients (n = 81) and elderly HCs (n = 69), compared with clinical diagnosis (15).
In these studies, visual assessment or relative tissue ratio methods based on static PET images were used to assess 18F-florbetaben binding to β-amyloid deposits in the brain. For example, the study by Barthel et al. (13) used a visual scoring system conducted by 3 independent masked readers and standardized uptake value ratios (SUVRs) of 18F-florbetaben PET brain scans. That SUVR method used the radioactivity ratio of brain target regions containing β-amyloid deposits to reference tissue devoid of β-amyloid deposits (cerebellar cortex) measured at a fixed time interval after injection of the tracer. This relative quantitative approach to quantify β-amyloid binding from static PET data is practical for routine clinical situations. However, according to the tracer kinetic compartment model theory for radiotracers such as 18F-florbetaben that bind reversibly to the binding site in tissue, this tissue ratio reflects not only the available binding site density (Bavail) but also tracer delivery (blood flow) and tracer clearance to and from brain tissue (16). On the other hand, the kinetic model–based approaches for reversibly binding radiotracers may allow quantification of certain parameters that more directly reflect the binding density, although such approaches require dynamic PET data with or without serial arterial blood sampling.
The purpose of the present study was to evaluate the feasibility of kinetic model–based approaches to quantify β-amyloid binding parameters from dynamic PET data with or without blood data. The validity of the practically useful SUVR as a parameter of β-amyloid binding was also evaluated against the model-based binding parameters.
MATERIALS AND METHODS
Subjects
The subjects in the current kinetic modeling data analysis were from our phase 0 proof-of-mechanism trial (13) and consisted of 10 patients with AD (17,18) (mean age ± SD, 69 ± 7 y; Mini-Mental State Examination score, 19 ± 7; Clinical Dementia Rating score, 1–2) and 10 age-matched HCs (mean age, 67 ± 8 y; Mini-Mental State Examination score, ≥28; Clinical Dementia Rating score, 0). The local Institutional Review Board, the National Radiation Safety Committee, and the German Federal Institute for Drugs and Medical Devices approved the protocol, and written informed consent was obtained for all subjects involved in the study.
PET Image and Arterial Input Data Acquisition and Analysis
The florbetaben radiosynthesis, PET imaging, arterial sampling, and data processing were performed as recently described in detail elsewhere (13,19). In short, PET data were acquired with an ECAT HR+ scanner (Siemens/CTI) (20). 18F-florbetaben was given over 90 s (300 ± 60 MBq). Four PET scans (29 frames) were acquired over 260 min (scan 1 lasting 90 min [23 frames] and scans 2, 3, and 4 starting at 2, 3, and 4 h [two 10-min frames per scan]). A preinjection transmission scan was obtained for attenuation correction. Thirty-four hand-drawn arterial samples were collected over 240 min after tracer injection. The portion of unmetabolized 18F-florbetaben was determined by high-performance liquid chromatography, and the data points were fitted by a sum of 2 exponential functions. Because the plasma free fraction of the tracer was found to be smaller than 2% in preliminary samples and could therefore not be estimated with sufficient accuracy, no further plasma protein binding measurements were performed.
Dynamic PET data were motion-corrected and coregistered to the individual MR images. Volumes of interest were manually defined by an experienced neurobiologist in 13 brain regions with different volumes of interest for the left and right hemispheres when appropriate (Fig. 1). Time–activity curves for corresponding left and right brain structures were combined because our previous investigation (13) using standardized uptake values (SUVs) showed no significant differences between the left and right hemispheric regions. Time–activity curve data were expressed as SUV.
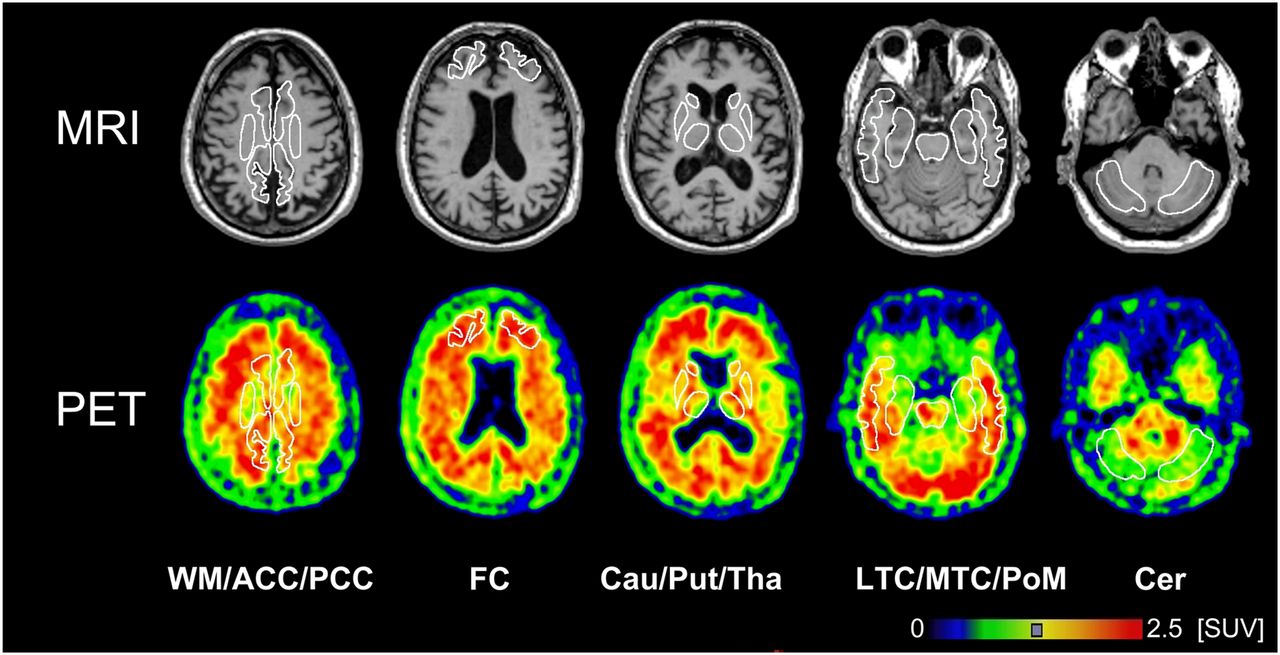
MR and 18F-florbetaben PET images of β-amyloid binding with selected volumes of interest. Images were recorded from patient AD10 (62-y-old man) and summed over 60 to 90 min after injection. ACC = anterior cingulate cortices; Cau = nucleus caudatus; Cer = cerebellar cortices; FC = frontal cortices; LTC = lateral temporal cortices; MTC = mesial temporal cortices; PCC = posterior cingulate cortices; PoM = pons/midbrain; Put = putamen; Tha = thalamus; WM =white matter.
PET Data Analysis
After the preliminary kinetic data analysis of the entire dataset, in the current data analysis only 0- to 90-min dynamic data were used, for the following 2 reasons: first, beyond 90 min, head motion artifacts between scanning sessions cannot be completely excluded; and second, there were significant errors in the measurement of the metabolite-corrected arterial input function at late time points. PET data analysis was performed for regional time–activity curve data by compartmental models, a reference tissue model, and relative tissue ratios (SUVR), and these methods were compared. Additionally, voxelwise parametric images were generated using reference tissue models.
Compartmental Models
Kinetic analysis of regional time–activity curves was performed using 1- and 2-tissue-compartment models (1TCM and 2TCM, respectively). For the 2TCM, 2 differential equations describe the time course of nondisplaceable and specifically bound tracer concentrations in the target tissue (16,21):
Kinetic rate constants are
By setting all derivatives in the differential equations (Eqs. 1 and 2) equal to zero, we can derive distribution volumes that describe the ratio of tissue to plasma concentration at equilibrium. The distribution volume of the first, nondisplaceable, compartment
Thus, using 2TCM, both receptor parameters, VS (also called
There is an additional radioactivity concentration in the vascular space in tissue. The total PET signal is then described by
To compare the adequacy of data fitting between the 1TCM and the 2TCM, Akaike weights were used as a model selection criterion (23). DVR as opposed to
Reference Tissue Models
A multilinear reference tissue model (MRTM) was used to quantify DVR from the time–activity curve data (24). Here, DVR estimated by MRTM is abbreviated as DVR (MRTM) to distinguish it from DVR (2TCM). The operational equation for the MRTM is given by
Comparison of β-Amyloid Binding Parameters
Mean β-amyloid binding and blood flow parameter values weighted for the size of the volume of interest and averaged over 4 cerebral cortical regions (frontal, lateral temporal, parietal and posterior cingulate cortices) were used to compare between β-amyloid binding–positive AD (n = 8) and β-amyloid binding–negative HC (n = 9) groups using the 2-tailed Student t test with Bonferroni adjustment for multiple comparisons when appropriate. These regions were chosen because they showed the highest β-amyloid deposition in the AD group (Fig. 2) and are known to be affected mainly in AD (12,13). “β-amyloid–positive” or “–negative” scans were defined as those scans visually interpreted unequivocally as positive or negative in our phase 0 proof-of-mechanism trial (13). The relationships between β-amyloid binding parameters by different models were evaluated by linear regression analysis, including all 11 cerebral cortical and subcortical brain regions excluding the white matter for all 10 AD and 10 HC subjects (n = 220 regions).
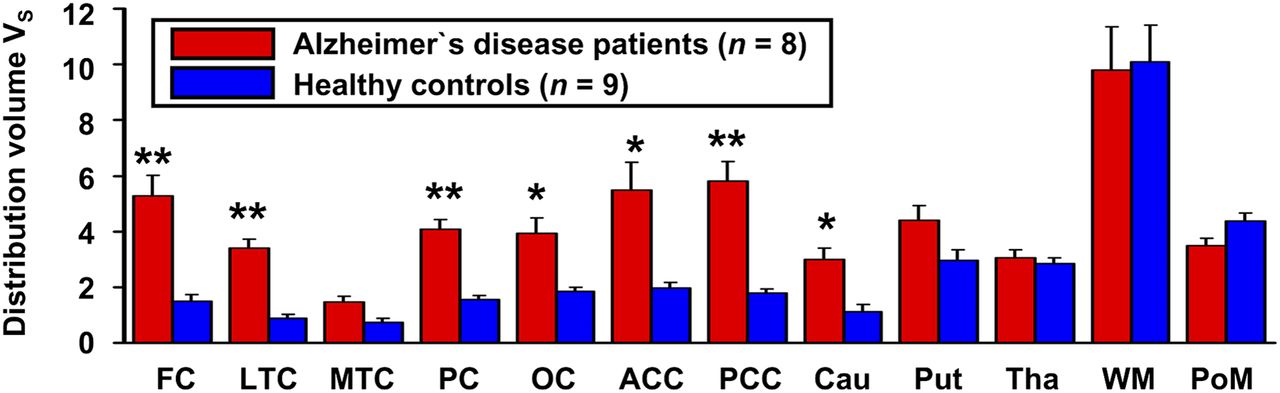
Graph showing significant increases of VS in patients with AD in frontal (FC), lateral temporal (LTC), parietal (PC), occipital (OC), anterior cingulate (ACC), and posterior cingulate (PCC) cortices and head of caudate nucleus (Cau). No significant differences are seen in mesial temporal cortices (MTC), putamen (Put), thalamus (Tha), centrum semiovale (white matter, WM), and pons/midbrain (PoM). VS is mean ± SEM for AD patients (n = 8) and HCs (n = 9). *P < 0.05. **P < 0.002.
Finally, to compare the ability of the 4 β-amyloid binding parameters (VS, DVR [2TCM], DVR [MRTM], and SUVR) to distinguish between β-amyloid–positive AD (n = 8) and –negative HC (n = 9) scans, we evaluated the group effect size computed as the ratio of the difference between 2 means and the pooled SD, also called the Cohen d (25). Mean parameter values are expressed as mean ± SD or SEM in Figure 2.
Parametric Imaging of BPND and R1
Voxelwise parametric images of
RESULTS
Compartmental Models
Figure 3 shows typical time–activity curves of 18F-florbetaben in 1 HC and 1 AD patient. In the HC, both the frontal and the cerebellar cortices showed similar time–activity curve patterns, reaching peaks (3–4 SUVs) early within 10 min and showing rapid washout thereafter, whereas the white matter showed slow and lower uptake, reaching a peak (<2 SUVs) much later and showing much slower washout (Fig. 3B). On the other hand, in the AD patient, the frontal cortex time–activity curve reached a peak slightly later and washout was much slower than in the HC whereas the cerebellar cortex and white matter time–activity curves were similar to those of the HC (Fig. 3A). Thus, 18F-florbetaben time–activity curves showed excellent reversible binding time–activity curve patterns.

2TCM fits of measured time–activity curves for frontal cortex, cerebellar cortex, and white matter in AD patient (A) and HC (B).
All brain regions required the 2TCM to describe time–activity curves adequately. The fitting of the data was poor by the 1TCM (Fig. 4), and the Akaike weights used as a model selection criterion favored the 2TCM in all regions of all subjects. Therefore, 2TCM fitting was used for the subsequent analysis. The cerebral cortical vascular fraction

Time–activity curves fitted with 1TCM and 2TCM for frontal and cerebellar cortices of AD patient.
Table 1 shows examples of parameter values and coefficients of variation estimated by 2TCM for the frontal and cerebellar cortices of the same AD and HC subjects shown in Figures 3 and 4.
Kinetic Parameters by 2TCM Fit for 1 AD and 1 HC Subject
Group mean values (8 β-amyloid–positive AD patients and 9 β-amyloid–negative HCs) of average parameter values of the 4 cerebral cortical regions and the cerebellar cortex are listed in Table 2. The mean cortical VS values were about 3 times higher in the AD group than in the HC group (P < 10−4). On the other hand, the mean
Comparison of β-Amyloid Binding and Blood Flow Parameters Between β-Amyloid–Positive AD (n = 8) and –Negative HC (n = 9) Groups
Figure 2 compares VS in all individual brain regions between the AD and HC groups. The mean VS values were significantly higher in the AD group than in the HC group in all brain regions (P < 0.05, uncorrected for multiple comparisons) except in the thalamus and white matter (centrum semiovale), where there were no differences (P > 0.9) between the 2 groups. After the correction for multiple comparisons, the mean VS values in the mesial temporal cortex (P = 0.07), putamen (P = 0.47), and pons/midbrain (P = 0.53) did not reach statistical significance. However, the mean VS values in the 4 cortical regions (frontal, lateral temporal, parietal, and posterior cingulate cortices) (P < 0.002) all were markedly higher (2.01–9.75 mL/cm3 for AD patient vs. 0.36–2.43 mL/cm3 for HC), with the highest VS values in the posterior cingulate cortex/precuneus (3.64–9.75 mL/cm3). The mean VS values were also higher, albeit to a mild degree, in the occipital and anterior cingulate cortices and in the head of the caudate nucleus in the AD group than in the HC group (P < 0.05) (Fig. 2).
Reference Tissue Models
Both the group mean DVR (MRTM) and SUVRs averaged over 4 cortical regions were significantly higher in the AD group than in the HC group (AD: DVR = 1.54 ± 0.07 and SUVR = 1.79 ± 0.14; HC: DVR = 1.18 ± 0.11 and SUVR = 1.30 ± 0.12) (P < 10−4) (Table 2).
Comparison of β-Amyloid Binding Parameters
The mean values for DVR (MRTM) in 11 cerebral cortical and subcortical brain regions in each hemisphere excluding the white matter (1.36 ± 0.25) for 10 AD patients and 10 HC subjects were 8% lower than those for DVR (2TCM) (1.47 ± 0.30) (P < 0.05). However, there was a strong linear relationship between the 2 sets of DVRs (r2 = 0.83, P < 10−4) (Fig. 5A). The corresponding mean SUVRs (1.52 ± 0.32) were 3% higher than the mean DVR (2TCM) values (1.47 ± 0.30) (P < 0.05). However, there was also a strong linear relationship between the 2 sets of SUVRs and DVR (2TCM) values (r2 = 0.85, P < 10−4) (Fig. 5B). Finally, the mean SUVRs (1.52 ± 0.32) were 12% higher than the mean DVR (MRTM) values (1.36 ± 0.25) and there was also a strong linear relationship between the SUVRs and DVR (MRTM) values (r2 = 0.90, P < 10−4) (Fig. 5C).
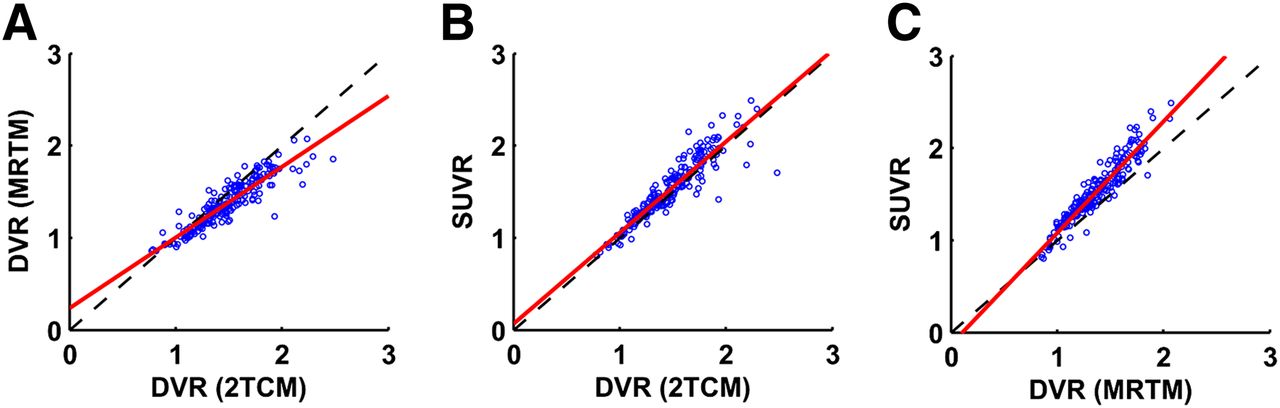
Linear regression analysis. (A) DVR computed by DVR (MRTM) and DVR (2TCM), y = 0.768x + 0.234, r2 = 0.832. (B) SUVR and DVR (2TCM), y = 0.988x + 0.068, r2 = 0.846. (C) SUVR and DVR (MRTM), y = 1.209x − 0.127, r2 = 0.898.
Figure 6 illustrates individual plots of β-amyloid binding parameters for the average of 4 cortical regions between 10 AD patients and 10 HC subjects. The effect size in comparing between the 8 amyloid-positive AD scans and 9 amyloid-negative HC scans calculated as Cohen d values (the higher values indicating the better group discrimination) were largest for DVR (2TCM) (4.22) and smallest for VS (3.25), and they were intermediate and the same for DVR (MRTM) and SUVR (4.03) (Table 2). The 4 amyloid binding parameters showed no overlap between amyloid-positive AD patients and amyloid-negative HCs (Fig. 6).

Individual plots of β-amyloid parameters in β-amyloid–positive (8 AD patients, ●) and –negative (9 HCs, ▲) subjects. Two AD patients (○) and 1 HC (△) were excluded from statistical analysis because they were scored by 3 masked readers as β-amyloid–negative and –positive, respectively. Effect size in group comparison was determined by Cohen d, and subfigures are presented in decreasing order of Cohen d values: DVR (2TCM) (A), DVR (MRTM) (B), SUVR (C), VS (D).
Parametric Imaging of BPND and R1
Examples of transaxial parametric images of

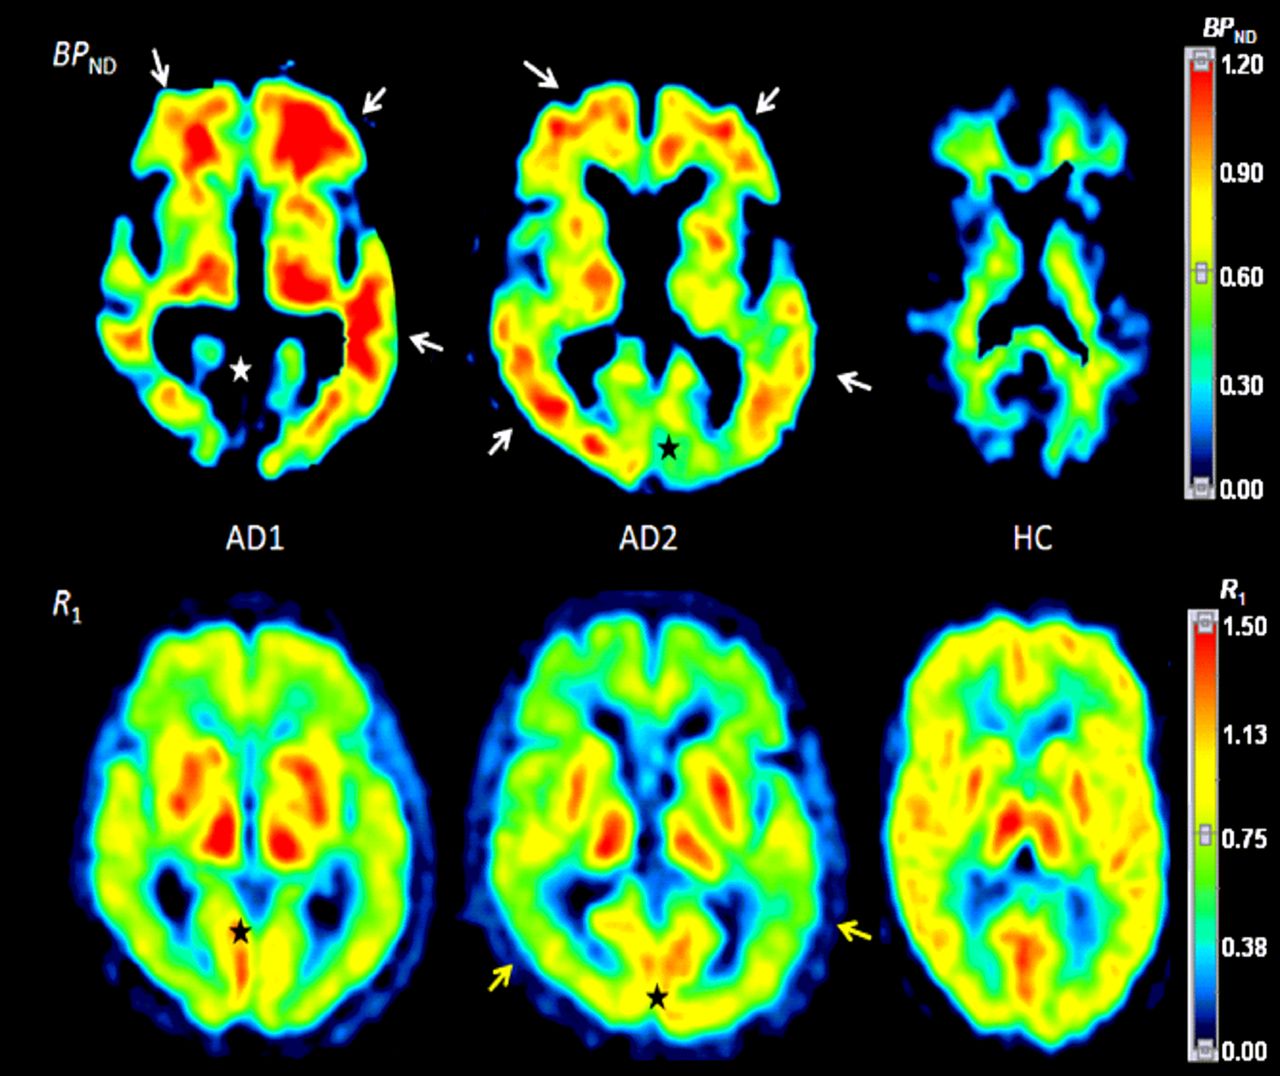
Parametric images of  (
( ) (top row) and corresponding R1 (bottom row) generated by MRTMs (MRTMO and MRTM2, respectively).
  images clearly show β-amyloid binding in frontal and temporal cortices in 2 AD subjects (white arrows) but only white matter signal with no cerebral cortical β-amyloid binding in HC subject (top right). Corresponding R1 images show decreased relative blood flow, particularly in posterior temporal lobes in AD subjects (yellow arrows) compared with HC subject.
  and R1 are 2 independent parameters. For example,
  is increased (white arrows) in regions where R1 is decreased (yellow arrows) in temporal lobes, whereas
  is only minimally increased or nearly zero in regions where R1 is not decreased (stars).
DISCUSSION
18F-florbetaben and 18F-florbetapir have recently undergone phase 3 clinical trials including postmortem histologic investigations of β-amyloid deposits in the brain of subjects who underwent PET imaging with these tracers. 18F-florbetapir PET images and the rating of postmortem results (positive or negative) for β-amyloid agreed in 96% of 29 individuals who underwent the scan within 1 y before death (8). For routine clinical studies, it would be most practical to perform static PET imaging at a fixed time after injection of the tracer. We found that both compartment model–based β-amyloid binding parameters and the practically useful tissue ratios at a fixed time after tracer injection are excellent in discriminating between β-amyloid–positive and –negative scans. Of several 18F-labeled β-amyloid compounds that have been examined in vivo, 18F-flutemetamol and 18F-AZD4694 have also been examined using a compartment analysis with arterial input function to validate the use of tissue ratios (6,10).
18F-florbetaben kinetics in the cortical and subcortical brain regions except in the white matter were relatively fast both in AD patients and HCs, with time–activity curves peaking quickly (<10 min) and showing relatively quick washout thereafter within the 90-min scan (Figs. 3 and 4). Although we performed PET imaging over 240 min in this phase 0 study in which we did not have a priori knowledge of the kinetics of 18F-florbetaben in the human brain, we chose to analyze only time–activity curves of continuously acquired 90-min data because of the logistic limitation inherent in the data beyond 90 min.
Although the regional tracer delivery rate constant
Both β-amyloid parameters—VS and DVR (2TCM)—are linearly proportional to the β-amyloid binding site density
VS can be estimated from target time–activity curve and blood data without the reference tissue data (Eq. 5). This approach requires estimation of
In the present study, compartment kinetic analysis required a 2TCM to describe the reference tissue. We carefully created cerebellar regions of interest to exclude spillover of activity from the adjacent white matter. Thus, the effect of spillover, if any, would have been minimal and would be unlikely to account for the 2TCM kinetics because the 1TCM fitting was clearly inferior to 2TCM fitting. All 3 other tracers examined using compartment analyses (3,6,10) showed 2TCM kinetics in the cerebellar cortex, including 11C-Pittsburgh compound B (3), which is known to show less white matter binding. These 2TCM kinetics in the cerebellar cortex might be due to the existence of a slow nonspecific binding compartment in the cerebellar cortex. Another potential issue regarding the use of the cerebellar cortex relates to the known presence of β-amyloid deposits in the cerebellar cortex in familial AD. The pons has been suggested as an alternative reference tissue (26). This alternative approach will need to be carefully evaluated for 18F-florbetaben in the future.
Compartmental model–based reference tissue models including MRTM allow for the estimation of
Practically useful and simple-to-calculate SUVR was an excellent β-amyloid parameter with a strong linear relationship between SUVR and DVR (2TCM), although SUVR slightly overestimated DVR (2TCM) by 3%. This excellent SUVR performance suggests that at around 90 min after injection, the tracer kinetics of 18F-florbetaben may be at so-called transient or pseudo equilibrium, a situation in which the SUVR is known to be overestimated (27). However, the pseudo equilibrium time point can be affected by changes in blood flow and tracer clearance. In the same individual at different times, such as 6 mo later after therapy, regional brain blood flow and kidney function may change significantly and SUVR from a follow-up scan performed at a fixed time after injection may be significantly altered even if there are no significant interval changes in the β-amyloid status. Therefore, in selected research studies evaluating, for example, the efficacy of a new drug for AD, DVR (MRTM) or
Finally, parametric images of
CONCLUSION
Compartment kinetic model–based quantification of β-amyloid binding from 18F-florbetaben PET data is feasible, and all β-amyloid binding parameters, including those by the reference tissue model and the practically useful SUVR, are excellent in discriminating between β-amyloid–positive and –negative scans.
DISCLOSURE
The costs of publication of this article were defrayed in part by the payment of page charges. Therefore, and solely to indicate this fact, this article is hereby marked “advertisement” in accordance with 18 USC section 1734. This trial was supported by Bayer Healthcare (Berlin, Germany). Drs. Sabri, Barthel, and Ichise received consultant honoraria from Bayer Healthcare. Drs. Sabri, Barthel, Ichise, and Becker received speaker and travel honoraria from Bayer Healthcare. Drs. Rohde, Reininger, and Schultze-Mosgau are employees of Bayer Healthcare. No other potential conflict of interest relevant to this article was reported.
Acknowledgments
We thank all patients, their caregivers, and the healthy volunteers who participated in this trial. We are also grateful to the cyclotron, radiochemistry, and PET imaging staff of the Department of Nuclear Medicine, University of Leipzig (Germany), for their excellent technical assistance.
Footnotes
↵* Contributed equally to this work.
Published online Mar. 7, 2013.
- © 2013 by the Society of Nuclear Medicine and Molecular Imaging, Inc.
REFERENCES
- Received for publication April 7, 2012.
- Accepted for publication November 5, 2012.


Jump to section
Related Articles
Cited By...
- Is Permeability Surface Area Product of [18F]Florbetaben Comparable to That of H2O?
- The RSNA QIBA Profile for Amyloid PET as an Imaging Biomarker for Cerebral Amyloid Quantification
- Validation of Noninvasive Tracer Kinetic Analysis of 18F-Florbetaben PET Using a Dual-Time-Window Acquisition Protocol
- Validation of the Semiquantitative Static SUVR Method for 18F-AV45 PET by Pharmacokinetic Modeling with an Arterial Input Function
- Prediction of the Clinical SUV Ratio in Amyloid PET Imaging Using a Biomathematic Modeling Approach Toward the Efficient Development of a Radioligand
- Standardized Expression of 18F-NAV4694 and 11C-PiB {beta}-Amyloid PET Results with the Centiloid Scale
- Impact of Training Method on the Robustness of the Visual Assessment of 18F-Florbetaben PET Scans: Results from a Phase-3 Study
- Partial-Volume Effect Correction Improves Quantitative Analysis of 18F-Florbetaben {beta}-Amyloid PET Scans
- Improved Power for Characterizing Longitudinal Amyloid-{beta} PET Changes and Evaluating Amyloid-Modifying Treatments with a Cerebral White Matter Reference Region
- Age dependence of brain {beta}-amyloid deposition in Down syndrome: An [18F]florbetaben PET study
- Molecular Imaging of Alzheimer Disease Pathology