


Abstract
Training for accurate image interpretation is essential for the clinical use of β-amyloid PET imaging, but the role of interpreter training and the accuracy of the algorithm for routine visual assessment of florbetaben PET scans are unclear. The aim of this study was to test the robustness of the visual assessment method for florbetaben scans, comparing efficacy readouts across different interpreters and training methods and against a histopathology standard of truth (SoT). Methods: Analysis was based on data from an international open-label, nonrandomized, multicenter phase-3 study in patients with or without dementia (ClinicalTrials.gov: NCT01020838). Florbetaben scans were assessed visually and quantitatively, and results were compared with amyloid plaque scores. For visual assessment, either in-person training (n = 3 expert interpreters) or an electronic training method (n = 5 naïve interpreters) was used. Brain samples from participants who died during the study were used to determine the histopathologic SoT using Bielschowsky silver staining (BSS) and immunohistochemistry for β-amyloid plaques. Results: Data were available from 82 patients who died and underwent postmortem histopathology. When visual assessment results were compared with BSS + immunohistochemistry as SoT, median sensitivity was 98.2% for the in-person–trained interpreters and 96.4% for the e-trained interpreters, and median specificity was 92.3% and 88.5%, respectively. Median accuracy was 95.1% and 91.5%, respectively. On the basis of BSS only as the SoT, median sensitivity was 98.1% and 96.2%, respectively; median specificity was 80.0% and 76.7%, respectively; and median accuracy was 91.5% and 86.6%, respectively. Interinterpreter agreement (Fleiss κ) was excellent (0.89) for in-person–trained interpreters and very good (0.71) for e-trained interpreters. Median intrainterpreter agreement was 0.9 for both in-person–trained and e-trained interpreters. Visual and quantitative assessments were concordant in 88.9% of scans for in-person–trained interpreters and in 87.7% of scans for e-trained interpreters. Conclusion: Visual assessment of florbetaben images was robust in challenging scans from elderly end-of-life individuals. Sensitivity, specificity, and interinterpreter agreement were high, independent of expertise and training method. Visual assessment was accurate and reliable for detection of plaques using BSS and immunohistochemistry and well correlated with quantitative assessments.
Florbetaben is an 18F-labeled β-amyloid tracer developed for PET. In 2014, florbetaben was approved by the U.S. Food and Drug Administration, the European Medicines Agency, and the Korean Ministry of Food and Drug Safety to detect or exclude the presence of neuritic β-amyloid plaques in the brain (1,2). In a phase-3 study, high sensitivity and specificity were demonstrated for florbetaben in the detection of β-amyloid aggregates comparing PET with postmortem histopathology (3).
The current clinical method for interpretation of florbetaben β-amyloid PET scans is visual assessment (4). Training for accurate image interpretation is a key issue for β-amyloid PET imaging—all interpreters require training and several different training tools are available. The type of interpreter training and the accuracy for visual assessment of florbetaben PET scans are unclear. To test the adequacy of the training comparing visual assessment against β-amyloid histopathology, scans from end-of-life patients are required. It is known that pronounced atrophy and other brain abnormalities can compromise image interpretation in end-of-life individuals. Indeed, severe structural brain abnormalities were present in the participants in the histopathology cohort, leading to challenging scans. If acceptable images can be obtained under these conditions, improved interpretations can be expected in the clinical setting with less technically challenging scans. Moreover, a technically difficult dataset would be likely to expose differences between training approaches (electronic training tool vs. in-person trainer) that might inform best training practices.
The aim of the present study was to test the robustness of the visual assessment method for florbetaben scans, comparing efficacy readouts (sensitivity, specificity, and κ-values) across different interpreters and training methods, against a histopathology standard of truth (SoT) in end-of-life patients. The study also compared visual and quantitative assessments of florbetaben PET, because quantification is commonly used in research and may be implemented in future clinical routine.
MATERIALS AND METHODS
Study Design and Population
This analysis was based on an international open-label, nonrandomized, multicenter phase-3 study (ClinicalTrials.gov: NCT01020838). The study was conducted in accordance with the Declaration of Helsinki, and approvals from regulatory authorities and ethics committees were obtained.
Participants were recruited from 15 centers (including dementia clinics with brain-bank experience, hospices, private practices, and dementia self-help groups) in Australia, Europe, Asia, and North America and examined between February 2010 and August 2013. Eligible subjects were nondemented individuals (n = 9) and patients with Alzheimer disease (AD; n = 60), dementia with Lewy bodies (n = 4), or other dementias (n = 9). Key exclusion criteria were cerebral large-vessel disease, brain tumors, and cardiovascular instability requiring intensive care or therapeutic intervention. All participants (or their legal representatives) provided written informed consent to undergo brain MRI and PET scanning with florbetaben and to donate their brain for postmortem examination. Details of the study methods have been presented previously (3).
Brain Image Data Acquisition
PET images were acquired 90–110 min after intravenous injection of 300 MBq ± 20% florbetaben (5) according to a standardized acquisition and image-processing protocol established during a technical visit to each center. Three-dimensional volumetric T1-weighted brain MR images (e.g., magnetization prepared rapid gradient echo or spoiled gradient recalled sequences) were collected.
Study Design
Florbetaben scans were assessed visually and quantitatively and results compared with β-amyloid presence/absence in pathology. For visual assessment, either in-person training (n = 3 expert interpreters) or an electronic training (e-training) method (n = 5 naïve interpreters) was used. Composite SUVRs were determined (6), and receiver-operating-characteristic curve analysis was used to ascertain the optimal threshold for the sensitivity/specificity calculations. The composite SUVR providing the highest sum of sensitivity and specificity was selected as a cutoff value.
Visual Assessment Method
The in-person expert training and electronic training modules were identical in approach and content (6,7). The training emphasized normal white matter anatomy using structural MRI and coregistered florbetaben PET images to appreciate white matter–gray matter boundaries because a positive scan demonstrates extension of radiotracer uptake beyond the cortical white matter to adjacent gray matter in key brain regions. Specifically, interpreters used a regional cortical tracer uptake scoring system (RCTU) (1, no tracer uptake; 2, moderate tracer uptake; 3, pronounced tracer uptake) in 4 brain areas: lateral temporal cortex, frontal cortex, posterior cingulate cortex/precuneus, and parietal cortex (Fig. 1). The resulting scores condense into a binary interpretation (score 1, negative; score 2 or 3, positive). An RCTU score of 1 in each brain region led to a brain amyloid plaque load (BAPL) score of 1, and an RCTU score of 2 in any brain region and no score 3 led to a BAPL score of 2. An RCTU score of 3 in any of the 4 brain regions led to a BAPL of 3.
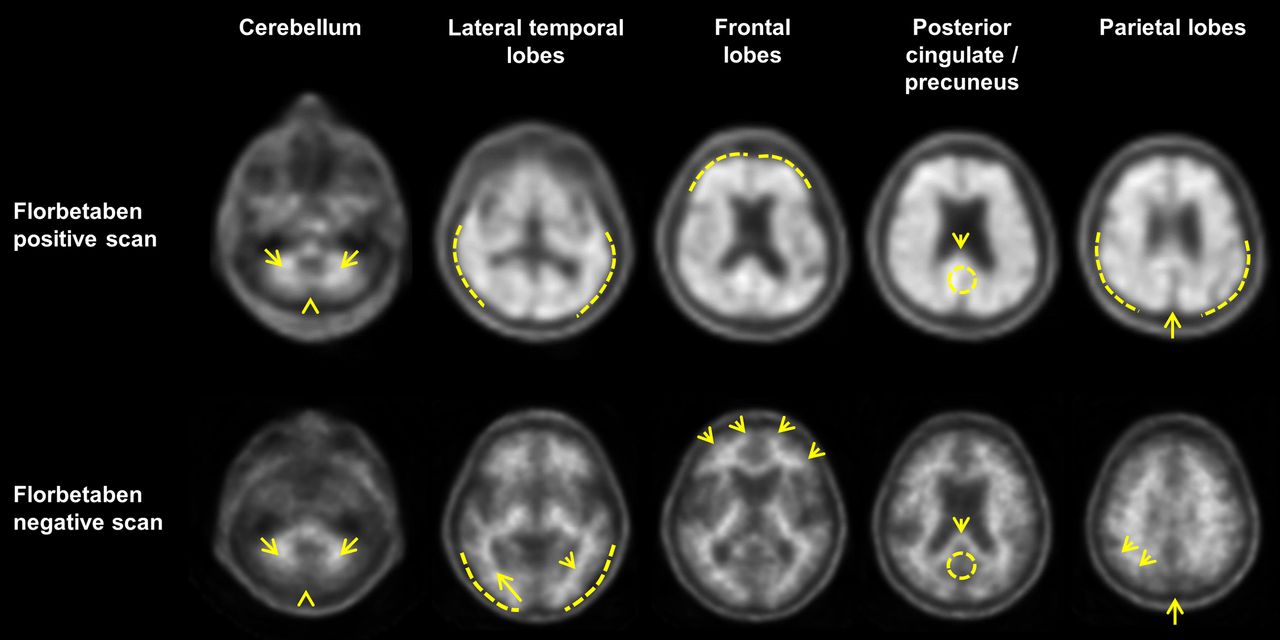
Visual patterns of abnormality and normality taught to interpreters using electronic training tool or during in-person training. (Cerebellum) Contrast between white matter (arrows) and gray matter is seen in both negative and positive scans. Extracerebral tracer uptake in scalp and in posterior sagittal sinus (arrowhead) can be seen. (Lateral temporal lobes) Positive scan shows plumped, smooth appearance of outer border of brain (dashed line) from tracer uptake in gray matter. Spiculated or mountainous appearance of white matter (arrows) characterizes negative scan. (Frontal lobes) Positive scan shows that tracer uptake has plumped, smooth appearance due to gray matter signal (dashed line). Spiculated appearance of white matter in frontal lobes (arrows) is seen in negative scan. (Posterior cingulate/precuneus) Adjacent to splenium (arrow), region appears as hypointense hole (circle) in negative scan, whereas this hole is absent (circle) in positive scan. (Parietal lobes) In positive scan, midline between parietal lobes is thinner. Cortical areas are filled up and show smoother appearance as uptake extends to outer rim. In negative scan, midline between parietal lobes can be easily identified (long arrow); white matter has spiculated appearance (short arrow) with less uptake to outer rim (dashed line).
No access to other scan orientations (i.e., coronal, sagittal) and no reorientation or structural information from CT or MRI were available to interpreters. Interpreters viewed scans in gray scale only. There were some minor differences between the training, as the trainees could not ask questions of an expert interpreter during the review with the electronic training tool.
All images were assessed by 8 interpreters: 3 in-person–trained experts and 5 naïve interpreters trained using an e-training tool. All interpreters were nuclear medicine physicians. The expert interpreter was defined as having direct experience with PET amyloid scans. The naïve interpreter had no experience with the visual assessment method and was not involved in any pivotal study using an 18F-labeled amyloid imaging agent.
Quantitative Assessment Method
Brain PET image quantification was performed using a standardized volume-of-interest template applied to the spatially normalized gray matter PET image based on a gray/white/cerebrospinal fluid segmentation of the participant’s T1-weighted volumetric MRI (6). A region-of-interest template (6) sampled the lateral temporal, frontal, anterior and posterior cingulate gyrus/precuneus, and parietal lobes, which were averaged to determine composite SUVRs calculated using the cerebellar cortex as the reference tissue. Eighty-one of the 82 brains were evaluated in this fashion; in 1 scan the segmentation process failed because of poor technical quality of the MRI.
Pathology SoT
Brain samples from 82 participants who died during the study were used to determine the histopathologic SoT. Six brain regions were examined with both Bielschowsky silver staining (BSS) and immunohistochemistry for the β-amyloid protein: middle frontal gyrus, occipital cortex, hippocampus/parahippocampal gyrus, anterior cingulate cortex, posterior cingulate cortex/precuneus, and cerebellar cortex.
The presence of amyloid plaques was assessed by a blinded histopathology consensus panel of 3 expert neuropathologists using 2 different methods: BSS and immunohistochemistry for β-amyloid. For the analysis presented here, only neuritic plaques and cored plaques were considered. Neuritic plaque density (as detected by BSS) was assessed according to the Consortium for Establishing a Registry for Alzheimer Disease criteria (8), providing a semiquantitative score with the categories absent, sparse, moderate, or frequent. The same semiquantitative categories were used to score the number of cored plaques detected by β-amyloid immunohistochemistry. β-amyloid was regarded as present in a given brain region when sufficient neuritic or cored plaques were present to achieve a score of moderate or frequent.
Importantly, BSS is not specific for β-amyloid deposits and also has some technical limitations that may hinder the identification of some neuritic plaques in AD (9). The combination of BSS and immunohistochemistry for β-amyloid is recommended in current neuropathologic guidelines for assessment of AD pathology (10,11). Therefore, both BSS and BSS + immunohistochemistry data were used for further analyses.
Statistical Analysis
Sensitivity, specificity, and accuracy were evaluated by comparing visual assessments with the histopathologic SoT. Independent Mann–Whitney tests were performed to compare the reported parameters between training groups. The reliability of visual assessment was evaluated by Cohen and Fleiss κ. To investigate the intrainterpreter agreement, a random subsample of images (22 for the in-person–trained group and 20 for the e-trained group) was reinterpreted by all interpreters. The association between quantitative and visual assessments was evaluated with a χ2 test.
RESULTS
Study Population and Postmortem β-Amyloid Histopathology
In total, 205 end-of-life individuals underwent florbetaben PET imaging (52% men; mean age ± SD, 76.9 ± 11 y [range, 48–98 y]). As of August 2013, 82 participants had died and undergone autopsy and postmortem histopathology (clinical diagnoses: AD, n = 60; dementia with Lewy bodies, n = 4; other dementias, n = 9; nondemented, n = 9). Comparison of clinical diagnosis of AD and β-amyloid pathology (BSS + immunohistochemistry as SoT) revealed a discordance in some patients with AD, with 13 of the 60 patients with a clinical diagnosis of probable AD found to be β-amyloid–negative. Of the 4 subjects with dementia with Lewy bodies as clinical diagnosis, 2 were β-amyloid–positive. Seven of the 9 subjects clinically classified as other dementia were β-amyloid–negative. Four of the 9 nondemented healthy elderly subjects were β-amyloid–positive. In total, of the 82 brains examined by histopathology, 56 were β-amyloid–positive and 26 were β-amyloid–negative with BSS + immunohistochemistry as SoT. When BSS was used alone, 52 brains were β-amyloid–positive and 30 β-amyloid–negative.
Sensitivity and Specificity of Visual Assessment
Of the 82 PET scans assessed in this study, 81 were classified equally by both training groups. With BSS + immunohistochemistry as SoT, a median sensitivity of 98.2% (range, 94.6%–98.2%) was obtained for the 3 in-person–trained interpreters and 96.4% (range, 91.1%–100%) for the 5 e-trained interpreters. With BSS alone, median sensitivity was 98.1% (range, 96.2–98.1) and 96.2% (range, 90.4%–100%), respectively (Table 1). With BSS + immunohistochemistry, median specificity was 92.3% (range, 88.5%–92.3%) for the in-person–trained interpreters and 88.5% (range, 53.9%–92.3%) for the e-trained interpreters, whereas BSS alone led to 80.0% (range, 76.7%–83.3%) and 76.7% (range, 46.7%–80%), respectively (Table 1). Median accuracy with BSS + immunohistochemistry was 95.1% (range, 93.9%–96.3%) for in-person–trained interpreters and 91.5% (range, 84.1%–93.9%) for e-trained interpreters. BSS alone as SoT had a median accuracy of 91.5% (range, 90.2%–91.5%) for in-person–trained interpreters and 86.6% (79.3%–89%) for e-trained interpreters (Table 1). Independent Mann–Whitney tests were performed to compare the reported parameters between training groups. No statistical differences were found for sensitivity and specificity, independent of the SoT. Accuracy was higher for expert in-person–trained interpreters than for the e-trained interpreters (P = 0.03) (Table 1). Individual interpreter results of visual assessments are provided in Supplemental Table 1 (supplemental materials are available at http://jnm.snmjournals.org).
Sensitivity, Specificity, and Accuracy of Visual Florbetaben PET Scan Interpretations for 8 Interpreters (n = 82 Scans)
Inter- and Intrainterpreter Agreement
Interinterpreter agreement (Fleiss κ) was 0.89 (considered excellent; 95% confidence interval [CI], 0.82–0.97) for expert in-person–trained interpreters and 0.71 (considered very good; 95% CI, 0.62–0.81) for naïve e-trained interpreters (Table 2). Median intrainterpreter agreement was 0.9 (range, 0.79–0.90) for expert in-person–trained interpreters and 0.9 (range, 0.66–1.00) for e-trained interpreters (Table 3).
Interinterpreter Cohen κ-Values*
Intrainterpreter Cohen κ-Values
Comparison of Visual and Quantitative Assessments
Eighty-one of 82 images were evaluated with both quantitative and visual methods by the in-person–trained interpreters and e-trained interpreters. Receiver-operating-characteristic curve analysis of composite gray matter SUVRs resulted in an optimal cutoff of 1.47 with a sensitivity of 85.7% (95% CI, 73.8%–93.6%) and a specificity of 92.0% (95% CI, 74.0%–99.0%). Seventy-one (87.7%) scans were classified as positive or negative by both the e-trained interpreters and the quantitative approaches, with the remaining 10 (12.3%) scans showing a discrepancy between the 2 approaches. Both methods (visual assessment by 5 e-trained interpreters and SUVR quantification) were significantly and strongly related (χ2 = 44.19, P < 0.0001, κ = 0.73; Table 4; Fig. 2A). Similarly, for in-person–trained interpreters, 72 (88.9%) assessments were concordant and 9 (11.1%) were discordant with quantitation, with a significant relationship between methods (χ2 = 47.33, P < 0.0001, κ = 0.76; Table 5; Fig. 2B).
Electronically Trained Visual Assessment in Comparison to Composite SUVR Quantification

Comparison of visual and quantitative image assessment. Visually assessed images were based on most results classified into V+ (visual-positive scan) and V− (visual-negative scan). Assessment data are plotted related to composite SUVR and subject age (y). Most interpretation data of electronically trained interpreters (A) and most interpretation data of in-person–trained interpreters (B). Electronically trained interpreters (A) and in-person–trained interpreters (B) are indicated separately.
In-Person Visual Assessment in Comparison to Composite SUVR Quantification
Further details of the 10 discordant cases are summarized in Table 6. Concordance with the pathology results was found with visual assessment in 9 cases by in-person–trained interpreters and in 8 cases by e-trained interpreters, but with the quantitative assessment only 2 cases matched the pathology results. Marked atrophy was found in 7 cases, all with visual assessment matching pathology results (6 positive and 1 negative case). However, for the 7 marked atrophy cases none of the quantitative assessment results matched with pathology, showing SUVRs less than 1.47 in the 6 positive cases and an SUVR of 1.52 in the negative case with marked atrophy. Interpreter agreement for 8 of 10 cases was very high both for the in-person– and for the electronically trained interpreter groups. Only for 1 subject (case 75 in Table 6; Supplemental Table 1) did the visual assessments differ for the 2 methods.
Comparison of Visual Versus Semiquantitative Analysis for Discordant Cases*
Challenging Cases
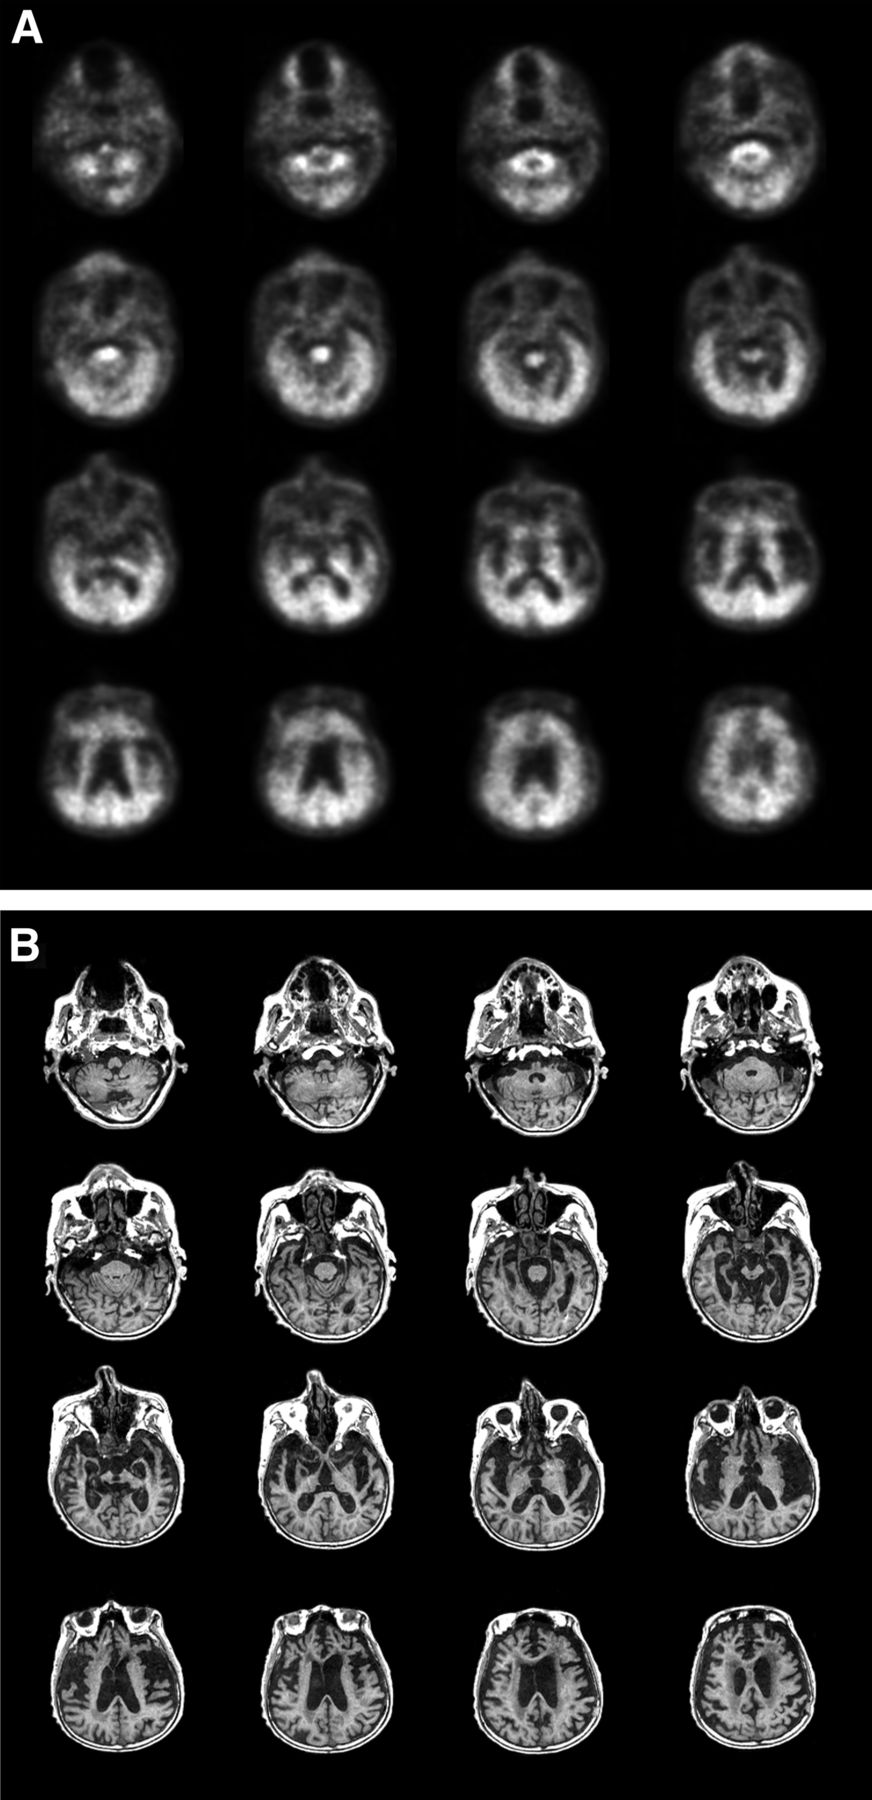
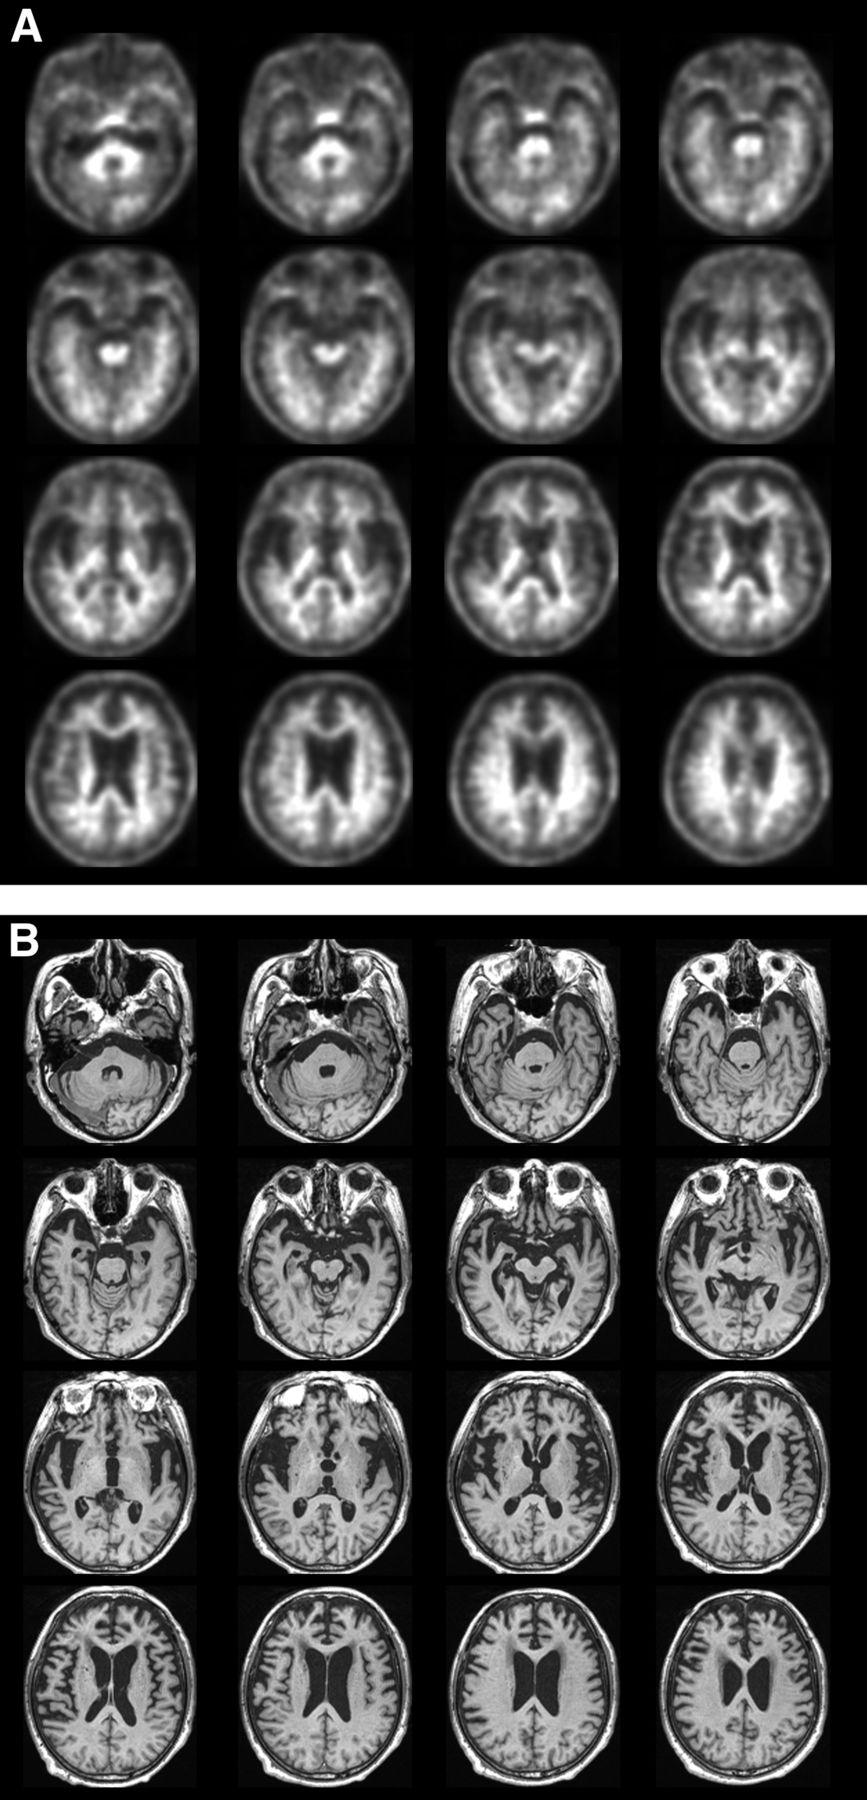
The patient cohort included challenging cases, such as subjects with marked brain atrophy or scans with head motion. Figure 3 shows sample florbetaben PET scans from a patient with marked brain atrophy, with potential for false-positive assessment. A small percentage of scans demonstrated motion as illustrated in Figure 4.

Florbetaben PET (A) and MRI (B) scans from patient 71 with marked brain atrophy, which was assessed by all interpreters as β-amyloid–positive. Patient was found to be β-amyloid–negative on postmortem histopathology and positive in quantitative assessment (SUVR, 1.53).

Florbetaben PET (A) and MRI (B) scans from patient 68 with motion artifact, potentially leading to false-positive visual assessment. All interpreters assessed scans as β-amyloid–negative. Patient was found to be β-amyloid–negative on postmortem histopathology and negative on quantitative assessment (SUVR, 1.10).
DISCUSSION
Results from this study demonstrate a high sensitivity and specificity of florbetaben PET imaging for evaluation of β-amyloid plaques in end-of-life individuals. Importantly, the sensitivity and specificity were independent of the interpreter training method, the previous expertise of interpreters in β-amyloid PET scan assessment, and the histopathology method used (BSS with or without immunohistochemistry). However, specificity increased for BSS + immunohistochemistry compared with BSS alone, as 4 brains in the BSS + immunohistochemistry group were additionally categorized as β-amyloid–positive. Indeed, BSS + immunohistochemistry is recommended in current neuropathologic guidelines for the assessment of AD pathology (10,11). Intrainterpreter and interinterpreter agreement was very high for both training groups.
The individual differences in sensitivity and specificity among the 5 inexperienced interpreters are particularly informative. There was a wide range of specificity in particular, with 2 interpreters showing relatively lower performance than the other 3. Poststudy interviews with each individual interpreter suggested that those with poorer performance were less rigid in the application of the training rules to their visual assessments. Specifically, when assessing whether a particular region is positive, the algorithm requires that most (i.e., at least 50%) of the axial slices comprising each region must be positive. In some instances, the poorer interpreters did not apply this rule systematically, leading to a region being classified as positive. Nonetheless, the sensitivity and specificity in the present study were consistent with earlier analyses from the same study (3) and also with previous reports with florbetaben PET (6,12) using clinical diagnosis as the SoT. Pathology examinations have shown, however, that clinical diagnosis of AD can be wrong (i.e., individuals diagnosed with AD dementia who do not show β-amyloid plaques on autopsy) in 10%–30% of cases (13). This can lead to false-negatives compromising the sensitivity estimation when using clinical diagnosis as SoT.
The relationship of visual interpretations to quantitative values was also consistent with prior reports (6,14), indicating high concordance between visual positivity and negativity and the composite SUVR using a quantitative cutoff for positive and negative scans. There were only a few cases (10 for e-trained and 9 for in-person–trained of 81 case evaluations) in which there was discordance between visual and quantitative assessments. The visual assessment method used did not allow comparison of the PET scan images with CT or MR. This may lead to difficulties in the interpretation of some cases with atrophy, and quantification could potentially help here. Most of the visual versus quantitative discordant cases showed marked atrophy. However, in this study the visual assessment of discordant cases matched with pathology results. Quantitative assessment of cases with marked atrophy were all discordant with pathology results. The interpreters were more adept at distinguishing gray matter from white matter uptake in scans with severe atrophic changes than the quantification method. Two exceptions to this are shown in Supplemental Figures 1 and 2. This suggests that atrophy may affect the quantification method used in this study more than the visual assessment. Further investigation is required to substantiate this and whether partial-volume error correction influences this result.
The end-of-life population used in this study is not the intended population for β-amyloid PET scanning. The clinically intended population will likely have fewer structural brain abnormalities than observed in this study cohort. Furthermore, the interpretation methodology designed for florbetaben in the present study was quite restrictive, with interpreters not permitted to use all the tools routinely available in nuclear medicine for PET assessment (3). In clinical practice, PET scans are interpreted using 3 spatial orientations, with structural images provided by CT or MRI to guide anatomic localization of findings, often in discontinuous color scales for fused images. Additional use of all available tools for image interpretation will likely increase the diagnostic performance. Nevertheless, excellent results were obtained, even allowing for the challenging nature of some scans and the stringent requirements of the applied interpretation methodology.
CONCLUSION
Overall, visual assessment of florbetaben images was robust, even in challenging scans from elderly end-of-life individuals. Sensitivity and specificity were high, as was interinterpreter agreement, independent of the interpreter expertise and training method used. The visual assessment strategy and respective training tools to analyze florbetaben PET scans are accurate and reliable in the detection of brain neuritic β-amyloid plaques as assessed using BSS, and cored plaques as assessed using immunohistochemistry, and showed a good correlation with quantitative assessments.
DISCLOSURE
The costs of publication of this article were defrayed in part by the payment of page charges. Therefore, and solely to indicate this fact, this article is hereby marked “advertisement” in accordance with 18 USC section 1734. The trial was funded by Bayer Pharma AG, Berlin (Germany), and Piramal Imaging S.A., Matran (Switzerland). Medical writing support was provided by Dan Booth (Bioscript Medical, London, U.K.) and funded by Piramal Imaging S.A. John Seibyl holds equity interest in Molecular Neuroimaging and is a consultant to Piramal Imaging and GE Healthcare. Ana M. Catafau, Santi Bullich, Andrew W. Stephens, Andre Mueller, and Norman Koglin are employees of Piramal Imaging GmbH, Berlin, Germany. Henryk Barthel received consultant and speaker honoraria as well as travel expenses from Bayer Healthcare/Piramal Imaging. Kenji Ishii has been a paid consultant to GE Healthcare. Christopher C. Rowe has received research grants from Bayer Schering Pharma. James B. Leverenz is a consultant with Bayer, Citibank, Piramal Imaging, and Navidea Biopharmaceuticals. Bernardino Ghetti is a consultant with Piramal Imaging and has a contract with Eli Lilly and Company. James W. Ironside is a consultant with Piramal Imaging, Covance, U.K., and has received honoraria from Springer and McCann Healthcare. Work by Hiroyasu Akatsu was partially supported by funding from Bayer. Masaki Takao received a research grant from Bayer Health Care. Walter J. Schulz-Schaeffer received research grants from Bayer HealthCare and Piramal Imaging. Marwan W. Sabbagh has contracts or grants with Bayer HealthCare, Piramal Imaging, Navidea Biopharmaceuticals, Avid, GE Healthcare, Avanir, Elan, Functional Neuromodulation, Eisai, Pfizer, and Genentech; is a consultant for Lilly, Avid, Piramal Imaging, Biogen, and Eisai; and receives royalties from Ten Speed and Wiley. Osama Sabri received consultant and speaker honoraria as well as travel expenses from Bayer Healthcare/Piramal Imaging. Anja Hoffmann is an employee of Bayer Pharma AG, Berlin, Germany. No other potential conflict of interest relevant to this article was reported.
Footnotes
Published online Jan. 28, 2016.
- © 2016 by the Society of Nuclear Medicine and Molecular Imaging, Inc.
REFERENCES
- Received for publication June 9, 2015.
- Accepted for publication January 4, 2016.


Jump to section
Related Articles
Cited By...
- Longitudinal Tau PET Using 18F-Flortaucipir: The Effect of Relative Cerebral Blood Flow on Quantitative and Semiquantitative Parameters
- Impact of Amyloid and Tau PET on Changes in Diagnosis and Patient Management
- Distinct and joint effects of low and high levels of A{beta} and tau deposition on cortical thickness
- Longitudinal tau PET using [18F]flortaucipir: Comparison of (semi)quantitative parameters
- Toward a Universal Readout for 18F-Labeled Amyloid Tracers: The CAPTAINs Study
- Derivation and utility of an A{beta}-PET pathology accumulation index to estimate A{beta} load
- A{beta}-PET pathology accumulation index: Ready for the clinic?
- The Spatial-Temporal Ordering of Amyloid Pathology and Opportunities for PET Imaging
- A Fully Automatic Technique for Precise Localization and Quantification of Amyloid-{beta} PET Scans
- Ageing stereotypes and prodromal Alzheimers disease (AGING): study protocol for an ongoing randomised clinical study
- Validation of Noninvasive Tracer Kinetic Analysis of 18F-Florbetaben PET Using a Dual-Time-Window Acquisition Protocol
- Clinical Use and Utility of Amyloid Imaging
- Optimal Reference Region to Measure Longitudinal Amyloid-{beta} Change with 18F-Florbetaben PET
- Cerebellar Amyloid-{beta} Plaques: How Frequent Are They, and Do They Influence 18F-Florbetaben SUV Ratios?