


Abstract
The purpose of this study was to evaluate 18F-FDG PET studies of primary and recurrent sarcomas for diagnosis and correlation with grading. Methods: The evaluation included 56 patients, 43 with histologically proven malignancies and 13 with benign lesions. Seventeen patients were referred with suspicion on a primary tumor, and the remaining 39 were referred with suspicion on a recurrent tumor. The FDG studies were accomplished as a dynamic series for 60 min. The evaluation of the FDG kinetics was performed using the following parameters: standardized uptake value (SUV), global influx, computation of the transport constants K1–k4 with consideration of the distribution volume (VB) according to a two-tissue-compartment model, and fractal dimension based on the box-counting procedure (parameter for the inhomogeneity of the tumors). Results: Visual evaluation revealed a sensitivity of 76.2%, a specificity of 42.9%, and an accuracy of 67.9%. The vascular fraction VB and the SUV were higher in malignant tumors compared with benign lesions (t test, P < 0.05). Although the FDG SUV helped to distinguish benign and malignant tumors, there was some overlap, which limited the diagnostic accuracy. The SUV and fractal dimension accounted for significant differences in six of the nine diagnostic pairs. Whereas grade (G) II and G III tumors were differentiated from lipomas on the basis of the fractal dimension and some other kinetic parameters, no differences were found between G I tumors and lipomas. On the basis of the discriminant analysis, the differentiation of soft-tissue tumors was best for the use of six parameters of the FDG kinetics (SUV, VB, K1, k3, influx, and fractal dimension). Eighty-four percent of G III tumors, 37.5% of G II tumors, 80% of G I tumors, 50% of lipomas, and 14.3% of scars could be classified correctly, whereas inflammatory lesions were misclassified. Conclusion: FDG PET should be used preferentially for monitoring patients with G III sarcomas. Visual analysis provides a low specificity. In contrast, the evaluation of the full FDG kinetics provides superior information, particularly for the discrimination of G I and G III tumors (positive predictive value, >80%).
Soft-tissue sarcomas are a heterogeneous group of tumors that arise from tissue of mesenchymal origin and are characterized by infiltrative local growth and hematogenous metastases. They account for approximately 1% of all malignant tumors. About 60% of the tumors occur in the extremities. Morphologic imaging modalities are used for the assessment of tumor location, form, size, infiltration of the surrounding tissue, and presence of satellite metastases, which may affect the therapeutic decision. PET with 18F-FDG has found increasing use in oncology because it allows functional imaging of viable tumor tissue (1). Recently, several authors reported using FDG PET for the detection and therapy monitoring of patients with soft-tissue sarcomas (2–8). According to these studies, FDG PET can visualize soft-tissue sarcomas, indicate the grade of malignancy, and detect local recurrence.
Several authors have examined the role of FDG PET in patients with soft-tissue sarcomas using a different methodology for the evaluation of the PET studies. Most authors used only a visual and a semiquantitative method—for example, standardized uptake value (SUV) or tumor-to-muscle ratio—to evaluate the data. A minority of authors examined the role of quantitative dynamic FDG studies with arterial blood sampling and calculation of metabolic rates. The data reported in the literature indicate a high sensitivity (>90%) but a lower specificity ranging from 65% to 88% (5–8). In 1988 Kern et al. (2) reported a good correlation between the metabolic rate of FDG and the histopathologic grading in four patients with soft-tissue tumors and one patient with an osteogenic tumor. Adler et al. (3) examined three low-grade and two high-grade liposarcomas and found a significant difference in the FDG uptake between the two groups. Eary et al. (4) reported a strong correlation between the pretreatment quantitative determination of the metabolic rate of FDG and the tumor grade in 45 patients with soft-tissue sarcomas and 25 patients with bone tumors. However, it is still uncertain which parameters are most important for tumor differentiation and the detection of recurrent tumors. Furthermore, the role of FDG for pretreatment grading is unclear.
The purpose of this study was to determine whether dynamic quantitative FDG PET studies with noninvasive measurement of the input function and dedicated data evaluation using the classical two-tissue-compartment model analysis and a noncompartment approach can improve the differential diagnosis of primary and recurrent soft-tissue sarcomas. In particular, we tried to identify those biologic parameters—for example, histology or grading (or both)—that limit the diagnostic accuracy of PET for the detection of primary and recurrent sarcomas. Finally, we compared the semiquantitative analysis based on a static measurement with the analysis of the full kinetic FDG data.
MATERIALS AND METHODS
Patients
The evaluation included 56 patients with soft-tissue lesions suggestive of malignancy. All patients were referred with the preliminary diagnosis of a primary or recurrent soft-tissue malignancy on the basis of clinical symptoms and radiologic examinations, either CT or MRI. The final diagnosis was based on the histologic data obtained from surgical specimens. Most masses were located in the extremities (n = 36), but masses were also found in the abdomen (n = 17) and the thoracic region (n = 3). The final histologic examination revealed 43 malignant soft-tissue tumors and 13 benign lesions. Among the tumor masses (25 grade [G] III, 8 G II, 10 G I), there were 31 liposarcomas, 3 hemangiosarcomas, 3 leiomyosarcomas, and 6 malignant fibrous histiocytomas. Benign lesions comprised seven scars, four lipomas, and two inflammatory lesions.
None of the 56 patients (39 recurrences, 17 primary tumors) had received chemotherapy. Among the 17 patients with primary soft-tissue lesions, there were six G I (five liposarcomas, one schwannoma), one G II liposarcoma, and 10 G III tumors (seven liposarcomas, two malignant fibrous histiocytomas, one leiomyosarcoma). All patients with suspected local recurrence (39/56) had a documented history of surgery for a sarcoma. Sixteen of these 39 patients had received radiotherapy as an adjunctive treatment (median dose, 58 Gy). The time interval between radiation therapy and PET was ≥3 mo. Informed consent was obtained from each patient. The study was performed in accordance with the institutional review board requirements.
Data Acquisition
Dynamic PET studies were performed after intravenous injection of 300–370 MBq FDG for 60 min. For the first eight patients we used 15 frames (5 frames of 2 min followed by 10 frames of 5 min) for the dynamic FDG studies. The other 48 patients were examined with a 23-frame protocol (10 frames of 1 min, 5 frames of 2 min, and 8 frames of 5 min). FDG was prepared according to the method described by Toorongian et al. (9).
A dedicated PET system (ECAT EXACT HR+; Siemens, Erlangen, Germany) based on the block detector technology with a craniocaudal field of view of 15.3 cm, operated with septa extended (two-dimensional mode), was used for patient studies. The system allows the simultaneous acquisition of 63 transverse slices with a theoretic slice thickness of 2.4 mm. The system consists of four rings and each of the rings has 72 bismuth germanate detector blocks. A single block detector is divided into an 8 × 8 matrix. The crystal size of a single detector element is 4.39 × 4.05 × 30 mm. The evaluation of spatial linearity revealed that the maximum displacement from the ideal source position was <0.4 mm in the whole field of view. Transmission scans for a total of 10 min were obtained with three rotating germanium pin sources before the first radionuclide application for the attenuation correction of the acquired emission tomographic images.
The PET data were transferred by file transfer protocol to a subnet server system. A Web interface was used to start and distribute the reconstruction tasks on different computer systems, where the reconstruction programs were running (10). All PET images were scatter and attenuation corrected (11). An image matrix of 256 × 256 pixels was used. The images were reconstructed using an iterative reconstruction algorithm (weighted least-square method, ordered subsets, four subsets, six iterations) running on Pentium platforms (Pentium II 450-MHz, double processor; 512-MB random access memory [RAM]) and Windows NT (version 4.0; Microsoft, Redmond, WA).
Data Analysis
The evaluation of the dynamic PET data was performed using the software package PMod (provided in cooperation with the University of Zürich, Switzerland) (12,13). Visual analysis was performed by evaluating the hypermetabolic areas on transaxial, coronal, and sagittal images. Time–activity curves were created using volumes of interest (VOIs). A VOI consists of several regions of interest (ROIs) over the target area. Irregular ROIs were drawn manually. To compensate for possible patient motion during the acquisition time, the original ROIs were repositioned visually but were not redrawn. In general, a detailed quantitative evaluation of tracer kinetics requires the use of compartment modeling. Patlak analysis as well as a two-tissue-compartment model are standard methodologies for the quantification of dynamic FDG studies (14,15). We used for the basic analysis the semiquantitative approach based on the calculation of a distribution value, for which the term “SUV” was introduced by Strauss and Conti (1): SUV = tissue concentration (MBq/g)/(injected dose [MBq]/body weight [g]). The 55- to 60-min uptake values served for the quantification of the FDG SUV data.
One problem in patient studies is the accurate measurement of the input function, which theoretically requires arterial blood sampling. However, the input function can be retrieved from the image data with good accuracy (16). We performed compartment analysis to gain more information about the tracer distribution. For the input function, the mean value of the VOI data obtained from a large arterial vessel was used. A vessel VOI consisted of at least seven ROIs in sequential PET images. In patients with an abdominal or a thoracic mass, the descending aorta was used for this purpose because the spillover from other organs is low and the descending aorta extends from the upper chest to the lower abdomen. The recovery coefficient is 0.85 for a diameter of 8 mm and for the system described above. Partial-volume correction was used for small vessels with a diameter <8 mm but not for the aorta. We did not use VOIs of the heart for the input function to avoid spillover from the myocardium. Noise in the input curve has an effect on the parameter estimates. Therefore, we used a preprocessing tool, available in PMod software, which allows a fit of the input curve—namely, by a sum of up to three decaying exponentials to reduce noise. The transport constant K1 as well as the rate constants k2, k3, and k4 were calculated using a two-tissue-compartment model implemented in the PMod software taking into account the vascular fraction (VB) in a VOI. Details about the applied compartment models are described by Burger and Buck (13). The FDG influx (Ki) was calculated using the transport rates from the two-tissue-compartment model according to the following formula: Ki = ([K1 × k3]/[k2 + k3]). The metabolic rate of glucose according to Patlak was not calculated because of the high variation of λ. PMod provides a graphic interface that allows the interactive configuration of the kinetic model by the user as well as performing some preprocessing steps—for example, setting up initial values for the fit parameters. Visual evaluation of each plot was performed to check the quality of each fit. Each model curve was compared with the corresponding time–activity curve and the total X2 difference was the cost function, where the criterion was to minimize the summed squares (X2) of the differences between the measured and the model curve (13).
Besides the compartment analysis, we used a noncompartment model based on the fractal dimension (17). As shown by other investigators, the fractal dimension is a parameter for the heterogeneity. It was recently shown that the fractal dimension is an appropriate procedure to describe the heterogeneity of blood flow in animal models (18). We implemented a Java-based module in the PMod software to calculate the fractal dimension for the time–activity data (19). Fractal dimension was calculated for the time–activity data in each individual voxel of a VOI. The program is based on the box-counting method (17). The values of the fractal dimension vary from 0 to 2 and are a parameter for a deterministic or more chaotic distribution of the tracer activity. No input function is needed for this purpose.
The statistical evaluation of the data was performed using the Statistica software package (version 6.0; StatSoft, Hamburg, Germany) on a personal computer (Pentium III 600-MHz, double processor; 512-MB RAM) running with Windows NT (version 4.0; Microsoft). Descriptive statistics and box–whiskers plots were used for the analysis of the data. A modification of the Student t test for nonequal variances was applied to all evaluated parameters (SUV, K1, k2, k3, k4, VB, fractal dimension) to find out which parameter is most significant for the differentiation between the six different diagnostic groups (G I to G III tumors, lipomas, scars, inflammatory lesions). Differences were considered significant for P < 0.05. Discriminant analysis was used to determine the predictive value of a pretreatment FDG study using all evaluated parameters (VB, K1, k2, k3, k4, fractal dimension) with regard to the final histologic diagnosis.
RESULTS
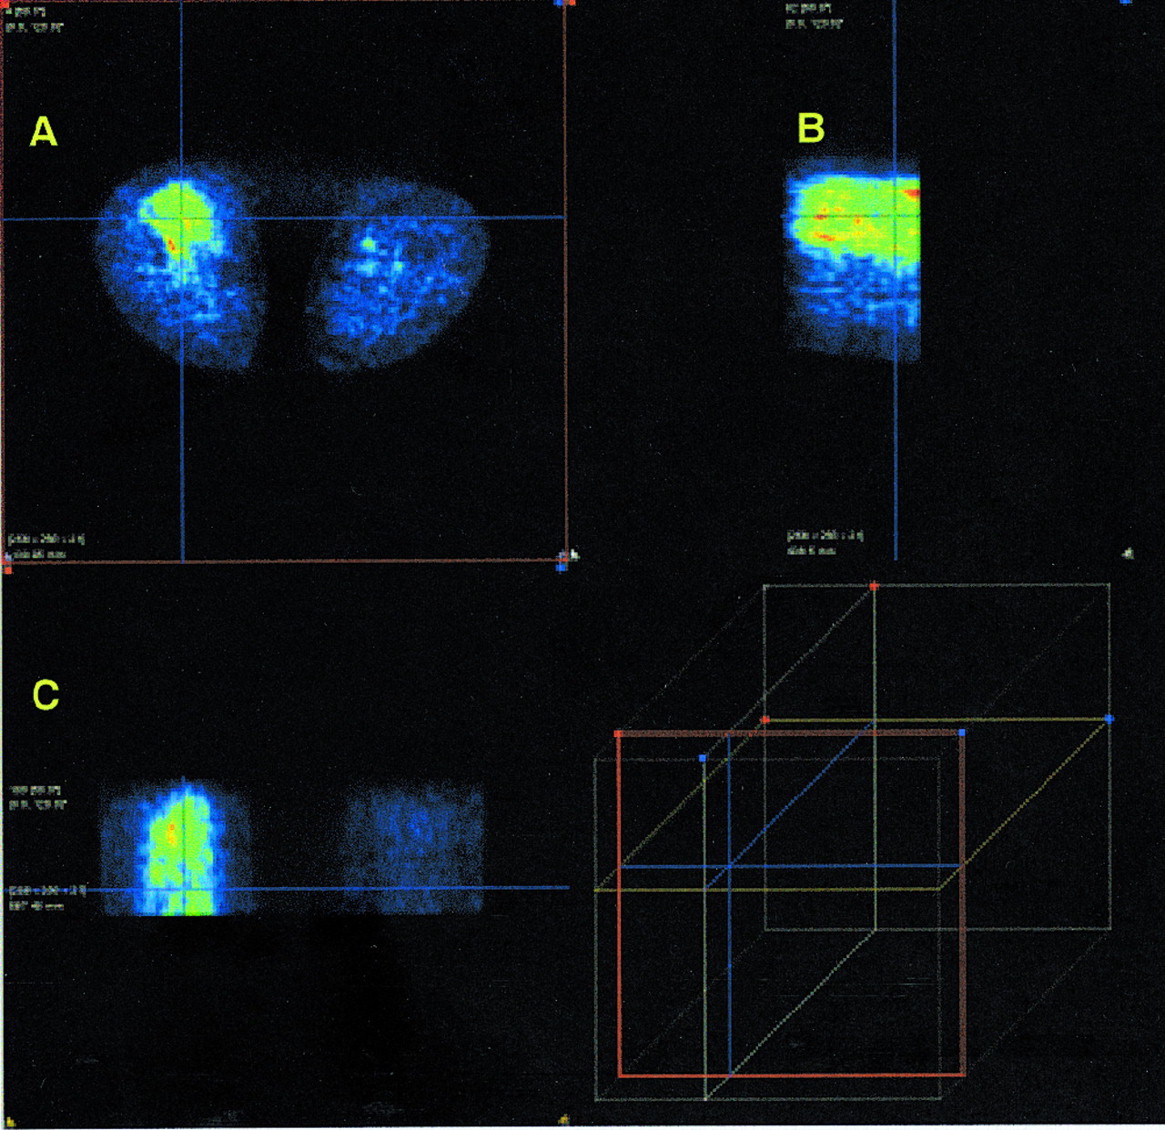
Visual evaluation revealed a sensitivity of 76.2%, a specificity of 42.9%, and an accuracy of 67.9%. In particular, visual evaluation resulted in 8 false-positive and 10 false-negative results. Among the 8 false-positive results there were the two inflammatory lesions, five scars that have been irradiated, and one fibrolipoma. The 10 false-negative results were obtained in six G I tumors, one G II malignant fibrous histiocytoma, two G II liposarcoma recurrences, and even one G III liposarcoma recurrence. Low-grade and low-to-intermediate-grade tumors could not be differentiated accurately from benign lesions, especially scar tissue and lipomas. Inflammatory lesions exhibited, as expected, a high FDG uptake and could therefore not be differentiated from a G III tumor. Lipomas (Fig. 1) had a low uptake, whereas G III tumors (Fig. 2) showed a high FDG accumulation.

Transverse (A), sagittal (B), and coronal (C) images of patient with histologically confirmed lipoma in proximal upper leg 1 h after FDG injection. Low FDG uptake is evident in suspicious lesion. Cross cursor is positioned over suspicious lesion according to clinical examination. PET images are visualized with PMod software package. Cube shows relative position of cursor to field of view.

Transverse (A), sagittal (B), and coronal (C) images of patient with histologically confirmed G III liposarcoma in proximal, medial part of upper leg. Enhanced FDG uptake is evident in tumor. Cross cursor is positioned over tumor. PET images are visualized with PMod software package. Cube shows relative position of cursor to field of view.
The mean FDG uptake 60 min after injection was 2.4 SUV (0.3–8.8 SUV) for the soft-tissue tumors compared with 1.1 SUV (0.3–4.0 SUV) in benign lesions (Tables 1 and 2). The descriptive statistics of all evaluated parameters, including the SUVs, transport constant K1 and rate constants (k2–k4), as well as the vascular fraction (VB) and the fractal dimension of the FDG kinetics in malignant and benign lesions, are presented in Tables 1 and 2. The data show increased mean values for all parameters in tumors except k4 (Tables 1 and 2). The t test revealed a significant difference for SUV and VB when malignant and benign lesions are compared (P < 0.05).
Descriptive Statistics for All Tumors
Descriptive Statistics for Benign Lesions
The SUVs for different diagnostic groups are illustrated in Figure 3. A comparison of the median 55- to 60-min FDG SUV for G III (n = 25), G II (n = 8), and G I (n = 10) tumors revealed an increase in the SUV with higher tumor grade (Fig. 3). The median SUV was 0.7 (range, 0.3–2.2) for G I tumors, 1.32 (range, 0.4–5.2) for G II tumors, and 2.53 (range, 0.4–8.8) for G III tumors. Although the median value seems to increase with tumor grade, the overlap between the extreme values of all three tumor categories is large. Furthermore, there is an overlap between the median value of benign lesions, such as lipomas and scar tissue, and low-to-intermediate-grade soft-tissue tumors, as well as between inflammatory lesions and high-grade soft-tissue tumors (Fig. 3). Comparable data were observed for the other kinetic parameters, such as K1 and k3.
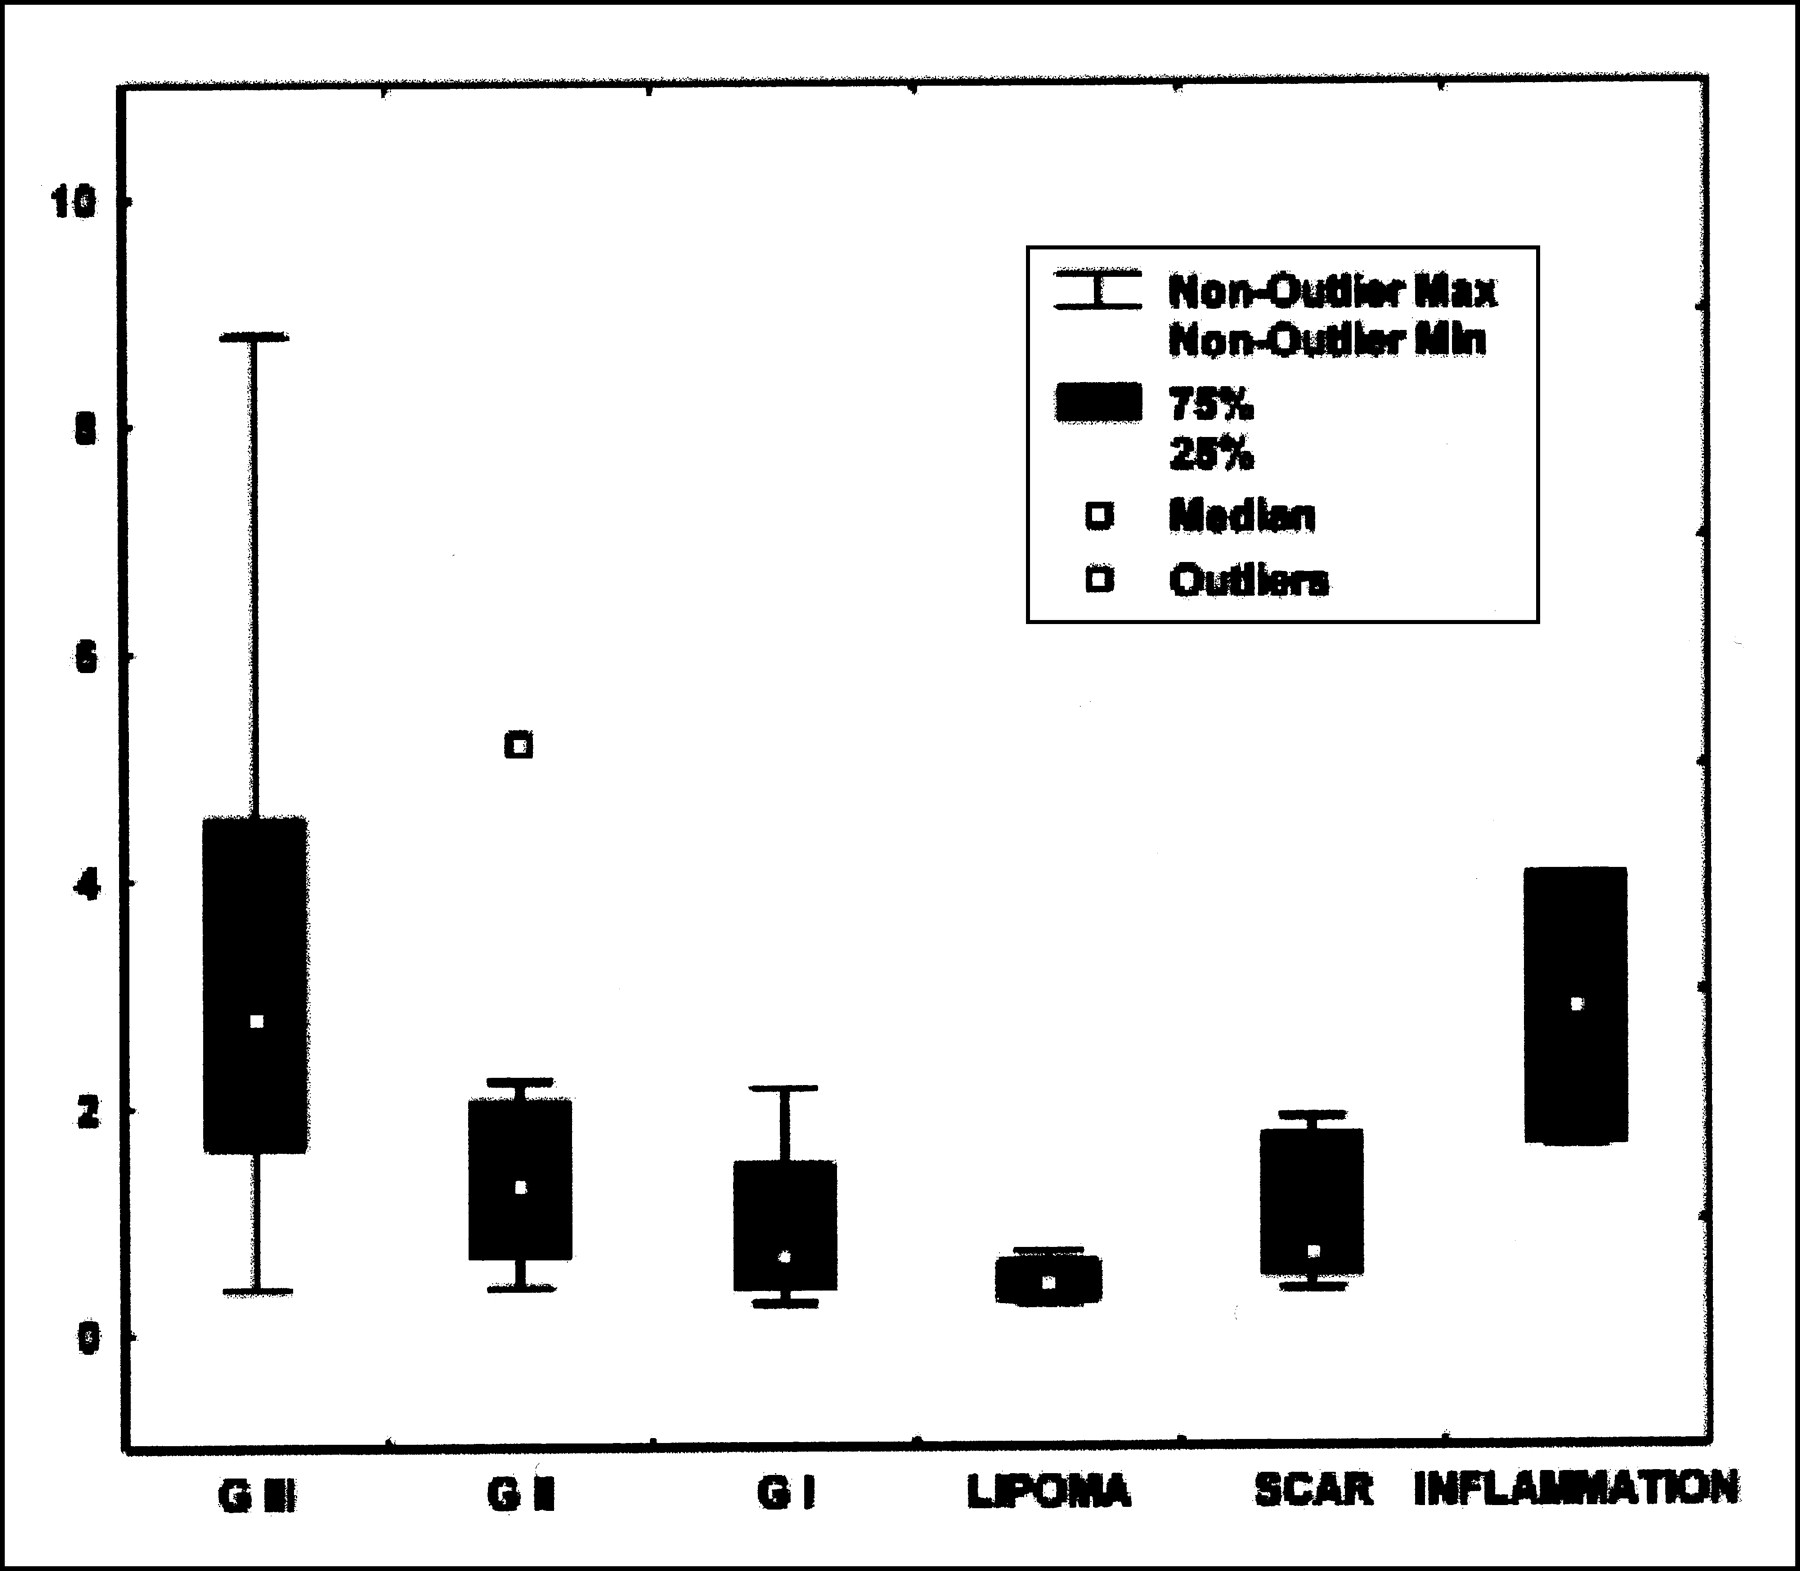
Box–whiskers plots of mean FDG uptake (SUV) at 55–60 min after injection for G III (n = 25), G II (n = 8), and G I (n = 10) tumors as well as for lipomas (n = 4), scar tissue (n = 7), and inflammatory lesions (n = 2).
The six diagnostic groups (G I, G II, and G III tumors, scar, lipoma, inflammation) were used to build a matrix of 15 possible diagnostic pairs (Table 3). The Student t test for nonequal variances was applied to determine those parameters, which show a significant difference (P < 0.05) in the mean values (Table 3). Significant differences were noted in 9 of 15 possible diagnostic pairs. The SUV and fractal dimension were the most helpful and accounted for significant differences in six of the nine diagnostic pairs. The other kinetic parameters were less informative. Although G II and G III tumors could be distinguished from lipoma by the fractal dimension and other parameters, no differences were found for G I tumor and lipoma (Table 3).
Significant Mean Values of Individual Kinetic Parameters for Differentiation Between Diagnostic Groups
In clinical routine, differential diagnosis requires consideration of more than one alternative. Therefore, we used discriminant analysis to predict the six different categories: G I to G III tumors, lipomas, scars, and inflammatory lesions (Tables 4 and 5). The FDG kinetic parameters (SUV, K1, k2, k3, k4, VB, influx, fractal dimension) served as input variables. The use of only the 55- to 60-min FDG SUV as an input variable for the discriminant analysis provided only two predicted categories: G I and G III. Ninety-two percent (23/25) of G III tumors and 50% (5/10) of G I tumors were classified correctly (Table 4). It was not possible to correctly identify the benign lesions. The use of six kinetic parameters of FDG kinetics (SUV, K1, k3, VB, influx, fractal dimension) allowed better discrimination (Table 5). On the basis of the six parameters, it was possible to classify the data into five categories: G I, G II, and G III tumors, lipomas, and scars. Inflammatory lesions were misclassified as G III tumors. Eighty-four percent (21/25) of G III tumors, 37.5% (3/8) of G II tumors, and 80% (8/10) of G I tumors as well as 50% (2/4) of lipomas, 14.3% (1/7) of scars, and 0% (0/2) of inflammatory lesions were classified correctly using this approach (Table 5).
Discriminant Analysis of 56 Lesions Using Only FDG SUV as Input Variable
Discriminant Analysis of 56 Lesions Using Six Parameters (SUV, K1, k3, VB, Influx, Fractal Dimension) as Input Variables
The comparison between primary and recurrent tumors revealed no statistically significant difference when the described methods were applied.
DISCUSSION
PET with FDG is recommended for the primary diagnosis and staging as well as for the detection of recurrences in patients with malignant soft-tissue sarcomas. The evaluation of the reported results varies from visual evaluation to semiquantitative evaluation using SUV or even calculation of metabolic rates (4). The sensitivity reported in the literature using a dedicated PET scanner exceeds 91%, whereas the specificity is lower, ranging from 65% to 88% (5–8). However, malignant lesions may be missed (false-negative) or some benign lesions may be classified as malignant because of an enhanced FDG uptake (false-positive). The main reason for false-negative results in patients with suspected soft-tissue lesions is low-grade tumors, which have a low FDG uptake (8). In our study visual evaluation revealed 10 false-negative results, most of them (6/10) in patients with G I tumor, but also in three patients with G II tumor and even in one patient with G III tumor recurrence. False-positive results may be caused by inflammatory lesions (2,20). Visual evaluation revealed eight false-positive results in our study, including not only the two inflammatory lesions but also five previous irradiated patients with scar tissue and even one patient with a fibrolipoma.
The goal of this investigation was to examine the value of a dynamic, quantitative FDG study using several pharmacokinetic parameters for improvement of the diagnostics and grading. A two-tissue-compartment model is a generally accepted method for an accurate, detailed kinetic analysis of the FDG metabolism. To limit the burden for the patient, we chose the retrieval of the input function from the image data. Ohtake et al. (16) showed that the image-based data obtained from a vessel VOI consisting of at least seven consequent ROIs correlate well with those obtained by arterial and venous blood sampling. We used VOIs instead of ROIs to maximize the information retrieved from the images. The high resolution, the small pixel size used for reconstruction, and the use of VOIs limit the partial-volume effects in our study, and we did not attempt partial-volume correction for vessels with a diameter >8 mm.
Schwarzbach et al. (8) reported that the SUV was helpful in the diagnosis of primary and recurrent high-grade tumors. The limitation of the SUV is the differentiation of low-grade sarcomas or at least a subset of low-grade soft-tissue tumors because sarcomas are a histologically heterogeneous group. Depending on the histology, FDG uptake and phosphorylation may be different for the various histologic subtypes. The use of several kinetic parameters obtained from the dynamic FDG data provides more information about FDG pharmacokinetics than the SUV of a single acquisition. The transport constant K1 is primarily a parameter for the transport capacity of FDG, and the rate constant k3 is associated with the phosphorylation rate of the radiopharmaceutical. The blood volume in a tumor tissue is a parameter that modulates the uptake of the tracer. Therefore, the use of the vascular fraction (VB) of a target volume is another parameter that may improve diagnostic accuracy. Besides compartment analysis, the fractal dimension may help to quantify heterogeneity. All of these evaluated parameters may be influenced by the size and the shape of a tumor as well as the system resolution. Pixels located at the center of the tumor may have higher values, whereas the values may decrease for pixels located toward the edge of the lesion. However, this effect is generally modulated by the inhomogeneous distribution of FDG within the malignancy because of differences in blood supply, viability, and so forth.
We used the t test for the basic analysis of the data and to find the most statistically significant kinetic parameters for the differentiation between possible diagnostic pairs (Table 3). Interestingly, the SUV and the fractal dimension seem to be helpful for the G II and the G III classification versus lipoma and scar (Table 3). Some investigators have used the fractal dimension as a parameter for the assessment of spatial heterogeneity. Kleen et al. (18) used the fractal dimension as a scale-independent factor to measure spatial heterogeneity of blood flow. We used the fractal dimension to characterize the kinetics of FDG in all lesions. The fractal dimension may be important for the differentiation of lipomas and scar tissue from other diagnostic groups. According to the data, the FDG turnover in lipomas is more deterministic than in tumors and in scars.
The analysis of the pharmacokinetic data revealed some interesting aspects about the grading of the tumors. Although some authors emphasized a correlation between the mean FDG uptake, expressed in SUV, and the tumor grade, the original data of all of these studies and our results (Fig. 3) provide evidence for a large overlap between the different grading groups (3,4,8). Therefore, comparison of the mean SUV may not be helpful in the individual patient. To our knowledge, there is no report about transport rates in soft-tissue sarcomas to compare with the data of this study. Lodge et al. (21) reported quantitative FDG studies in 29 patients, 17 with benign soft-tissue masses and 12 with soft-tissue sarcomas. Malignant sarcomas included 10 high-grade and two low-grade tumors. The authors used a modified SUV, corrected for blood glucose concentration and the lean body mass for evaluation as well as Patlak analysis for estimation of the metabolic rate, based on the graphic analysis as well as calculated by the transport rate constants obtained by a two-tissue compartment, which was comparable with our study. Although the transport rate constants were not discussed separately in detail, the authors stated that k4 was low, but not negligible. The FDG metabolic rate according to the graphic Patlak method was comparable with the one calculated of the transport rates of the two-tissue compartment. The authors stated that the metabolic rate of FDG could distinguish high-grade sarcomas from benign lesions but not low-grade tumors. A limitation of this study is the very low number of G I tumors (n = 2), the lack of G II tumors, and the lack of abscesses. Therefore, it is not possible to compare the results of this study with our study with respect to differential diagnosis and grading.
To analyze the predictive value of FDG SUV for grading and for the differential diagnosis (benign vs. malignant), we applied discriminant analysis to the data and compared the predicted class with the histologically observed class in each patient. The results revealed an accuracy of 92% for the prediction of G III tumors but a low prediction for all other groups when only the SUV was used (Table 4). Interestingly, the positive predictive value of discriminant analysis was improved when six kinetic parameters were used as input variables. In particular, discriminant analysis was the only method that correctly identified 8 of 10 G I tumors, 3 of 8 G II tumors, and 2 of 4 lipomas.
Soft-tissue sarcomas are a very heterogeneous group of tumors that may cause classification problems not only in FDG studies but also in the histologic evaluation of the tumor specimen, which is in some cases inconclusive. A discrepancy in the histologic diagnosis is not a rare phenomenon because of the different transient forms of the different histologic subtypes. The differentiation of inflammatory lesions from tumor tissue, especially from G III tumors, may be a problem. The number of inflammatory lesions (n = 2) included in our study is very low. The low number of inflammatory lesions (2/56 lesions) indicates that the differentiation between a G III tumor and an inflammatory lesion is not a major problem from the clinical point of view. An inflammatory lesion has a low prevalence and can often be diagnosed using clinical criteria and laboratory values. Another problem is the differentiation of scar tissue and tumor recurrence, which is a biologic problem and concerns primarily irradiated patients because of nonspecific effects that can cause a long-term FDG enhancement. Visual analysis revealed false-positive results in five patients with scar tissue who have been irradiated. But even discriminant analysis with the use of six kinetic parameters correctly classified only one of seven irradiated scars. Although radiation therapy had been performed at least 3 mo before FDG PET, nonspecific repair processes led to an enhanced FDG uptake, which caused problems in the differential diagnosis. Interestingly, visual analysis revealed false-negative results in four patients with G II to G III recurrences. One of these patients had a G II malignant fibrous histiocytoma, two of them had G II liposarcomas, and one of them had a recurrence of G III liposarcoma. In contrast, discriminant analysis correctly classified the three recurrences of liposarcoma but misclassified the G II malignant fibrous histiocytoma.
FDG is the tracer of choice for oncologic studies because glycolysis is enhanced in malignant tissue and can be easily detected. To enhance the specificity of tumor diagnosis with PET, other parameters, such as the proliferation rate of tumor cells, were assessed using dedicated tracers, such as 11C-thymidine, 18F-deoxyuridine, or, more recently, 18F-fluorodeoxythymidine (22–24). 11C-α-aminoisobutyric acid (11C-AIB) and 11C-aminocyclopentanecarboxyl acid are synthetic amino acids, which primarily show alanine-like (A type) and leucine-like (L type) amino acid transport. The advantage of these amino acids is a clear signal showing only the transport capacity of the tumor and no further metabolic steps. In a limited number of patients with high-grade tumors, 11C-AIB (9 patients) and 15O-water (10 patients) were used in addition to FDG to visualize soft-tissue tumors (25). An enhanced uptake of all tracers was noted in the malignant soft-tissue tumors, whereas the FDG uptake (expressed in SUV) was higher than the uptake of 11C-AIB and 15O-water compared with the surrounding normal tissue (muscle). Interestingly, one abscess with a high uptake of FDG and enhanced tissue perfusion did not accumulate 11C-AIB (25). However, the advantage of multitracer measurements is still under evaluation, and it is uncertain whether multitracer parameter analysis may further improve diagnostic accuracy.
CONCLUSION
The value of FDG PET is limited for the diagnosis of soft-tissue sarcomas in comparison with other malignancies. Visual analysis is confined to the differentiation of malignant and benign lesions and provides a low specificity (42.9%). In contrast, the evaluation of the full FDG kinetics provides superior information, particularly for the discrimination of G I and G III tumors (positive predictive value, >80%).
Acknowledgments
The authors thank Gisela Irngartinger, MD, Division of Oncological Diagnosis and Therapy, German Cancer Research Center, Heidelberg, Germany, for her support.
Footnotes
Received Jul. 28, 2000; revision accepted Jan. 10, 2001.
For correspondence or reprints contact: Antonia Dimitrakopoulou-Strauss, MD, Medical PET Group–Biological Imaging (E0105), German Cancer Research Center, Im Neuenheimer Feld 280, D-69120 Heidelberg, Germany.
REFERENCES
In this issue


Jump to section
Related Articles
Cited By...
- Early Metabolic Response as a Predictor of Treatment Outcome in Patients With Metastatic Soft Tissue Sarcomas
- Reply: Comment on: "Tumor Aggressiveness and Patient Outcome in Cancer of the Pancreas Assessed by Dynamic 18F-FDG PET/CT"
- Tumor Aggressiveness and Patient Outcome in Cancer of the Pancreas Assessed by Dynamic 18F-FDG PET/CT
- Shortened Acquisition Protocols for the Quantitative Assessment of the 2-Tissue-Compartment Model Using Dynamic PET/CT 18F-FDG Studies
- 11C-Methionine vs. 18F-FDG PET in Soft Tissue Sarcoma Patients Treated with Neoadjuvant Therapy: Preliminary Results
- Impact of Angiogenesis-Related Gene Expression on the Tracer Kinetics of 18F-FDG in Colorectal Tumors
- 18F-FDG Kinetics in Locally Advanced Breast Cancer: Correlation with Tumor Blood Flow and Changes in Response to Neoadjuvant Chemotherapy
- 18F-FDG Kinetics and Gene Expression in Giant Cell Tumors
- 18F-FDG PET in Evaluating Patients Treated for Metastatic Colorectal Cancer: Can We Predict Prognosis?
- Detection and Grading of Soft Tissue Sarcomas of the Extremities with 18F-3'-Fluoro-3'-Deoxy-L-Thymidine
- Shortened PET Data Acquisition Protocol for the Quantification of 18F-FDG Kinetics
- Soft Tissue Sarcomas of Adults: State of the Translational Science
- Soft-Tissue Lumps and Bumps
- 18F-FDG PET for the Diagnosis and Grading of Soft-Tissue Sarcoma: A Meta-Analysis