


Abstract
PET using 18F-FDG is increasingly used for the diagnosis and grading of tumors. Several studies have been performed that evaluate the diagnostic and grading performance of 18F-FDG PET for soft-tissue sarcoma, but each study has had a limited sample size. Therefore, we undertook a comprehensive meta-analysis of the evidence. Methods: Relevant studies were identified from MEDLINE and EMBASE. Diagnostic and grading performance were evaluated for qualitative visualization; standard uptake value (SUV, cutoffs of 2.0 and 3.0); and metabolic rate of glucose (MRG, cutoff of 6.0 μmol/100 g/min). Quantitative data synthesis included independent weighting of sensitivity and specificity, construction of summary receiver operating characteristic curves, and pooled analyses. Results: The meta-analysis included 15 studies with 441 soft-tissue lesions (227 malignant, 214 benign). For diagnosis of malignant versus benign lesions, typical pairs of sensitivity and specificity estimates from the summary receiver operating characteristic curves were 92% and 73% for qualitative visualization; 87% and 79% for SUV 2.0; 70% and 87% for SUV 3.0; and 74% and 73% for MRG 6.0. Diagnostic performance was similar for primary and recurrent lesions. By qualitative interpretation, 18F-FDG was positive in all intermediate/high-grade tumors (95% confidence interval [CI], 97.3%–100%), 74.4% (95% CI, 58.6%–85.9%) of low-grade tumors, and 39.3% (95% CI, 29.1%–50.3%) of benign lesions (including 11 of 12 inflammatory lesions). Using an SUV cutoff of 2.0, respective rates were 89.4% (95% CI, 79.4%–95.6%), 33.1% (95% CI, 15.6%–55.3%), and 19.1% (95% CI, 10.6%–30.5%). Limited data on comparisons with MRI and CT showed no differences against 18F-FDG PET in diagnosing recurrent and metastatic disease. Conclusion: 18F-FDG PET has very good discriminating ability in the evaluation of both primary and recurrent soft-tissue lesions. 18F-FDG PET may be helpful in tumor grading but offers inadequate discrimination between low-grade tumors and benign lesions.
PET using 18F-FDG is increasingly being established as a key imaging technique in the diagnosis, grading, staging, and assessment of response to therapy of diverse types of tumors (1,2). 18F-FDG PET is considered as a potentially major advance in clinical practice, because it may offer information about not only the anatomic extent but also the behavior of tumors, thus helping to guide therapeutic choices. Soft-tissue sarcoma (STS) is a malignancy for which evidence on the diagnostic performance of 18F-FDG PET has been accumulating rapidly in recent years. While STS is not a common tumor, accounting for only 1% of cancer diagnoses in the United States (3), it carries a high mortality rate, and tumor grade is a strong predictor of outcome (4). Accurate imaging studies that can provide additional information on grading and staging may be useful in the management of the disease. 18F-FDG PET has been evaluated in several series of patients with suspected or proven STS with the aim to assess whether this imaging modality may be useful in differentiating malignant from benign soft-tissue lesions and in providing adequate information to grade STS. However, most of the studies have been small and used diverse qualitative or quantitative diagnostic parameters. Therefore, we undertook a meta-analysis to combine results across studies and to obtain a more reliable estimate of the diagnostic performance of 18F-FDG PET in the assessment of soft-tissue lesions.
MATERIALS AND METHODS
Scope and Eligibility Criteria
We addressed the performance of 18F-FDG PET as a diagnostic test for differentiating STS from benign soft-tissue lesions and for grading STS. We considered all studies with 18F-FDG PET evaluations on at least 3 subjects with soft-tissue lesions, at least 1 of which was STS. Reports including only STS cases were eligible, provided that they had collected information on tumor grade. Reports including both soft-tissue lesions and lesions at other sites (e.g., bone) were included, provided that 18F-FDG PET information on soft-tissue lesions could be separated.
We conducted MEDLINE and EMBASE searches (last update, February 2002) using various search terms for PET (PET, positron emission tomography, 18F-FDG, and fluorodeoxyglucose) and sarcoma and limited the search to “human subjects.” Searches were also conducted using names of specific histologic types of STS (liposarcoma, malignant fibrous histiocytoma, leiomyosarcoma, fibrosarcoma, malignant schwannoma, synovial sarcoma, and peripheral nerve sheath tumor). Furthermore, we also perused the references of retrieved articles to find additional studies and communicated with expert investigators for additional data and clarifications. We set no language restrictions.
Data Extraction
We extracted information on authors, year of publication, age, number of subjects, benign and malignant lesions evaluated, inclusion and exclusion criteria, number of primary lesions and of lesions assessed for recurrence, study design (prospective, retrospective, or unclear), histologic types, technical characteristics of PET, diagnostic parameters considered, definition and interpretation of the reference test (biopsy and type thereof, operative histologic diagnosis, other imaging, clinical, other, and unspecified), and potential for verification bias. Verification bias refers to incomplete confirmation of the results of the test under investigation with the reference test (e.g., no biopsy performed when PET suggests benign lesion).
For each report, we recorded the number of true positives, false positives, true negatives, and false negatives for 18F-FDG PET in diagnosing malignant versus benign lesions using the following prespecified parameters: (a) qualitative visualization (simple visualization, qualitative interpretation by experts, or assessment based on a tumor-to-background ratio [TBR] ≥ 3.0 without correction for dose of 18F-FDG, weight, and plasma glucose); (b) standard uptake value (SUV) ≥ 2.0; (c) SUV ≥ 3.0; and (d) metabolic rate of glucose (MRG) ≥ 6 μmol/100 g/min. We also separated evaluations for primary lesions from evaluations for potential recurrences. Furthermore, whenever information was provided on tumor grade, we recorded the number of lesions that were positive by PET (based on each of the above definitions) for intermediate/high-grade (G II/III) and low-grade (G I) tumors. Benign lesions were separated into noninflammatory and inflammatory ones.
For reports that had also used CT scans or MRI, we evaluated the performance of each test in diagnosing primary disease, local recurrence, and metastases. Data were compared on the same patients when 2 imaging procedures had been performed in parallel. For reports describing longitudinal evaluation of therapeutic response with serial 18F-FDG PET, the baseline (pretherapy) data were used in the quantitative synthesis. In addition, we extracted descriptive information regarding the impact of 18F-FDG PET on patient management.
Statistical Analysis
Data were combined quantitatively to provide summary information across studies for each of the 4 prespecified diagnostic definitions. We estimated the overall number of true positives, false negatives, true negatives, and false positives, and we estimated the overall sensitivities and specificities using a random- effects model that incorporated between-study variability. We also performed data synthesis using the summary receiver operating characteristic (SROC) approach that takes into consideration the interdependence between sensitivity and specificity (5,6). Combining sensitivity and specificity data independently across studies may underestimate both parameters and provides no information about the effect of diagnostic threshold. However, the overall random-effects estimates fall close to the SROC curve and can provide a useful indicator of where most investigations operated. The SROC curve shows how the true-positive rate (sensitivity) changes as a function of false-positive rate (1 − specificity) across all studies, when the same diagnostic criterion is used to classify cases as benign or malignant. It is estimated by the equation D = a + bS, where D is the difference of the logit of the true-positive rate and the logit of the false-positive rate and S is the respective sum. Both unweighted and weighted regressions were evaluated. When sufficient data are available, the area under the curve (AUC) can also be estimated. For all analyses, data on primary lesions were treated separately from data on evaluation of recurrences whenever feasible. The main analyses combined all data. Subgroup analyses were also performed for each subgroup (primary and recurrent). We also report typical pairs of sensitivity and specificity from these curves, taking as reference value for specificity the one estimated by random effects weighting of specificities across the included studies.
For the analysis of grading, we calculated the percentage of subjects with each type/grade of lesion when 18F-FDG PET was positive by each of the prespecified diagnostic criteria. Exact 95% confidence intervals (CIs) are also provided. Differences in pooled proportions were tested by Fisher exact test. Analyses were conducted in SPSS (SPSS Inc.), Meta-Test (Joseph Lau), and StatXact 3.0 (Cytel Inc.).
RESULTS
Eligible Studies
Thirty-three potentially relevant articles were identified and examined in full text. Of those, 18 articles were rejected: 10 articles were rejected because they had <3 soft- tissue lesions; 3 other reports (with a total of 37 patients) (7–9) were rejected because they included only STS cases without grading or only benign lesions; and another 2 overlapping reports were rejected (10,11) because they included data on both bone and soft-tissue lesions that could not be separated. We attempted to contact authors for more data but this was not successful. The remaining articles (12–29) were scrutinized for potential overlap. Among 3 overlapping reports by the Heidelberg team (12–14), only the most comprehensive was retained (14). There were 4 publications by the Groningen team (15–18). The most recent (16) was excluded because it overlapped, to a considerable extent, with previous reports and provided only MRG data, whereas the earlier reports also had additional parameters. Two other reports (17,18) had partial overlap: one examined only primary lesions, whereas the other examined some of the same primary lesions and recurrent lesions. To avoid duplication, we retained the first report (17) and the recurrent-lesions group from the other report (18). Finally, the St. Thomas team had published 5 reports (19–23), but they all provided largely nonoverlapping, complementary information. Thus, 15 reports were analyzed (Table 1) (14,15,17–29).
Characteristics of Studies Evaluating 18F-FDG PET for Diagnosis or Grading of STS
In all, a total of 421 subjects with soft-tissue lesions had been assessed with 18F-FDG PET, and 416 could be evaluated (5 patients had either a PET technical failure or no diagnostic documentation). There were 441 evaluable lesions (227 malignant and 214 benign). Three small studies included only malignant lesions documented by biopsy. Otherwise, both malignant and benign lesions were included in 12 reports. There was a total of 264 primary lesions and 177 lesions evaluated for recurrence. Seven studies addressed only primary lesions, 4 addressed only lesions suspected for recurrence, and 4 addressed both.
Diagnoses
We retrieved specific histologic diagnoses on malignant tumors from all studies with one exception (22). Among 208 malignant tumors with recorded histology, the most common were liposarcoma and variants (n = 56), malignant fibrous histiocytoma (n = 43), leiomyosarcoma (n = 21), fibrosarcoma (including myxofibrosarcoma) (n = 13), malignant schwannoma (n = 13), synovial sarcoma (n = 12), and peripheral nerve sheath tumor (n = 11). These types accounted for over 80% of STS. Of note, soft-tissue malignancies also included 1 case of non-Hodgkin lymphoma and 1 case of metastatic nasopharyngeal carcinoma.
Specific diagnoses were available for all 214 benign lesions. The most common diagnoses were postsurgical or posttraumatic lesions (typically scars, n = 113), lipoma (n = 23), neurofibroma (n = 21), hemangioma (n = 13), and schwannoma (n = 12). Overall, there were 199 benign noninflammatory lesions and 15 benign lesions with acute or chronic inflammation (infectious or noninfectious).
18F-FDG PET and Reference Test Characteristics
A variable amount of radiopharmaceutical was used across studies (148–407 MBq). Imaging was typically performed after fasting from a few hours to overnight. With one exception (21), all studies attempted some qualitative interpretation of the PET images, based mostly on various nonquantitative criteria with consensus between radiologists, and in 3 studies, a crude TBR was also used. SUV was estimated in 9 studies, all of which had primary lesions, and 3 also included an evaluation of recurrences (total of 12 case series). MRG was estimated in 5 studies (3 of primary lesions, 2 evaluations of recurrences). Histology was the typical reference standard for all lesions, but there were some notable exceptions. In 3 studies (19,20,22), most or all of the patients with benign-appearing lesions did not have histologic confirmation, and diagnosis depended only on clinical and radiologic criteria. This represents considerable verification bias. A small number of patients with benign lesions did not have histologic confirmation in a fourth study (14) (Table 2). Typically there was no clear mention about whether 18F-FDG PET evaluations were performed without knowledge of histologic results.
Characteristics of 18F-FDG PET Imaging and of Reference Standards
Data Synthesis: Diagnosis of Malignant Versus Benign Lesions
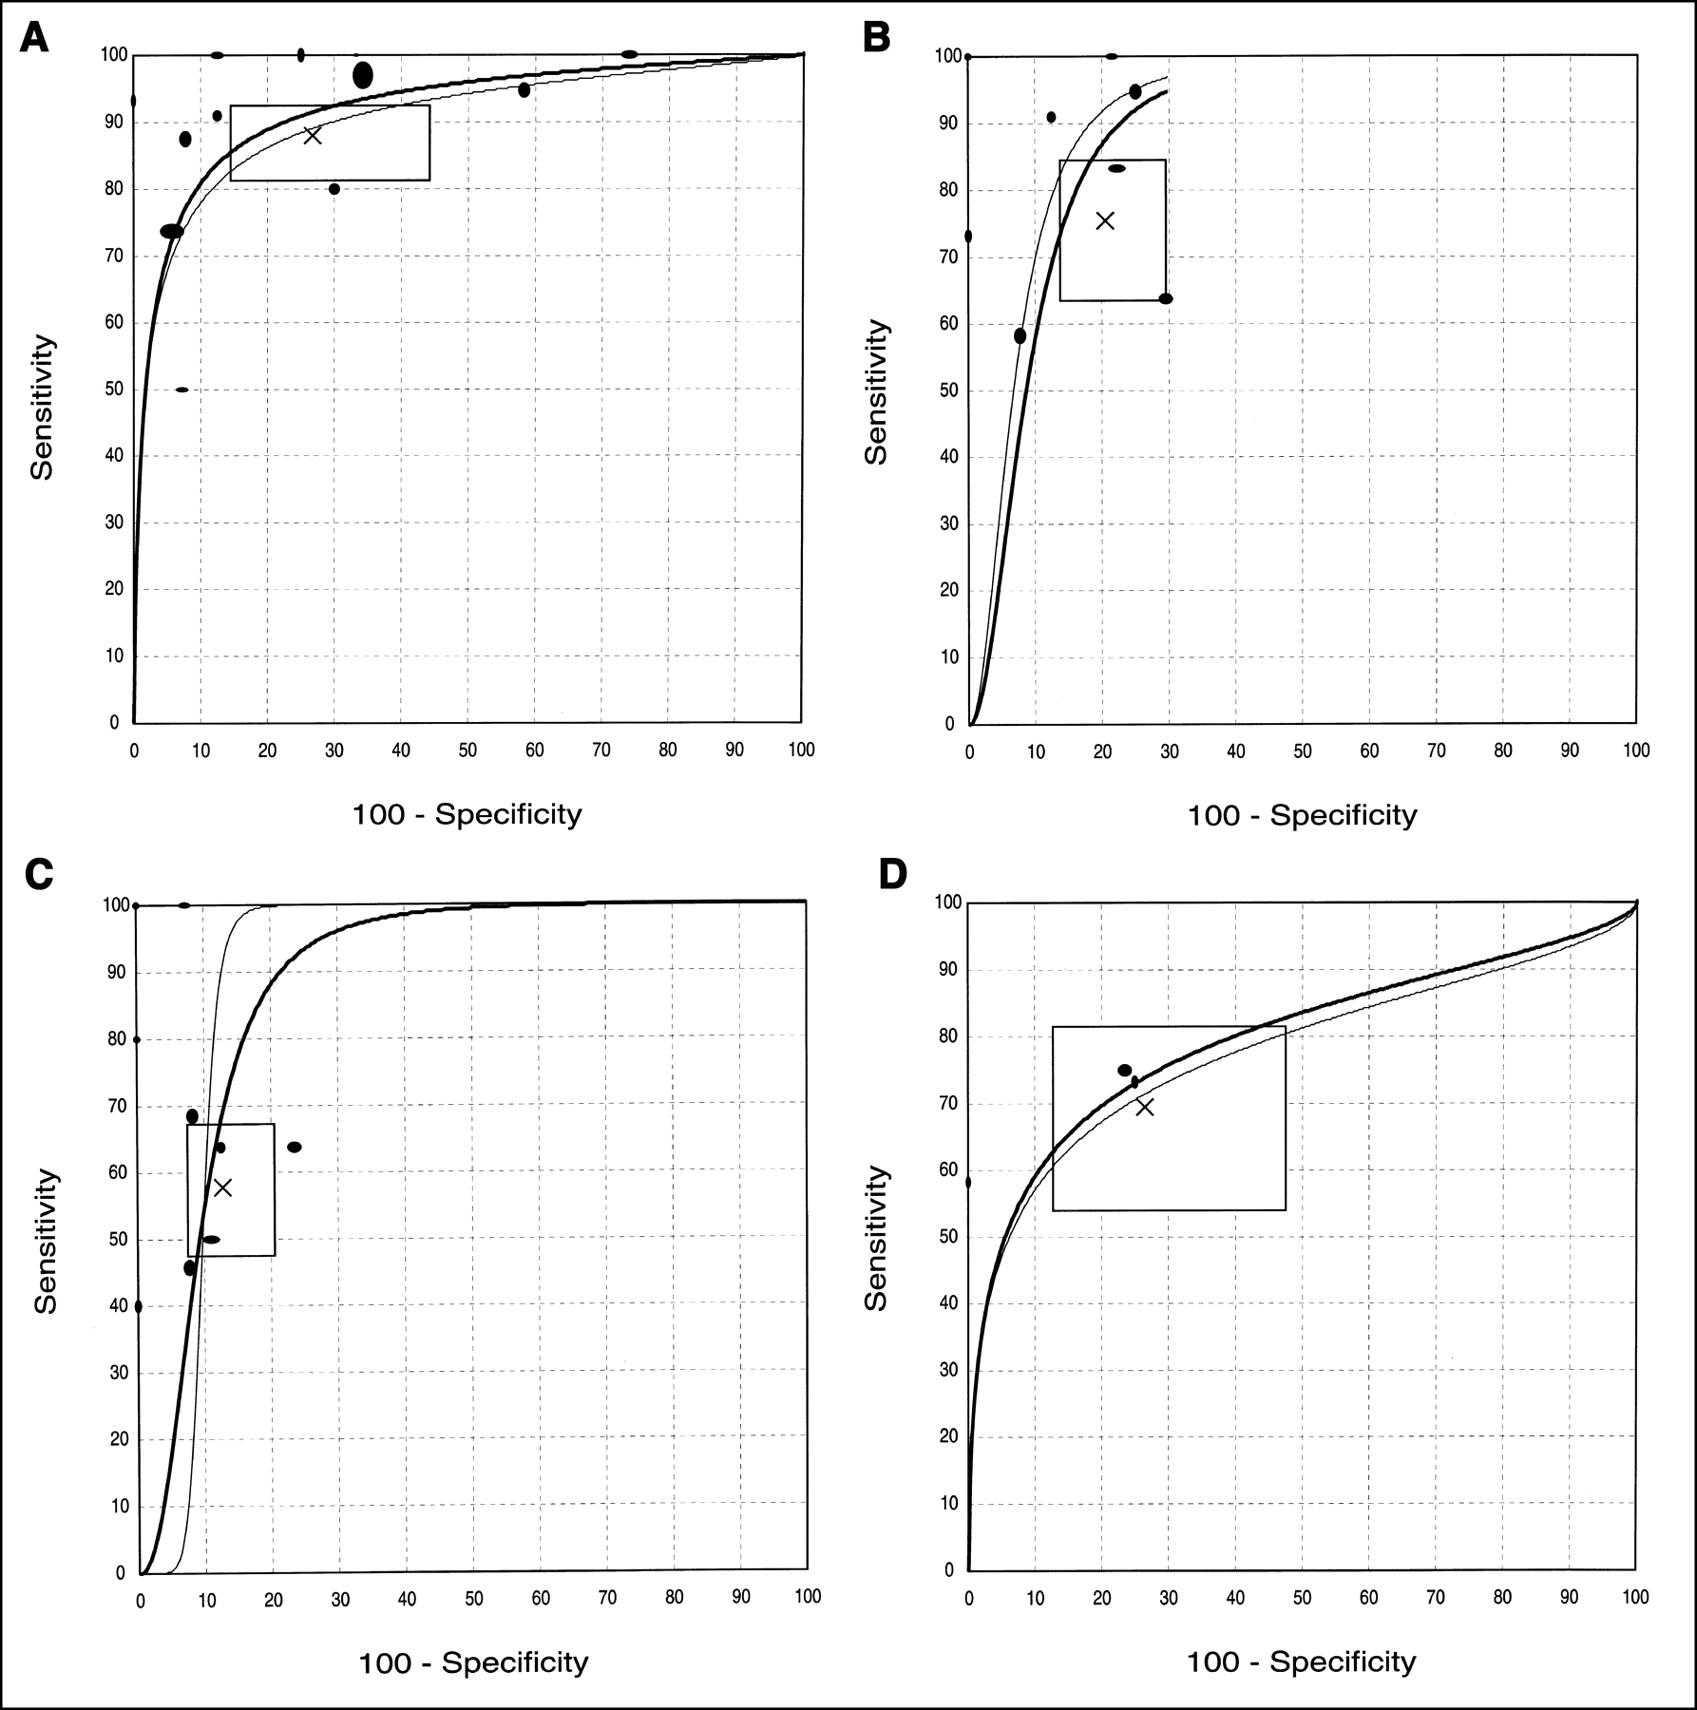
Summary estimates are presented in Table 3 for all the examined diagnostic parameters. Qualitative visualization interpretations were available on 398 subjects from 13 case series comparing malignant and benign lesions. There were 184 true-positives (patients with malignancies detected as such by 18F-FDG PET), 16 false-negatives (patients with malignancies considered benign by 18F-FDG PET), 145 true-negatives (patients with benign lesions correctly identified by 18F-FDG PET), and 53 false-positives (patients with benign lesions incorrectly classified as malignant by 18F-FDG PET). Respective numbers from 10 case series with SUV data with a cutoff of 2.0 (or 3.0) were 79 (or 60) true-positives, 21 (or 40) false-negatives, 89 (or 97) true-negatives, and 19 (or 11) false-positives. Data on MRG were limited (n = 66 from 4 case series) and included 30 true-positives, 12 false-negatives, 18 true-negatives, and 6 false-positives. The overall accuracy rate was 82.7%, 80.8% (or 75.5%), and 72.7%, respectively, with these diagnostic parameters. The studies seemed to operate at different parts of the SROC curve, and independent estimates of sensitivity and specificity (Table 3) or simple pooled accuracy rates might be underestimating the true performance of the test. The diagnostic performance was better when formal SROC analyses were undertaken (Table 3 and Fig. 1). Both SUV and simple qualitative visualization had somewhat better diagnostic performance than MRG. An AUC would be meaningful only for qualitative visualization, when there were both sufficient data and a wide range (0%–100%) of specificity estimates in individual studies. AUC was estimated at 0.91 (0.92 with weighted regression). There was no evidence of a different overall diagnostic performance (based on AUC estimates) when primary lesions were examined separately from evaluations for recurrence. However, diagnostic performance trended toward larger sensitivity and smaller specificity in primary lesions than in evaluations of recurrent lesions (Table 3). 18F-FDG PET was highly specific in ruling out recurrence but had limited sensitivity for diagnosing recurrence.

SROC curves for (A) qualitative visualization, (B) standard uptake value (cutoff, 2.0), (C) standard uptake value (cutoff, 3.0), and (D) metabolic rate of glucose (cutoff, 6.0 μmol/100 g/min). Curves show trade-off between true-positive rate (sensitivity) and false-positive rate (100 − specificity) across all pertinent studies. Each study is shown by eclipse with diameters approximately proportional to number of subjects evaluated for sensitivity (vertical dimension) and specificity (horizontal dimension) of study. Two SROC curves are shown based on weighted (bold line) and unweighted (thin line) calculations. SROC curves should be used for inferences of diagnostic accuracy preferably within range of sensitivity and specificity values of studies that are included in their calculations. X = random effects estimates of sensitivity and specificity; horizontal and vertical dimensions of rectangle = corresponding 95% confidence intervals.
Summary Diagnostic Performance of 18F-FDG PET for Diagnosing Malignant vs. Benign Soft-Tissue Lesions
Data Synthesis: Grading
In the 11 case series in which tumor grading was assessed and qualitative visualization was used, all 133 (100% [95% CI, 97.3%–100%]) intermediate/high-grade malignant lesions and 32/43 (74.4% [95% CI, 58.6%–85.9%]) low-grade malignant lesions were detected. The respective rate for benign lesions was 35/89 (39.3% [95% CI, 29.1%–50.3%]) in the same studies or 74/196 (37.8% [95% CI, 31.0%–44.9%]) when studies without tumor grading were included. Rates differed significantly between the 3 groups. Of 12 inflammatory benign lesions, 11 were positive on 18F-FDG PET (91.7% [95% CI, 61.5%–99.8%]).
In the 8 case series in which tumor grading was assessed and SUV was estimated, values above 2.0 were seen in 59/66 (89.4% [95% CI, 79.4%–95.6%]) of intermediate/high-grade malignant lesions, 8/24 (33.3% [95% CI, 15.6%–55.3%]) of low-grade malignant lesions, and 13/68 (19.1% [95% CI, 10.6%–30.5%]) of benign lesions. SUV values above 3.0 were seen in 45/66 (68.2% [95% CI, 55.6%–79.1%]), 3/24 (12.5% [95% CI, 26.6%–32.4%]), and 8/68 (11.8% [95% CI, 5.2%–21.9%]), respectively. With either cutoff, there was no significant difference between the low-grade malignant lesions and the benign lesions, whereas intermediate/high-grade malignant lesions differed significantly from both other groups. Inferences were similar when data on benign lesions were included from studies without tumor grading (data not shown).
MRG data were limited, but the inferences were similar. Values ≥ 6.0 μmol/100 g/min were seen in 32/35 (91.4% [95% CI, 76.9%–98.2%]) G II/III tumors, 1/13 (7.7% [95% CI, 0.2%–36.0%]) G I tumors, and 6/24 (25.0% [95% CI, 9.8%–46.7%]) benign lesions (all noninflammatory).
Comparison with MRI and CT
Several studies on primary lesions clarify that part of the inclusion criteria was the prior performance of CT, MRI, or ultrasound, suggestive of malignancy. Because MRI/CT and 18F-FDG PET are performed in series, rather than in parallel, one cannot address their comparative accuracy for primary soft-tissue lesions. The same applies to studies on evaluation of recurrence, with 2 exceptions: In one study (22), 18F-FDG PET sensitivity was 13/17 (76%) and specificity was 47/50 (94%) versus 15/17 (88%) and 48/50 (96%), respectively, for paired MRI. 18F-FDG PET was wrong in 3 cases in which MRI was correct. The study may have substantial verification bias. In the other study (15), PET had 92% sensitivity (12/13) and 100% specificity (2/2). Paired MRI failed to diagnose 3 malignant lesions (including the one also misdiagnosed as benign by PET) and misdiagnosed both benign lesions (scar and Ascaris mass). PET was correct in 4 cases in which MRI was wrong.
Data on the comparative performance of 18F-FDG PET for the diagnosis of distant metastasis were also sparse. In 1 study (22), PET was positive by qualitative interpretation in 13/15 lung metastases (sensitivity, 87%) and was negative in all 55 cases without metastasis (specificity, 100%). Paired CT scans had 100% sensitivity and 96% specificity. PET failed to detect 2 lung metastases seen on CT but was correct in 2 cases in which CT was falsely positive. The study suffers from substantial verification bias for patients with negative imaging. Inconclusive retrospective paired CT and PET data were also given by 1 of the excluded studies (7) on 8 patients and were also subject to verification bias.
Longitudinal Evaluation of Treated STS
18F-FDG PET was used for the evaluation of response to therapy in 3 case series with at least 4 subjects involving radiotherapy hyperthermia (n = 4); hyperthermic isolated limb perfusion with tumor necrosis α, interferon γ,and melphalan (n = 20); and various modalities (n = 8), for a total of only 32 patients (24,18,7). PET showed clear changes in the treated tumors but did not discriminate partial from complete response in the largest study (18).
DISCUSSION
18F-FDG PET has very good, but not perfect, performance in differentiating benign from malignant soft-tissue lesions. Practically all intermediate/high-grade STSs are accurately diagnosed on the basis of qualitative interpretation; almost all of them have SUV ≥ 2.0, and the large majority has MRG ≥ 6 μmol/100 g/min. Most low-grade tumors are also diagnosed on qualitative interpretation, but they usually have SUV < 2.0 and rarely have MRG ≥ 6 μmol/100 g/min. Neither SUV nor MRG can differentiate low-grade tumors from benign lesions, and inflammatory lesions have quantitative characteristics similar to those of high-grade malignancies.
There were no major differences in the diagnostic performance when variable diagnostic parameters were considered, including qualitative visualization, single SUV measurements, or dynamic estimation of MRG. Paradoxically, the estimated diagnostic performance was at its worst with the more sophisticated MRG. The differences could easily be caused by chance. However, one might have expected probably an opposite trend with worse diagnostic performance for subjective parameters. It is possible that the diagnostic performance of the qualitative evaluations might have been spuriously inflated if the evaluators had not been unaware of the clinical and histologic information of each subject. In fact, although we standardized the cutoffs for SUV and MRG in the meta-analysis, the qualitative evaluations used a variety of rules across studies. With the exception of studies using TBR, these rules were largely subjective and depended on consensus between radiologists. Post hoc modulation of diagnostic thresholds may also spuriously inflate the estimated performance of a diagnostic test. Furthermore, it is unknown whether some publication bias may be operating against the publication of studies that may have found less promising results (30). Finally, there was a large scatter of sensitivity and specificity values with the qualitative rules used. Simple qualitative interpretation is unlikely to offer a generalized standard for routinely interpreting 18F-FDG PET scans across different centers.
SUV and MRG are more objective measures in this regard. For SUV, a cutoff of 2.0 was probably preferable to a cutoff of 3.0 in adequately discriminating between benign and malignant lesions. Nevertheless, even the 2.0 cutoff will give false-positive results for almost one fifth of the benign lesions, whereas it will miss two thirds of low-grade tumors. MRG had an even worse performance and, overall, was not a good discriminating parameter, although data were very limited. Although we had to exclude 1 MRG study with nonseparable data on bone and soft-tissue lesions (10,11), the composite data seem similar to what we observed in the remaining studies. Similarly, neither SUV nor MRG is perfect in assigning tumor grade to a malignant lesion. We should acknowledge, however, that tumor grade in STS may sometimes be difficult to establish even with histologic examination. Thus, even a perfect imaging test may spuriously seem to have less than perfect concordance with histologic readings. By measuring the metabolic activity of a lesion, it is possible that 18F-FDG PET values may offer additional long-term prognostic information besides histology. However, no long-term prognostic analyses have been performed with 18F-FDG PET on STS to date.
There are no good quality data on the comparative diagnostic performance of 18F-FDG PET against CT scans or MRI for the diagnosis of primary soft-tissue lesions, because all studies to date have used these imaging tests in series, not in parallel. There is limited evidence suggesting an approximately equivalent diagnostic performance of 18F-FDG PET and MRI for assessing local recurrence and even more limited evidence suggesting approximately equivalent performance of PET and CT scan in searching for distant metastatic disease. The one study of adequate sample size pertains to lung metastatic disease. 18F-FDG PET has been considered to be useful technique for the evaluation of lung nodules in general (31), and it is conceivable that this may apply also in the evaluation of lung lesions in patients with STS. There are very limited data on the usefulness of PET in assessing the response of STS to therapy. One study (16) suggests that tyrosine PET may be superior to 18F-FDG PET for assessing response to therapy, but the data are equally limited. Thus, based on the current evidence, it is unclear whether PET can offer any advantage over traditional imaging modalities. There is considerable enthusiasm about the ability of 18F-FDG PET to assess the response of various tumors to therapy (1,32), but more data are needed for STS.
By assembling a large number of subjects, the meta-analysis has managed to estimate the diagnostic accuracy of 18F-FDG PET in STS diagnosis and grading, decreasing the uncertainty inherent in isolated case series. 18F-FDG PET seems to be a promising technology, and its diagnostic performance is very good. The ability to gain insight into the metabolic parameters of a lesion with 18F-FDG PET has generated extensive enthusiasm (1,2,32). However, despite the experimental enthusiasm and the wide field of potential applications (1,2), routine use needs to be scrutinized carefully (33). The incremental value of 18F-FDG PET against other imaging modalities and its proper role in the management and prognostic assessment of STS remain largely unknown.
CONCLUSION
18F-FDG PET is a useful imaging modality in the evaluation of both primary and recurrent soft-tissue lesions. 18F-FDG PET may be clinically helpful in tumor grading, whereas it may not always offer adequate discrimination between low-grade tumors and benign lesions. Future research should better clarify the incremental diagnostic yield and long-term clinical benefit derived from the use of 18F-FDG PET when compared with or added to other imaging modalities. The cost-effectiveness of different imaging strategies would also need to be delineated, but it is hoped that by better diagnosis, grading, and staging, PET may actually reduce the cost and complications of invasive diagnostic and therapeutic interventions in patients with various forms of cancer (2,34), including STS. Finally, 18F-FDG may need to be compared against other newer radiopharmaceuticals (35,36) in STS diagnosis.
Acknowledgments
This article is based on an evidence report produced under contract 290-97-0019, task order 11, from the Agency for Healthcare Research and Quality (AHRQ) Technology Assessment (TA) Program. The AHRQ TA Program is funded through AHRQ and the Centers for Medicare and Medicaid Services.
Footnotes
Received Aug. 12, 2002; revision accepted Dec. 19, 2002.
For correspondence or reprints contact: Joseph Lau, MD, Division of Clinical Care Research, Tufts–New England Medical Center, 750 Washington St., Boston, MA 02111.
E-mail: JLau1{at}tufts-nemc.org
REFERENCES
In this issue


Jump to section
Related Articles
Cited By...
- Comparison of [68Ga]Ga-Fibroblast Activation Protein Inhibitor-04 and [18F]FDG PET Imaging for Solitary Fibrous Tumor and Preliminary Application of FAP-Targeted Radiopharmaceutical Therapy
- Diagnostic Accuracy of 68Ga-FAPI Versus 18F-FDG PET in Patients with Various Malignancies
- 68Ga-FAPI as a Diagnostic Tool in Sarcoma: Data from the 68Ga-FAPI PET Prospective Observational Trial
- Simulation of Tracer Dose Reduction in 18F-FDG PET/MRI: Effects on Oncologic Reading, Image Quality, and Artifacts
- Imaging in Sarcoma
- Correlation Between Glycolytic Phenotype and Tumor Grade in Soft-Tissue Sarcomas by 18F-FDG PET
- Contemporary Imaging in Sarcoma
- 11C-Methionine vs. 18F-FDG PET in Soft Tissue Sarcoma Patients Treated with Neoadjuvant Therapy: Preliminary Results
- Imaging Bone and Soft Tissue Tumors with the Proliferation Marker [18F]Fluorodeoxythymidine
- 18F-FDG PET for Evaluation of Bone Marrow Infiltration in Staging of Lymphoma: A Meta-Analysis
- Detection and Grading of Soft Tissue Sarcomas of the Extremities with 18F-3'-Fluoro-3'-Deoxy-L-Thymidine