


Abstract
18F-FDG kinetics are primarily dependent on the expression of genes associated with glucose transporters and hexokinases but may be modulated by other genes. The dependency of 18F-FDG kinetics on angiogenesis-related gene expression was evaluated in this study. Methods: Patients with primary colorectal tumors (n = 25) were examined with PET and 18F-FDG within 2 days before surgery. Tissue specimens were obtained from the tumor and the normal colon during surgery, and gene expression was assessed using gene arrays. Results: Overall, 23 angiogenesis-related genes were identified with a tumor-to-normal ratio exceeding 1.50. Analysis revealed a significant correlation between k1 and vascular endothelial growth factor (VEGF-A, r = 0.51) and between fractal dimension and angiopoietin-2 (r = 0.48). k3 was negatively correlated with VEGF-B (r = −0.46), and a positive correlation was noted for angiopoietin-like 4 gene (r = 0.42). A multiple linear regression analysis was used for the PET parameters to predict the gene expression, and a correlation coefficient of r = 0.75 was obtained for VEGF-A and of r = 0.76 for the angiopoietin-2 expression. Thus, on the basis of these multiple correlation coefficients, angiogenesis-related gene expression contributes to about 50% of the variance of the 18F-FDG kinetic data. The global 18F-FDG uptake, as measured by the standardized uptake value and influx, was not significantly correlated with angiogenesis-associated genes. Conclusion: 18F-FDG kinetics are modulated by angiogenesis-related genes. The transport rate for 18F-FDG (k1) is higher in tumors with a higher expression of VEGF-A and angiopoietin-2. The regression functions for the PET parameters provide the possibility to predict the gene expression of VEGF-A and angiopoietin-2.
Most of the oncologic PET studies are performed as whole-body or partial-body examinations based on multiple static acquisitions. A limited number of 18F-FDG examinations are performed as dynamic studies, which provide the possibility to assess quantitatively the parameters of 18F-FDG kinetics. 18F-FDG uptake in static images is dependent on several factors, including the fractional blood volume (VB) of a tumor, the glucose transport, and the phosphorylation of the intracellular 18F-FDG. The impact of these factors is dependent on the tumor histology and can be very different. We have recently shown that the 18F-FDG uptake in primary colorectal tumors is mainly dependent on k3, which reflects the phosphorylation of the intracellular 18F-FDG (1).
Several studies have been performed to assess the impact of the transporters and hexokinases on the glucose or 18F-FDG kinetics. Pedersen et al. investigated the association of glucose transporters and vascular endothelial growth factor (VEGF) in 2 human small-cell lung cancer lines (2). The authors noted a co-upregulation of glucose transporter 1 (GLUT-1), GLUT-3, and VEGF, which suggests a modulation of the glucose kinetics by angiogenesis-related genes. Airley and Mobasheri focused on the aspects of hypoxic regulation of glucose transport, metabolism, and angiogenesis and emphasized the link between hypoxia, angiogenesis, and glucose transporters (3). Current PET technology provides the possibility to assess the 18F-FDG transport and phosphorylation quantitatively using dynamic data-acquisition protocols and the application of dedicated software programs, which is helpful, for example, in achieving a more accurate diagnosis in sarcomas (4). Furthermore, the quantitative PET data obtained by applying a 2-tissue-compartment model can be compared with gene-expression data, if tumor samples are available from the same region (5). Thus, 18F-FDG kinetics and gene expression can be compared, and correlations may be detected. The combination of dynamic PET studies and gene-array analysis was used within this study to assess the impact of angiogenesis-related gene expression on 18F-FDG data.
MATERIALS AND METHODS
A total of 25 patients with histologically confirmed colorectal tumors were studied. PET examinations with 18F-FDG were performed as part of the routine staging procedure before surgery. Only patients with tumors exceeding 3 cm were considered for the data evaluation in this study, and patients with a tumor of the rectum and sigmoid region were preferentially selected. All PET studies were performed within 2 d before surgery. Histologic data, endoscopic results, and CT images were available when the PET examination was performed. The location of the primary tumor was chosen for the initial dynamic series, followed by additional static acquisitions to complete a partial whole-body examination.
Dynamic PET studies with 18F-FDG are routinely performed at our institution using a 28-frame protocol for 60 min, beginning with the 18F-FDG injection (250–370 MBq). The acquisition protocol includes 10 frames of 30 s, 5 frames of 60 s, 5 frames of 120 s, and 8 frames of 300 s. Additional static image acquisitions were obtained from the proximal legs to the neck by moving the table in the craniad and caudad directions. The gap used for each repositioning was 13.5 cm. The PET system (ECAT EXACT HR+; Siemens) provided an axial field of view of 15.3 cm and was operated in 2-dimensional mode. The maximum number of slices was 63, with a theoretic slice thickness of 2.425 mm. A 10-min transmission scan preceded the dynamic series and was used for the correction of the dynamic emission data. Static scans were performed with 3-min transmission and 7-min emission acquisition times. The software developed at our center was used to reconstruct images iteratively using the ordered-subset expectation maximization algorithm (6 iterations, 2 subsets), and the median root prior correction was applied to the intermediate matrices, which limits the dependency of the pixel maximum from the number of iteration steps. We do not use any filtering after the image reconstruction. The theoretic voxel size was 2.277 × 2.277 × 2.425 mm, and all image data were converted by the reconstruction program to milli–standardized uptake value (SUV) as the unit of choice and stored in interfile and DICOM format. The milli-SUV images were used for further quantitative evaluations with compartment and noncompartment models. Generally, the SUV was calculated according to the method of Strauss and Conti (6): SUV = tissue concentration [Bq/g]/(injected dose [Bq]/body weight [g]).
The quantitative evaluation of the dynamic PET data was performed with PMOD software (PMOD Technologies). First, visual analysis was performed by evaluating the target volume on the transaxial, coronal, and sagittal images. Then, the images were correlated with the available CT images as well as the clinical information provided by endoscopy. The primary aim was to identify the tumor itself most accurately and to position volumes of interest (VOIs) in the tumor volume. A VOI is based on multiple regions of interest (ROIs) positioned over the target area on several slices. The original ROIs were visually repositioned, but not redrawn, in each slice where the target structure was identified. In addition to the tumor area, a VOI was placed over the normal colon. The surgeons were informed about the positioning of the VOIs in the PET examination and removed a specimen from this target area. After surgery, the surgeon reported the location of the tissue specimen, and the position of the specimen was compared with the PET evaluation to optimize the anatomic association of PET data and surgery.
The quantitative evaluation of the dynamic PET studies was performed by fitting a 2-tissue-compartment model to the VOI data. The 2-tissue-compartment model uses an input function to provide the 18F-FDG concentration in the vessels. Ohtake et al. showed that the input data for 18F-FDG can be accurately obtained via ROIs over large blood vessels (7). Therefore, we placed at least 7 ROIs over the descending aorta to obtain the blood data for 18F-FDG. The recovery coefficient is 0.85 for a diameter of 8 mm using our reconstruction protocol. Because the diameter of all VOIs exceeded 8 mm, no partial-volume correction was applied. After the placement of VOIs for the tumor, the normal colon, and the blood vessels, the 2-tissue model was fitted iteratively to obtain the compartment parameters. The software provided the constants k1 and k2, which are associated with 18F-FDG transport; the constants k3 and k4, which correlated with the phosphorylation and dephosphorylation of the intracellular 18F-FDG; and the parameter VB, which reflected the fractional blood volume in the target volume, also referred to as vessel density. The compartment fitting was visually evaluated to assess the quality of each curve fit for a VOI. The summed χ2 for the fitted curve and the measured data was used as the cost function, where the criterion was to minimize the summed squares (χ2) of the differences. The residual covariance was dependent on the kinetic parameter and typically less than 10% for k1. Results were accepted as valid if k1–k4 were less than 1 and VB exceeded 0. The rate constants have the unit 1/min, whereas VB is associated with the fraction of blood within the evaluated target volume. The global influx of 18F-FDG was calculated from the compartment data using the following equation: influx = (k1 × k3)/(k2 + k3). Besides the compartment model, a noncompartment model was used to calculate the fractal dimension (FD) of the time–activity curve. The FD varies from 0 to 2 and provides information about the more deterministic or chaotic distribution of the tracer over time.
The tissue specimens of the tumor (n = 24) and normal colon (n = 17) were transported in liquid nitrogen, and total RNA was extracted for further processing. The quality of isolated RNA was evaluated photometrically using the 280:260 ratio and on an agarose gel. We used the U133A gene chip (Affymetrix Inc.), which provides quantitative information about 22,283 gene probes. The processing of the RNA and gene arrays was performed according to the manufacturer's recommendations and was already described (5). Gene chip–expression data were normalized for the β2-microglobulin (Affymetrix code 34644_at, Homo sapiens mRNA for β2-microglobulin) using the following equation (5): relative expression value (REV) = 1,000 × (expression value of a gene/expression value for β2-microglobulin).
The statistical evaluation was performed with Stata/SE 10.0 (Stata Corp.) on a Mac Pro (Apple Inc.) 2 × 3 GHz Quad-Core Xeon system (Intel Corp.) with 16 GB of RAM, using Mac OS X 10.5.1. The same system was also used for all data-processing tasks, including dynamic PET and gene-array data. Dedicated software, GenePET, was developed for the correlative evaluation of dynamic PET and gene-array data (8). GenePET stores both gene-array and PET data and also the individual gene codes. Furthermore, a full description of each gene and its function is stored.
RESULTS
Tissue specimens of the tumor and the reference area were obtained in 25 patients. Tumor samples were processed in 24 of 25 patients (1 sample was not acceptable for gene-array analysis because of low total RNA extraction). Samples from the normal colon could be analyzed in 17 of 25 patients (sampled colon specimens in 8 of 25 patients were not acceptable for gene-array analysis). Therefore, gene-expression data were available for statistical data analysis in 24 tumors. In 17 of these 24 tumors, the corresponding normal colon specimens were available for gene-array analysis.
Dynamic PET studies were evaluated in 23 of 25 patients; in 2 cases, the tumors were not within the field of view used for the dynamic series. Overall, we were able to compare dynamic PET data and gene array results in 22 tumors (1 tissue sample of the 23 tumors evaluated dynamically with PET was not usable). Of these 22 patients with primary tumors, dynamic PET and gene data could be evaluated for the normal colon tissue in 15 patients. Because of repositioning of the patients after the dynamic series, the SUV could be calculated additionally in 2 patients in whom we failed to obtain dynamic data of the tumor region. Thus, the SUV and gene-array data could be compared in 24 tumors.
Overall, we were able to assess the SUVs in 24 tumors and 17 normal colon tissues, and we compared dynamic PET data in 22 tumors and 15 normal colon tissue specimens. The basic results for PET are given in Table 1.
Median, Mean, SD, and Number of Patients for Tumors and Reference Tissue (Normal Colon) for PET Results
The GenePET program was used to identify differentially enhanced genes related to angiogenesis (Fig. 1). First, we calculated tumor–to–normal colon ratios by using the tumor and reference samples of each patient. The tumor–to–reference tissue ratio was calculated on a patient-by-patient basis, using the corresponding gene-expression values of the tumor and the normal-tissue data of the same patient. Furthermore, a combined key word search (e.g., vascular OR angio OR endothel OR hypoxia) based on the stored description of the genes was used to select only those genes primarily related to angiogenesis (Fig. 2). Overall, the search algorithm revealed 120 angiogenesis-related genes. Genes with a ratio of at least 1.50 (n = 23) are listed in Table 2. The highest ratio was observed for angiopoietin-2, with a ratio of 8.37.

GenePET display of data obtained with gene array from tumor sample (left) and corresponding quantitative kinetic PET data (right). Both datasets are displayed as image to facilitate detection of, for example, enhanced genes. VEGF-A gene is selected from array data (left, gene code 210512_s_at), and SUV is labeled on right in PET data matrix.
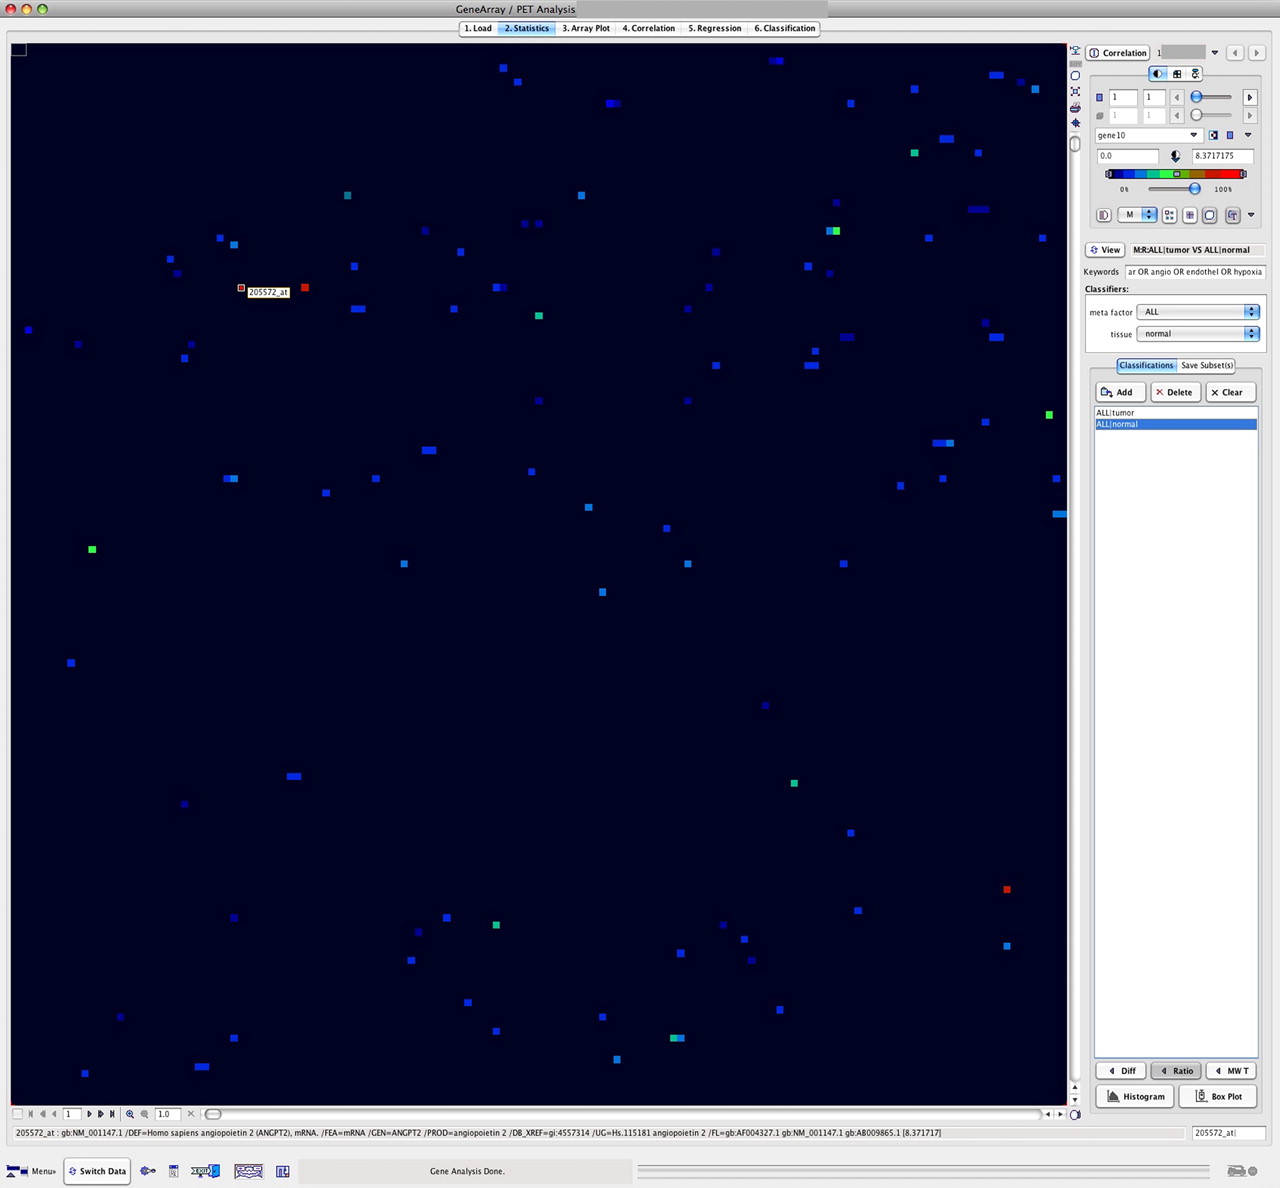
Tumor–to–normal-tissue ratios for genes related to angiogenesis. Ratios are calculated from pairwise gene-expression data for tumor and normal colon of each patient. Key words vascular, angio, endothel, and hypoxia were used for selection and revealed 120 angiogenesis-associated genes. Highest ratio (8.37) was found for angiopoietin-2 (gene code 205572_at).
Tumor-to-Reference Ratios for Angiogenesis-Related Genes
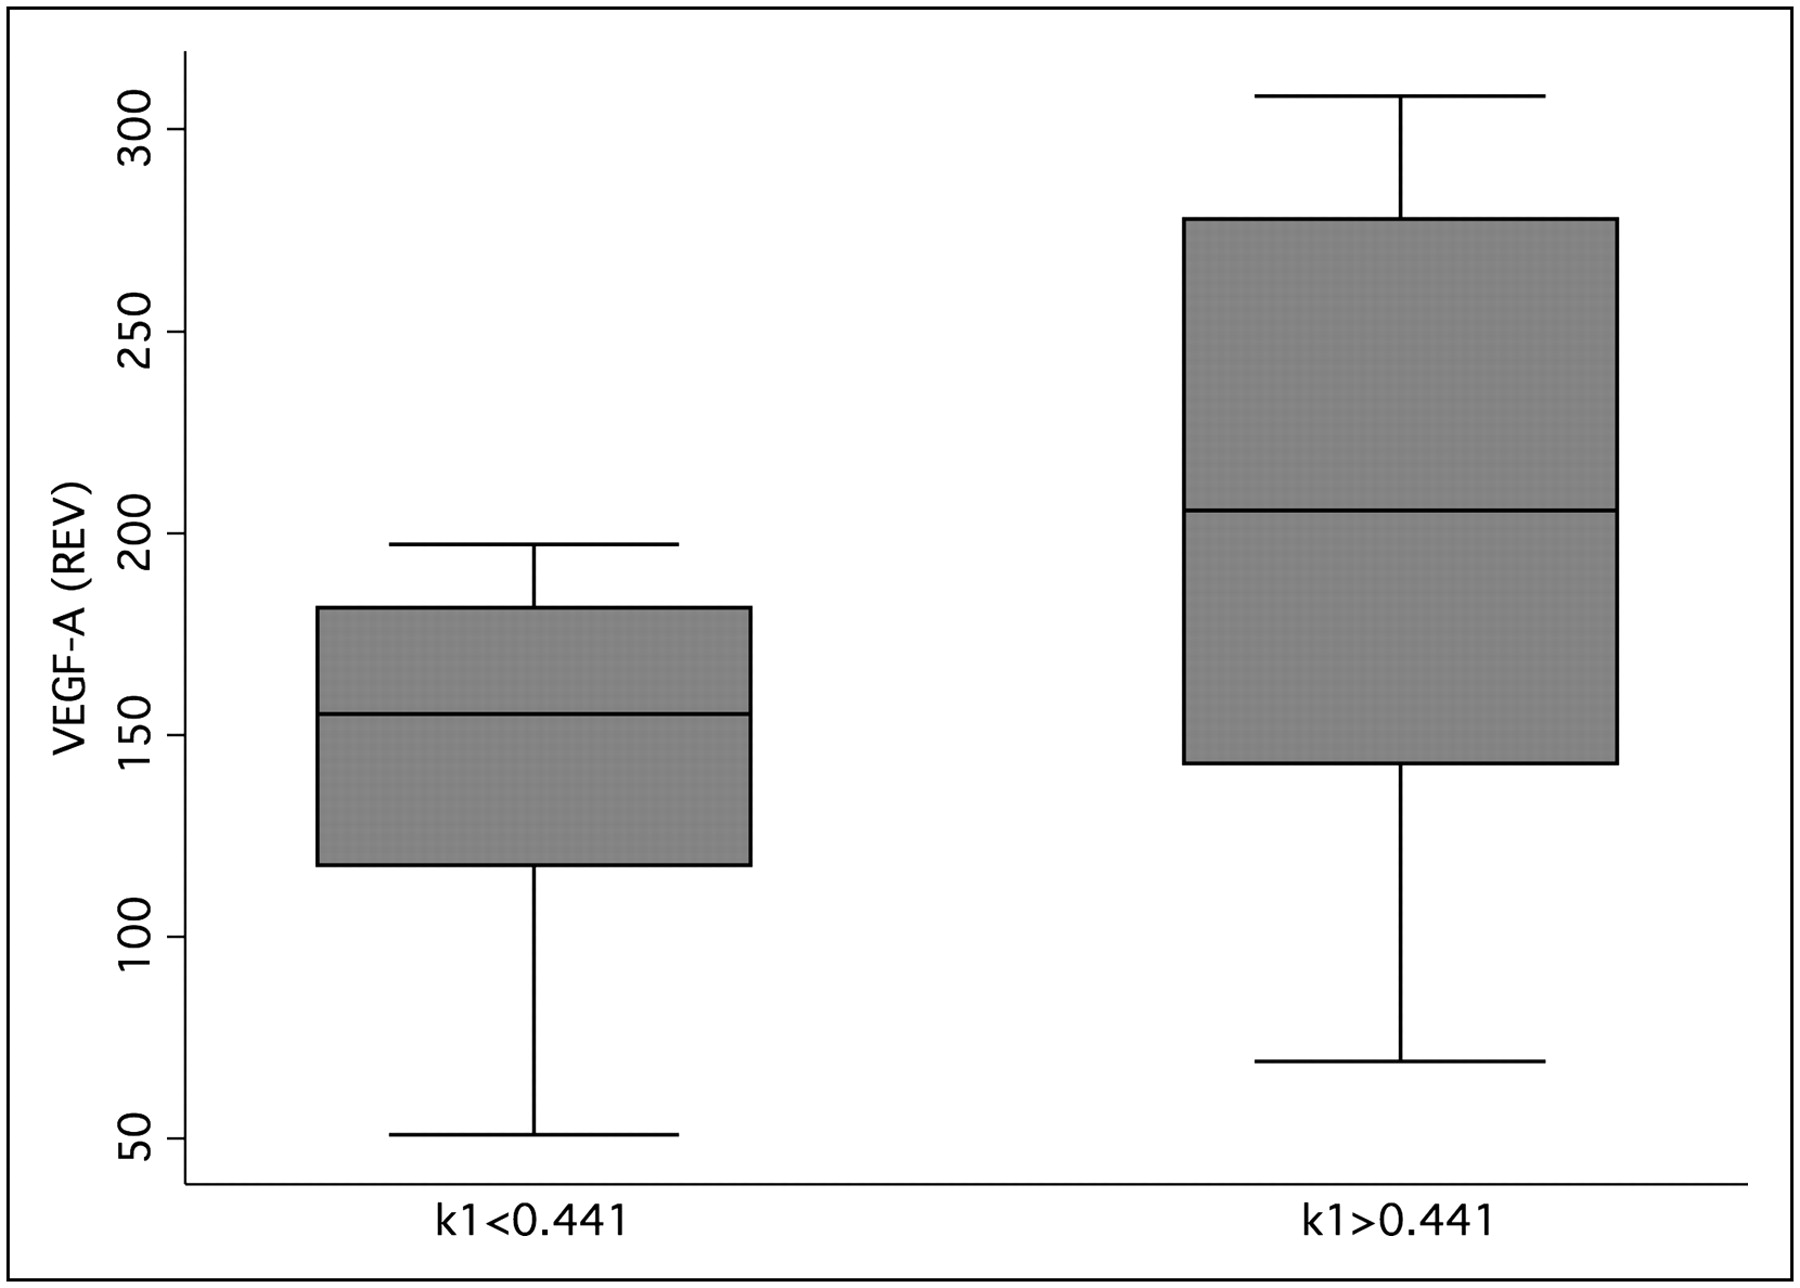
The median value for k1 (k1 = 0.441) was used to classify the tumor data into 2 groups with low and high k1 values. The group analysis using the Wilcoxon rank sum test revealed that low k1 values were associated with low VEGF-A expression (Fig. 3). The results were highly significant (P < 0.001).

Box plot of k1 and VEGF-A expression data for tumor specimen. Median of k1 was used to classify data. Groups were significantly different using Wilcoxon rank sum test (P < 0.001). REV = relative expression value.
Correlation analysis was performed for the tumor specimen to identify dependencies of the 18F-FDG kinetics on angiogenesis-related gene expression. Again, we used the key word search for the identification of the angiogenesis-associated genes. The pairwise correlation analysis was applied to the 120 selected genes using a significance level of P < 0.05. The number of significant correlations was different for each PET parameter; for example, 11 significant correlations were noted for k1. For further regression analysis, only the most significant correlations were used. The analysis revealed a correlation for k1 and VEGF-A with r = 0.51 (P < 0.016), followed by the FD and angiopoietin-2 with r = 0.48 (P < 0.03). k3 was correlated with VEGF-B with r = −0.46 (P < 0.03) and angiopoietin-like 4 with r = 0.42 (P < 0.05). A correlation coefficient of r = 0.42 was noted for the influx of 18F-FDG and the expression of angiopoietin-2 (P < 0.05).
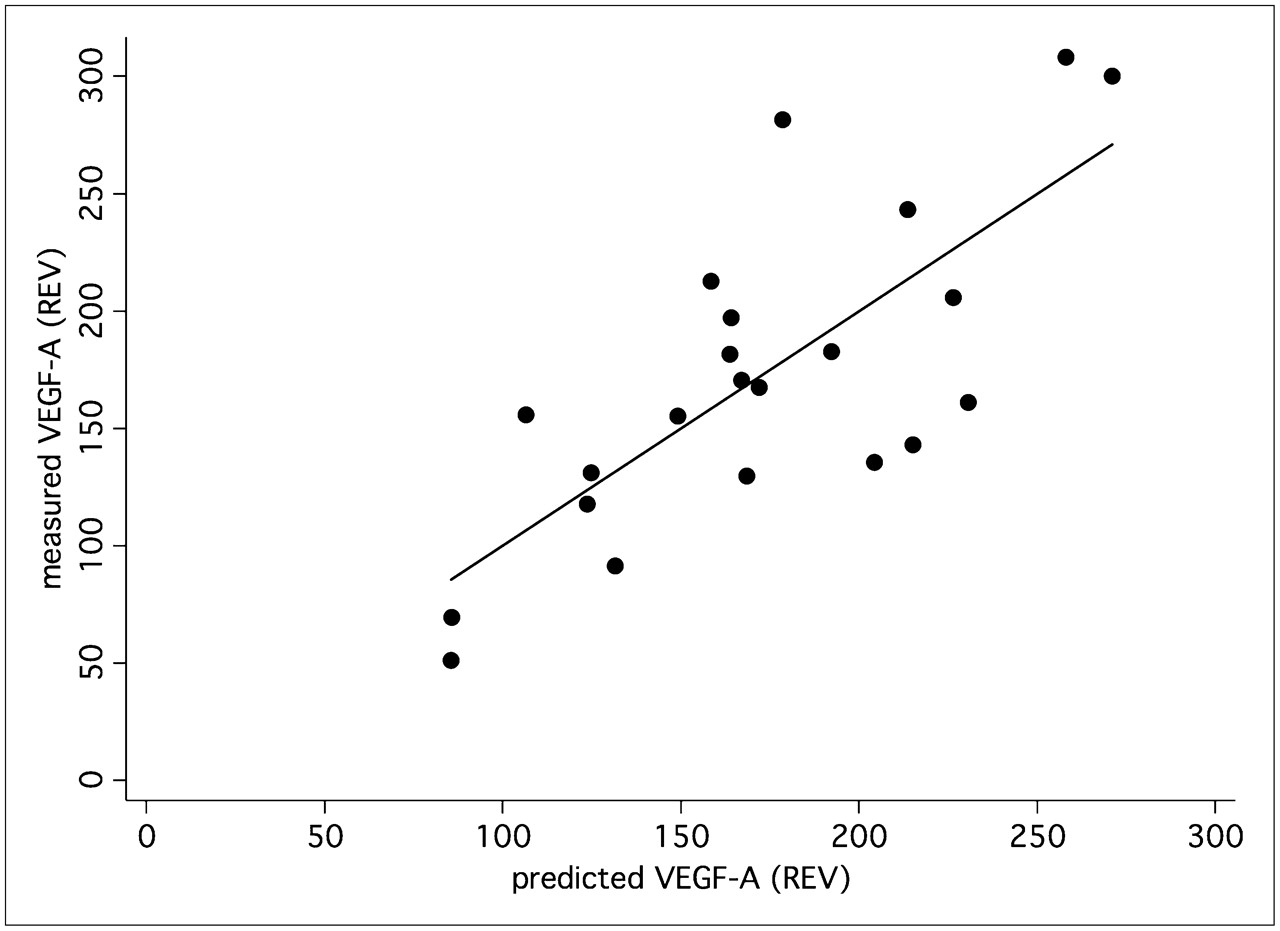
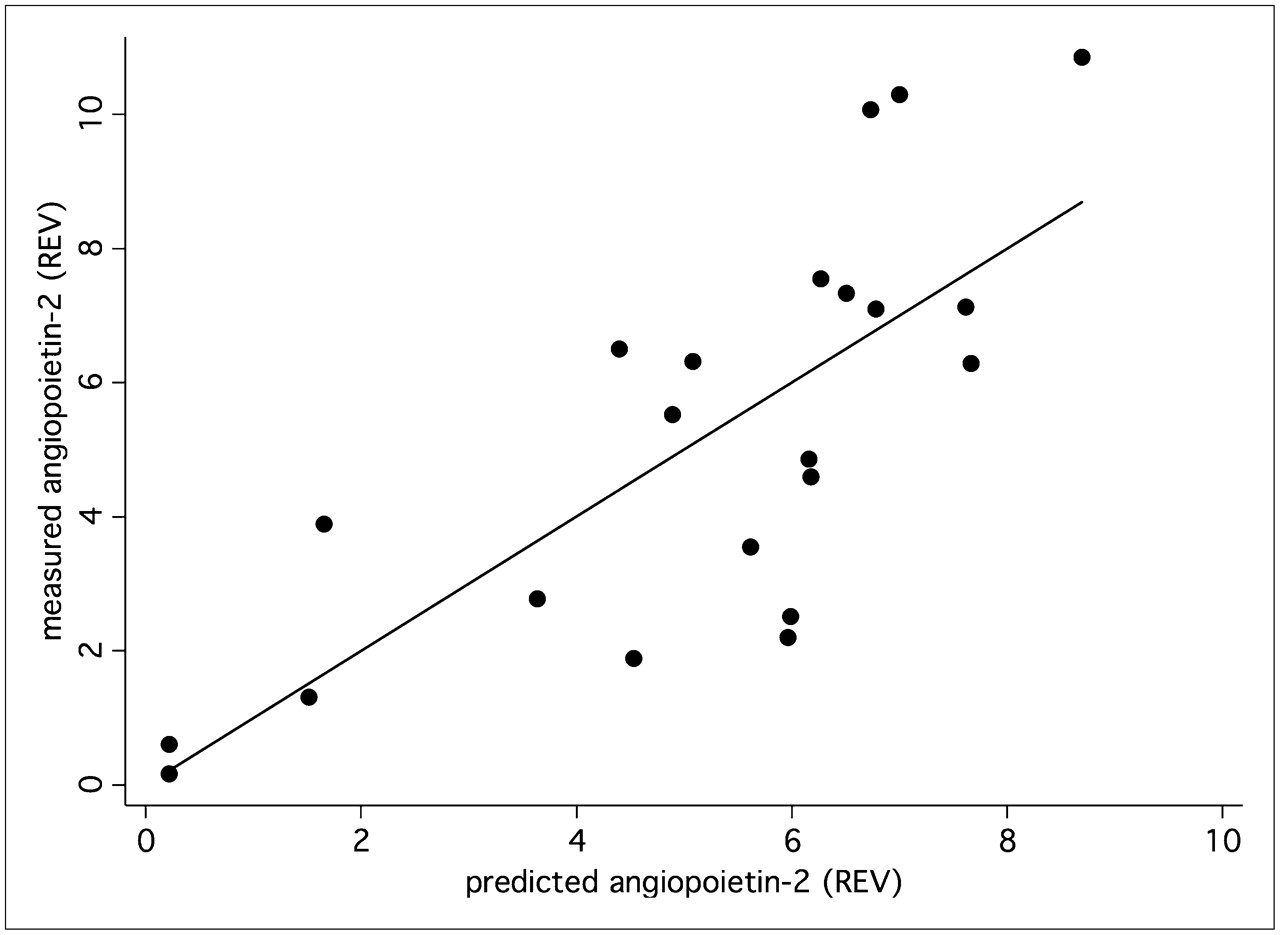
A multiple linear correlation and regression analysis was applied to the data to quantify the overall association between the individual, patient-based kinetic PET parameters of the tumors and individual expression of angiogenesis-related genes. We noted a significant multiple correlation coefficient for the PET parameters (FD, VB, k1–k4, SUV) and VEGF-A (r = 0.75, P < 0.05) (Fig. 4) as well as for angiopoietin-2 (r = 0.76, P < 0.05) (Fig. 5). The regression functions calculated for VEGF-A and angiopoietin-2 facilitate the prediction of gene expression from the quantitative PET parameters. The squares of the correlation coefficients reflect the amount of variance, which is explained by the correlation. Thus, on the basis of these multiple correlation coefficients, angiogenesis-related gene expression contributes to 57% (VEGF-A) and 58% (angiopoietin-2) of the total variance of the kinetic 18F-FDG data.

VEGF-A (Affymetrix no. 210512_s_at) expression was predicted using PET parameters—FD, VB, k1–k4, and SUV—and compared with measured VEGF-A expression in tumor specimen. Correlation of 0.75 (P < 0.05) was obtained. REV = relative expression value.

Expression of angiopoietin-2 (Affymetrix no. 211148_s_at) was predicted using PET parameters—FD, VB, k1–k4, and SUV—and compared with measured angiopoietin-2 expression in tumor specimen. Correlation of 0.76 (P < 0.05) was obtained. REV = relative expression value.
DISCUSSION
Angiogenesis is one of the major reasons for tumor progression. The formation of new vessels is essential for tumors; therefore, the development of angiogenic characteristics is a major step for the tumor growth. The progression from adenoma to carcinoma was evaluated by Staton et al. (9). The relationship among tissue factor, VEGF, and the onset of angiogenesis was assessed in 210 tissue specimens. The authors noted that based on their results, the angiogenic switch occurred at the onset of tissue dysplasia in a polyp (9). Korsisaari et al. investigated whether tumor growth in Apc+min mice was mediated by VEGF-A–dependent angiogenesis (10). The authors inhibited VEGF-A, and they were able to show that inhibition resulted in increased survival (10). Several studies were performed relating angiogenesis and therapy outcome in patients. Ohta et al. assessed the dependency of patients with stage I non–small-cell lung cancer on VEGF-A and VEGF-C (11). The 10-y survival rate was lowest for patients with an increased expression of both angiogenesis-related genes. The data demonstrate that angiogenesis-related genes play a major role in the progression of tumors. Therefore, it would be helpful to predict angiogenesis in individual patients noninvasively to optimize treatment.
Angiogenesis determines the vessel density of a tumor, but it also affects the glucose transporters. The enhancement of glucose transport is the result of the modulation of the glucose transporter expression by several other genes. Lidgren et al. found a significant correlation of HIF-1α and GLUT-1 expression in patients with renal cell carcinomas (12). The experimental studies of Burgman et al. of MCF7 cells also demonstrated a hypoxia-induced increase of 18F-FDG uptake (13). The dependency of VEGF and GLUT-3 on hypoxia-inducible factor-1 was demonstrated by Maxwell et al., who used a hepatoma model to demonstrate that hypoxia-inducible factor-1 was modulating both VEGF and GLUT-3 (14). The results demonstrated hierarchical dependencies of glucose transporter expression on angiogenesis and hypoxia. Comparable results for VEGF and glucose transporters were obtained by Pedersen et al. (2). The authors used 2 human small-cell lung cancer cell lines and noted during hypoxia a significant upregulation of VEGF, GLUT-1, and GLUT-3 (2). The data demonstrate that VEGF has a significant impact on the glucose transporters. Therefore, it is also likely that the 18F-FDG kinetics are dependent on VEGF activity.
The existing literature suggests a correlation of VEGF expression and 18F-FDG kinetics. Dynamic PET studies provide detailed information about the kinetics of the tracer. The 18F-FDG uptake and trapping can be accurately assessed using a 2-tissue-compartment model and dynamic PET data. We noted a significant correlation for k1 of the compartment model, which reflects the transport of 18F-FDG into the cells, and the VEGF-A expression, as measured by a gene-array technique (Fig. 3). No correlation was observed for k1 and VEGF-B, -C, and -D. A regression function was calculated to predict the VEGF-A and angiopoietin-2 expression in the colorectal tumors (Figs. 4 and 5) using all parameters of the 2-tissue model. The correlation between the PET parameters and the gene-expression data provides the possibility to noninvasively predict the expression of these angiogenesis-related genes in patients with primary colorectal carcinomas on the basis of dynamic PET data. The multiple correlation or regression analysis revealed that 57%–58% of the total variance of the kinetic 18F-FDG data is explained by the angiogenesis-related gene expression. The residual variance includes all other possible factors modulating the 18F-FDG kinetics, for example, proliferation and apoptosis. Further studies are needed to assess the quantitative impact of these biologic parameters on the 18F-FDG kinetics.
Angiogenesis is a complex process, and many genes are involved in this step. Gene arrays are helpful in assessing the expression of a large group of genes. The GenePET software provides the possibility to select subgroups of genes on the basis of a key word search within the description of the genes. We were able to identify 23 angiogenesis-related genes with a tumor–to–normal-tissue ratio exceeding 1.50 (Table 2). The highest ratio, 8.37, was noted for angiopoietin-2. Angiopoietin-2 is of major importance for the vascularization in human colorectal adenocarcinoma (15). Wang et al. examined tissue specimens from colorectal tumors and normal colon tissue in 45 patients and reported on a correlation of tumor size and vascularization with angiopoietin-2 and VEGF. Angiopoietin-1 and angiopoietin-2 are both ligands for the endothelium-specific tyrosine kinase receptor Tie-2 and are important for the formation of new vessels (15). Ahmad et al. evaluated the effects of angiopoietin-1 and -2 in a transfected human colon cancer cell line (HT29) with cDNA constructs for angiopoietin-1 and angiopoietin-2 and found that imbalances between angiopoietin-1 and angiopoietin-2 with a higher overall expression of angiopoietin-2 resulted in enhanced angiogenesis and tumor growth (16). We noted a significant correlation of angiopoietin-2 and the FD as calculated from the dynamic PET data. The FD reflects the more chaotic or deterministic distribution of the 18F-FDG kinetics, which may explain the association with a parameter such as angiopoietin-2, which has an impact on the formation of new vessels. Again, the combination of PET parameters facilitates the prediction of the angiopoietin-2 expression from the PET data of primary colorectal carcinomas (Fig. 5).
The prognostic significance of both angiopoietin-2 and VEGF was assessed by Vidal et al. in patients with gastric cancer (17). The authors noted an impact of both genes, with VEGF as the primary prognostic factor. The literature data demonstrate that information about the angiogenesis in tumors may help to achieve better prognostic data. The regression functions found for VEGF-A and angiopoietin-2 provide the possibility to predict the grade of angiogenesis in colorectal tumors noninvasively on the basis of dynamic PET examinations. These data may help to individualize treatment in patients with colorectal tumors. Further studies are needed in other tumors to assess the dependency of 18F-FDG kinetics on angiogenesis.
k3 revealed a negative correlation with VEGF-B and a positive correlation with angiopoietin-like 4. Galaup et al. evaluated the effect of angiopoietin-like 4 in an animal model and noted that this gene prevented metastases by inhibition of vascular permeability, tumor motility, and invasiveness (18). Therefore, the correlation analysis revealed diverging effects: k1, which reflects 18F-FDG transport, is positively correlated with angiogenesis, whereas k3, which is associated with the intracellular phosphorylation of 18F-FDG, is a measure of an antiangiogenic effect. These different correlations explain why the global 18F-FDG uptake, as measured by the SUV alone, does not correlate with angiogenesis-related gene expression. Compartment analysis is needed to obtain quantitative data for 18F-FDG transport and phosphorylation, which can then be used to predict the angiogenic effect in a primary colorectal tumor using the multiple-regression functions.
How can the results be used for clinical purpose? Currently, we are evaluating 2 methods to predict angiogenesis in primary colorectal tumors. First, on the basis of the correlation and regression analysis, we are using the dynamic PET data and the regression functions (PET parameters, Figs. 4 and 5) to predict the expression of VEGF-A and angiopoietin-2 to provide quantitative data for the angiogenesis in these tumors. Second, to simplify the evaluation technique, we are using the data from Figure 3 and a cutoff for k1 (cutoff value, 0.441) to classify primary colorectal tumors into those with low and high VEGF-A expression. The ongoing study is focused on the comparison of both methods of the PET-based prediction of angiogenesis gene expression with the recurrent free survival as well as the overall survival to validate the results.
CONCLUSION
18F-FDG kinetics are modulated by the expression of angiogenesis-related genes. Primarily, VEGF-A is directly correlated with the 18F-FDG transport (r = 0.51) and angiopoietin-2 with the FD of the 18F-FDG kinetics (r = 0.48). The 18F-FDG kinetic parameters, as obtained by compartment and noncompartment analysis, can be used to predict the expression of VEGF-A (r = 0.75) and angiopoietin-2 (r = 0.76). Overall, about 57%–58% of the total variance of the 18F-FDG kinetic data can be explained by the impact of angiogenesis-related genes. The results demonstrate that angiogenesis is a determining parameter for the 18F-FDG kinetics in primary colorectal tumors.
Footnotes
-
COPYRIGHT © 2008 by the Society of Nuclear Medicine, Inc.
References
- Received for publication February 9, 2008.
- Accepted for publication May 6, 2008.


Jump to section
Related Articles
Cited By...
- Additional Clinical Value for PET/MRI in Oncology: Moving Beyond Simple Diagnosis
- Reply: Comment on: "Tumor Aggressiveness and Patient Outcome in Cancer of the Pancreas Assessed by Dynamic 18F-FDG PET/CT"
- 18F-FDG Uptake in Lung, Breast, and Colon Cancers: Molecular Biology Correlates and Disease Characterization
- Fibronectin Stimulates Endothelial Cell 18F-FDG Uptake Through Focal Adhesion Kinase-Mediated Phosphatidylinositol 3-Kinase/Akt Signaling