


Abstract
18F-FDG kinetics were evaluated by use of compartment and noncompartment models of giant cell tumors. The kinetic data were compared with the gene expression data for a subgroup of patients. Methods: Nineteen patients with giant cell tumors were examined with PET and 18F-FDG, and tracer kinetics were assessed quantitatively. A 2-compartment model, including the transport constants k1–k4 as well as the vascular fraction (VB) for 18F-FDG, was used for evaluation of the data. A noncompartment model was used to calculate the fractal dimension of the 18F-FDG time–activity curve to assess the heterogeneity of the tracer kinetics. Furthermore, tumor specimens obtained from 5 patients were assessed with gene chip technology (U95A), and these data were compared with the quantitative 18F-FDG data. Results: The giant cell tumors showed generally enhanced 18F-FDG uptake 1 h after tracer application, with a mean 18F-FDG standardized uptake value (SUV) of 4.8 (range, 1.8–9.4). Quantitative evaluation of tracer kinetics showed a preferential increase for 18F-FDG transport, with a mean k1 of 0.340. The vascular fraction accounted for 35% of the tumor volume and was high compared with those for other tumors, such as soft-tissue sarcomas. 18F-FDG kinetics were heterogeneous, with a fractal dimension of 1.3. Gene chip analysis showed that the expression of 137 genes (1.1%) exceeded the median expression value of the reference gene, β2-microglobulin. The highest expression was observed for the gene for the small, leucine-rich proteoglycan I (biglycan), which is important for bone cell differentiation and proliferative activity. Correlation analysis revealed an association of 18F-FDG data with the expression of several genes. Mainly genes related to angiogenesis were associated with the compartment parameters. The SUV at 56–60 min was correlated with the expression of vascular endothelial growth factor A (angiogenesis) and cell division cycle 2 protein (proliferation). Conclusion: Despite their classification as benign tumors, giant cell tumors have generally enhanced 18F-FDG uptake, mainly attributable to an enhanced vascular fraction and increased 18F-FDG transport. A comparison of gene chip data and 18F-FDG kinetic data showed a close association of quantitative 18F-FDG results and the expression of genes related to angiogenesis.
Giant cell tumors are usually classified as benign lesions; however, the tumors frequently show local recurrence in up to 50% of patients. Furthermore, lung metastases may occur. The clinical presentation of the tumor is variable, and the progression of disease is difficult to predict. Tubbs et al. reported that benign giant cell tumor of the bone was diagnosed in about 475 patients (1). The authors noted that 13 patients had lung metastases. The overall mortality rate attributable to giant cell tumor was 23%.
The differential diagnosis includes osteosarcoma and metastatic carcinoma with giant cell tumor as well as benign diseases, such as nonossifying fibroma and benign fibrous histiocytoma. Giant cell tumors of the spinal region are especially difficult to differentiate from other lesions. Tubbs et al. emphasized that the metastases noted in their study also had no distinguishing radiologic features (1).
Some studies have been performed to assess the role of gene expression in giant cell tumors. Tian et al. examined the expression of ADAM12, a member of the disintegrin and metalloprotease family, in 20 giant cell tumors and found that ADAM12 is involved in the fusion process for mononuclear stromal cells in giant cell tumors (2). Roux et al. evaluated the receptor activator of nuclear factor κB and noted that the expression of the gene may have a role in the pathogenesis of giant cell tumors (3).
The roles of vascular endothelial growth factor (VEGF) and matrix metalloproteinase 9 in the extent of bone destruction and the likelihood of local tumor recurrence were evaluated by Kumta et al. for patients with bone tumors, including 14 patients with giant cell tumors (4). The authors emphasized that recurrent tumors showed higher expression of VEGF and matrix metalloproteinase 9. One limitation of some published studies is that the evaluations were usually confined to a few genes. This problem can be solved by the use of gene chip technology, which allows the assessment of a large number of genes simultaneously. Dimitrakopoulou-Strauss et al. reported preliminary results obtained with gene chip analysis for tumor patients and demonstrated a correlation of cyclin A and VEGF-C with 18F-FDG uptake (5). Furthermore, a correlation among glucose transporters, oncogenes, and genes related to multidrug resistance was observed (6).
The purpose of this study was to assess 18F-FDG kinetics in giant cell tumors and to compare 18F-FDG kinetic data with data from a gene chip analysis of tumor specimens obtained by surgery shortly after a PET study. The major aims were to obtain quantitative data about 18F-FDG kinetics in these tumors and to compare 18F-FDG kinetics with gene expression.
MATERIALS AND METHODS
In this study, we evaluated 19 patients with histologically confirmed giant cell tumors. Seventeen patients had primary tumors, and 2 patients had recurrent lesions. Furthermore, 18 tumors were located in the extremities, and 1 patient had a primary lesion of the thoracic spine at vertebral body T-12. All patients were referred for PET before surgery for tumor diagnostics and staging.
Dynamic PET studies were performed for 60 min after the intravenous application of 300–370 MBq of 18F-FDG by use of a 23-frame protocol (10 frames of 1 min, 5 frames of 2 min, and 8 frames of 5 min). A dedicated PET system (ECAT EXACT HR+; Siemens Co.) with an axial field of view of 15.3 cm, operated with septa extended (2-dimensional mode), was used for the PET examinations. The system allows the simultaneous acquisition of 63 transverse slices with a theoretical slice thickness of 2.4 mm. Transmission scans were obtained for a total of 10 min before radiotracer application for attenuation correction of the acquired emission tomographic data. All PET images were attenuation corrected, and an image matrix of 256 × 256 pixels was used for iterative image reconstruction. The reconstructed cross-sectional images were converted to standardized uptake value (SUV) images by use of the formula SUV = tissue concentration (Bq/g)/(injected dose [Bq]/body weight [g]) (7).
Dynamic PET data were evaluated by use of the software package PMod (provided through cooperation with the University of Zurich) (8,9). Visual analysis was performed by evaluating the metabolically active areas on transaxial, coronal, and sagittal images. Time–activity curves were created by use of volumes of interest (VOIs). Generally, a VOI consists of several regions of interest (ROIs) over the target area. Irregular ROIs were drawn manually. To compensate for possible patient motion during the acquisition time, the original ROIs were visually repositioned but were not redrawn.
Quantitative evaluation of tracer kinetics requires compartment modeling. A 2-tissue compartment model is the generally accepted standard model for the quantification of dynamic 18F-FDG examinations (10,11). One problem with patient studies is accurate measurement of the input function, which theoretically requires arterial blood sampling. However, the input function can be retrieved from the image data with good accuracy (12). For the input function, the mean value of the VOI data obtained from a large arterial vessel was used. A vessel VOI consisted of at least 7 ROIs in sequential PET images. The recovery coefficient was 0.85 for a diameter of 8 mm and for the system described above. For lesions located in the arms or in the spine, a VOI over the aorta was used to obtain input data. For lesions located in the legs, partial volume correction was applied when a small vessel had to be used to retrieve the input data. Noise in the input curve has an effect on parameter estimates. Therefore, we used a preprocessing tool that is available in the PMod software and that allows a fit of the input curve by summing up to 3 decaying exponential functions to reduce noise.
The constants k1–k4 (18F-FDG transport into cells, 18F-FDG transport out of cells, phosphorylation of intracellular 18F-FDG, and dephosphorylation of intracellular 18F-FDG, respectively) were calculated by use of a 2-compartment model implemented in the PMod software, taking into account the vascular fraction (VB) in a VOI as an additional variable. Details about the applied compartment model are described by Burger and Buck (8). One advantage of the PMod software is the graphical interface, which allows interactive configuration of the kinetic model by the user as well as the application of some preprocessing steps, for example, setting up initial values and limits for the fit parameters. Visual evaluation of each plot was performed to check the quality of the fit. Each model curve was compared with the corresponding time–activity curve, and the total χ2 difference was used as the cost function, where the criterion was to minimize the summed squares (χ2) of the differences between the measured curve and the model curve (χ2 was usually less than 1). This means that the squared residual values (measured value minus estimated value) are multiplied by weights. In theory, the weight should be related to the SE of a measurement. The distribution at each individual point is taken to be gaussian, with an SD to be specified. The residual covariance was dependent on the kinetic parameter and typically was less than 10% for k1. The model parameters were accepted when k1–k4 were less than 1 and the VB values exceeded 0. The unit for rate constants k1–k4 is 1 min−1, whereas VB reflects the fraction of blood within the evaluated volume.
Besides compartment analysis, we applied a noncompartment model to the kinetic data to obtain the fractal dimension. The software module applies the box plot model to the kinetic data and calculates the fractal dimension of the time–activity curve. The fractal dimension values vary from 0 to 2 and are parameters for a deterministic or more chaotic distribution of tracer activity over time. No input function is needed for the fractal dimension model. Besides the kinetic analysis, the SUV in the last frame, 56–60 min after tracer injection, was used for statistical evaluation.
Surgery was performed shortly after the PET examination, and tumor specimens were obtained from 5 patients. The surgeons were aware of the PET results and removed a specimen from the target area already evaluated with PET. The tumor tissue was transported in liquid nitrogen, and total RNA was extracted for further processing by gene chip analysis. RNA extraction was done by use of an RNeasy kit (Qiagen, Inc.). Thereafter, the quality of isolated RNA was evaluated photometrically by use of the ratio of the measurement at 280 nm to the measurement at 260 nm and on an agarose gel. We used a U95A gene chip (Affymetrix Inc.), which provides quantitative information about more than 12,000 gene sequences. RNA concentrations were measured spectrophotometrically at 260 nm. RNA probes were labeled according to the supplier’s instructions (Affymetrix) and hybridized as described by Teague et al. (13). Specifically, first-strand synthesis was performed by use of a T7.(dT)24 primer and SuperScript II/ribonuclease H− reverse transcriptase (Invitrogen GmbH) with a total RNA sample of 10 μg. Second-strand synthesis was performed by use of Escherichia coli DNA polymerase I, E. coli DNA ligase, and ribonuclease H. Fragment end polishing was performed by use of T4 polymerase. An in vitro transcription reaction was used to incorporate biotin-11-cytidine triphosphate and biotin-16-uridine triphosphate into the complementary RNA probe (bioarray high-yield RNA transcript labeling kit; Enzo), resulting in linear amplification of the double-stranded complementary DNA template. The fragmented complementary RNA was hybridized overnight (45°C) to HG U95Av2 arrays (Affymetrix). Washes were performed by use of GeneChip Fluidics Station 400 (Affymetrix) according to the manufacturer’s protocol. Staining was done with R-phycoerythrin-streptavidin (Molecular Probes; MoBiTec) and was followed by an antibody amplification procedure with a biotinylated antistreptavidin antibody (Vector Laboratories) and goat IgG (Sigma-Aldrich Chemie GmbH). Scanning (GeneArray Scanner 2500; Hewlett-Packard GmbH) was performed at a 3-μm resolution with 488-nm excitation and 570-nm emission wavelengths. Intensity values were scaled to a target intensity of 500 by use of MicroArray Suite 5.0 (Affymetrix) software. The scan data analysis was done by use of MicroDB 3.0 and Data Mining Tool 3.0 (Affymetrix); additionally, GeneMaths (Applied Maths BVBA) was used for cluster analysis later on.
Gene chip expression data were normalized to the expression of the β2-microglobulin gene (Affymetrix code 34644_at; Homo sapiens messenger RNA for β2-microglobulin) by use of the following formula: relative expression value = 1,000 × (expression value for a gene/expression value for the β2-microglobulin gene). Analyses of both PET data and gene chip data were performed by use of dedicated software programmed by our group by using Delphi 7 Studio (Borland Software Corp.). The program provides a correlation analysis of all gene expression data and corresponding PET data (SUV, VB, k1–k4, and fractal dimension).
Statistical evaluation of PET data was performed by using a Statistica software package (version 6.0; StatSoft Co.) on a personal computer (Pentium IV [Intel Corp.] 2.4-GHz processor and 1 GB of random-access memory) running with Windows XP Professional SP1 (Microsoft Co.). The program package was used to calculate the basic statistics for kinetic data. Furthermore, the program package was also used to perform regression analysis for PET data and individual gene expression data.
RESULTS
All 19 giant cell tumors showed significant 18F-FDG uptake in the late image, 56–60 min after tracer application. The mean 18F-FDG SUV was 4.8, with a range of 1.8–9.4 (Table 1). k1 was moderately increased, and vessel density (VB) was about 2 times higher than that noted for soft-tissue sarcomas (14). Furthermore, the fractal dimension was increased, with a mean value of 1.3, providing evidence for more chaotic 18F-FDG kinetics. The fractal dimension was higher for giant cell tumors than for soft-tissue sarcomas (14).
Basic Statistical Data for 18F-FDG PET Studies of 19 Giant Cell Tumors*
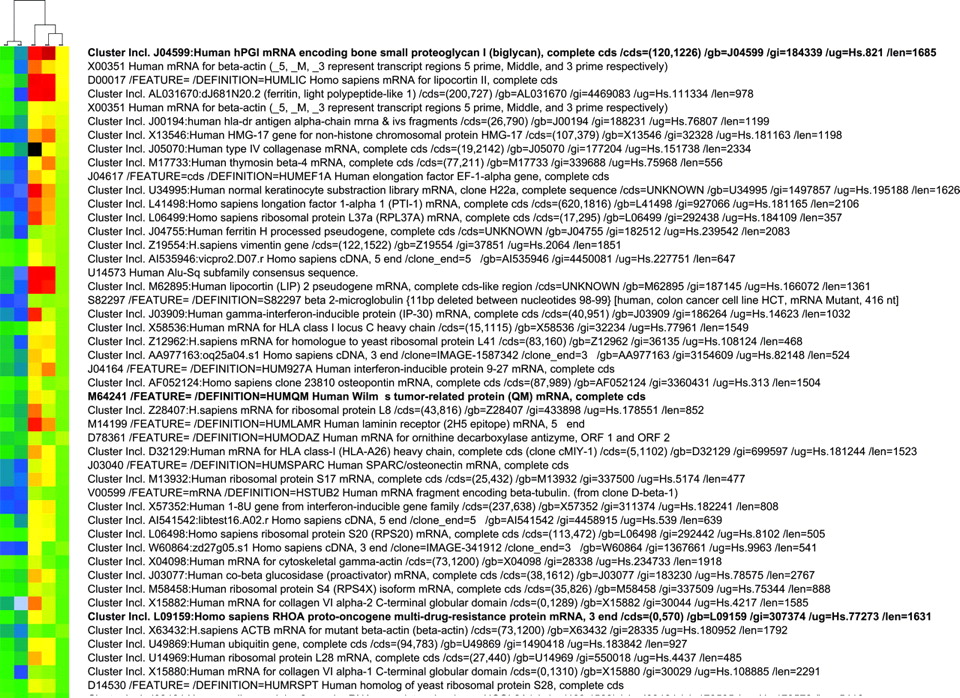
Quantitative data for about 12,626 genes were obtained per gene chip. On the basis of the median values for the gene expression data for 5 gene chips, the expression values for 137 genes (1.1%) exceeded the median expression value for the reference gene, β2-microglobulin. The gene chip data for the 5 giant cell tumors evaluated with both PET and gene chip analysis are presented in Figure 1. The expression values for the 5 giant cell tumors are sorted in descending order according to the median expression value for each gene. The highest expression was observed for the small, leucine-rich proteoglycan I (biglycan) (Fig. 1). Biglycan is usually expressed in the extracellular bone matrix and is important for bone cell differentiation and proliferative activity (15). Interestingly, among other highly expressed genes, we noted the gene for Wilms’ tumor-related protein (WT1) (Fig. 1). The WT1 gene is classified as a tumor suppressor gene and is usually observed in Wilms’ tumor, an embryonal malignancy of the kidney. The WT1 gene is also expressed in some other tissue structures, such as the testes, ovarian stromal cells, and mesothelial cells, and it is expressed in blasts of patients with acute leukemia (16). RhoA, a member of the Ras homology family of small guanosine triphosphatases, was also highly expressed in the tumors (Fig. 1). RhoA is primarily related to cytoskeletal regulation and is involved in tumorigenesis. Overexpression can be associated with tumor invasion (17,18).

Gene chip data for 5 giant cell tumors. Normalized expression values are presented in descending order. Data are sorted according to median gene expression values for 5 tumor specimens. Three of the genes with high expression values are shown in bold type (small proteoglycan I, Wilms’ tumor-related protein, and RhoA). Cluster analysis was applied to the data and revealed 2 subgroups, consisting of 2 tumors (left 2 columns) and 3 tumors (right 3 columns).
Correlation and regression analyses were performed to evaluate the association of PET parameters with gene expression. We focused primarily on genes related to angiogenesis and proliferation. The SUV at 56–60 min after 18F-FDG application was associated with both VEGF-A and cell division cycle 2 (Cdc2) protein expression (Fig. 2). VEGF-A, also known as vascular permeability factor, induces angiogenesis and endothelial cell proliferation. The Cdc2 gene encodes a protein kinase that interacts with cyclins and controls the cell cycle. VB, a parameter related to the exchange surface for 18F-FDG, was also correlated with angiogenesis and proliferation (Fig. 3). The kinetic parameter k3, related to 18F-FDG phosphorylation, was associated with soluble Fms-like tyrosine kinase (sFLT), the soluble fragment of the membrane-bound VEGF-A receptor (Fig. 4A). Furthermore, k3 showed an association with hypoxia-inducible factor HIF-1, which is involved in tumor growth (Fig. 4B). The fractal dimension for the 18F-FDG kinetic data showed a high correlation with VEGF-A (Fig. 5).
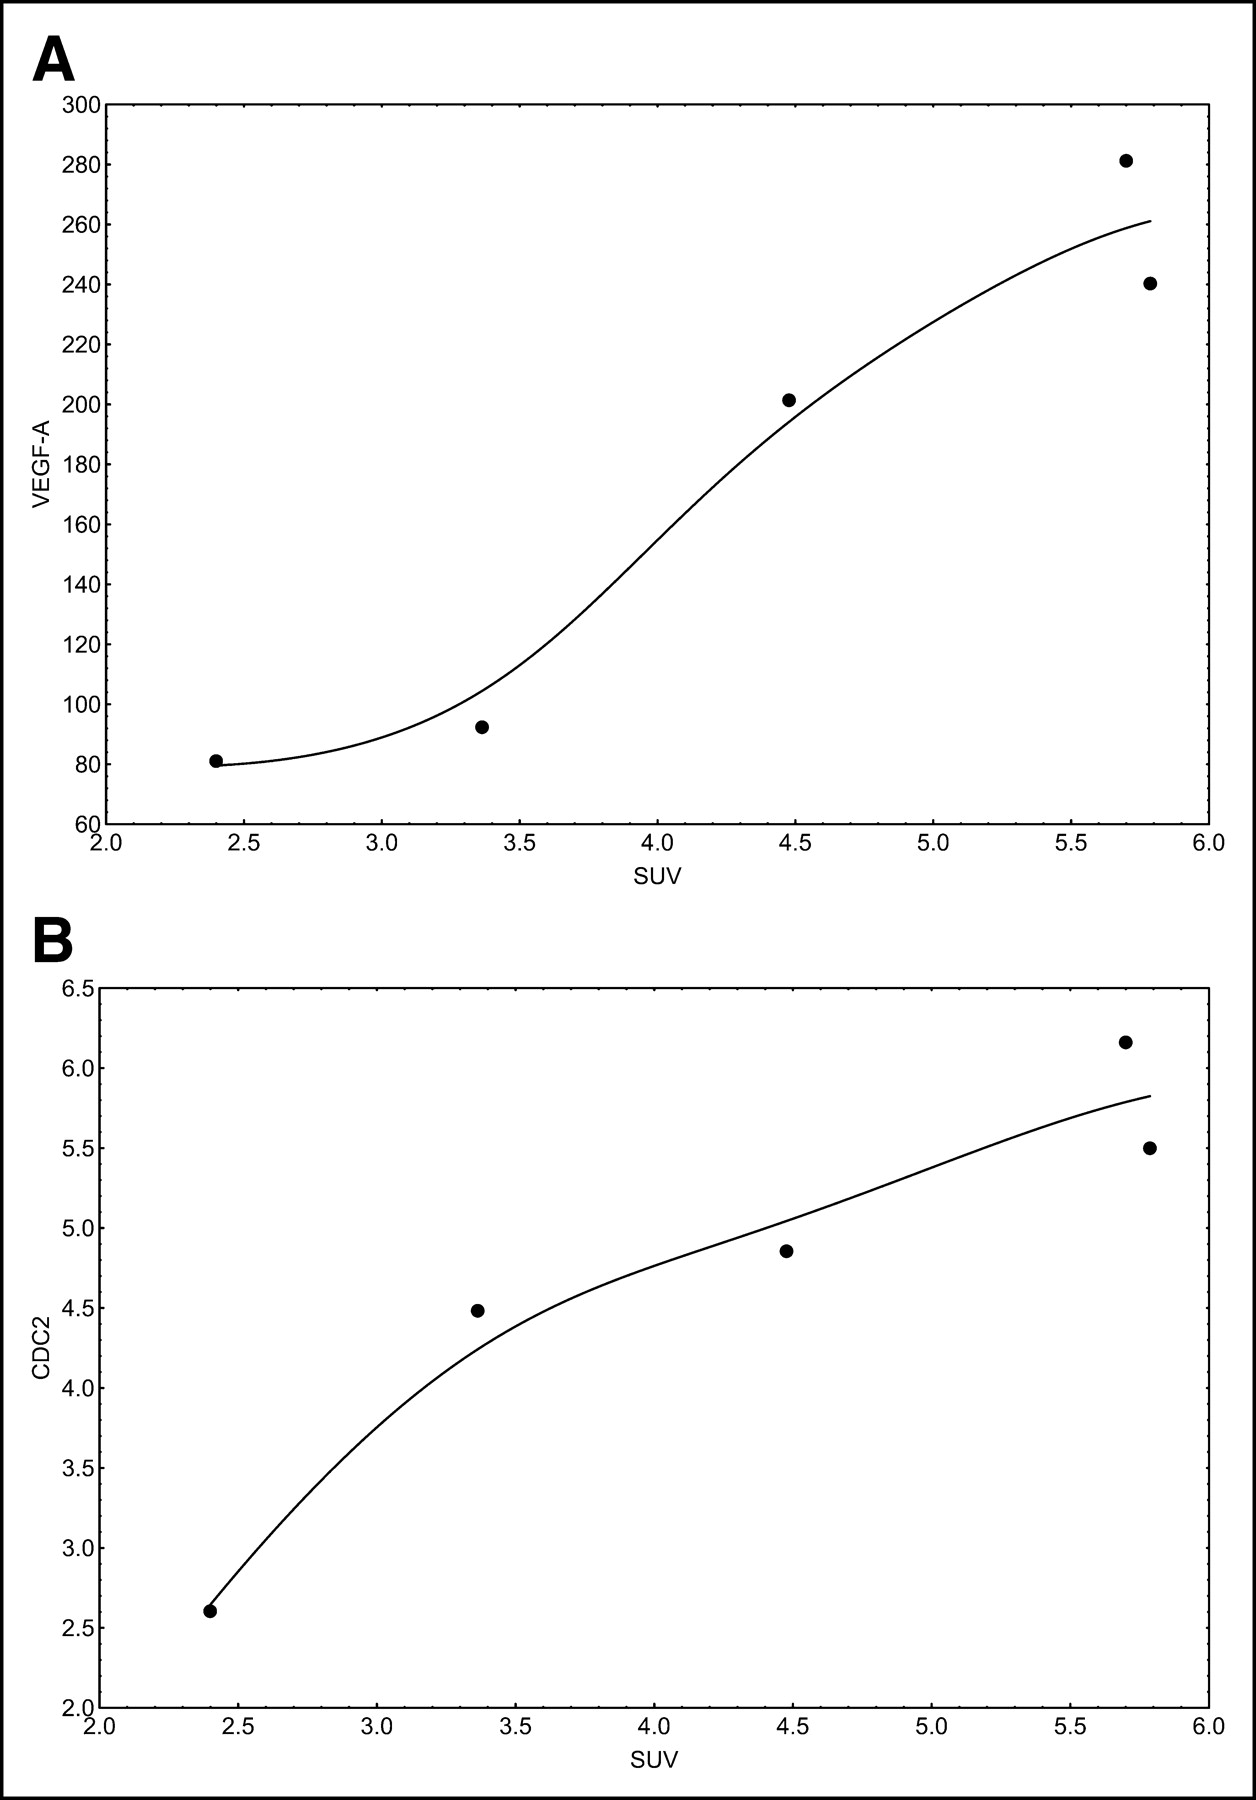
(A) Correlation of SUV with VEGF-A expression (r = 0.9618; P = 0.0089). (B) Correlation of SUV with Cdc2 expression (r = 0.9392; P = 0.0178).

(A) Correlation of vessel density (VB) with VEGF-B (r = 0.8716; P = 0.0541). (B) Correlation of vessel density (VB) with cyclin E (r = 0.9885; P = 0.0015).
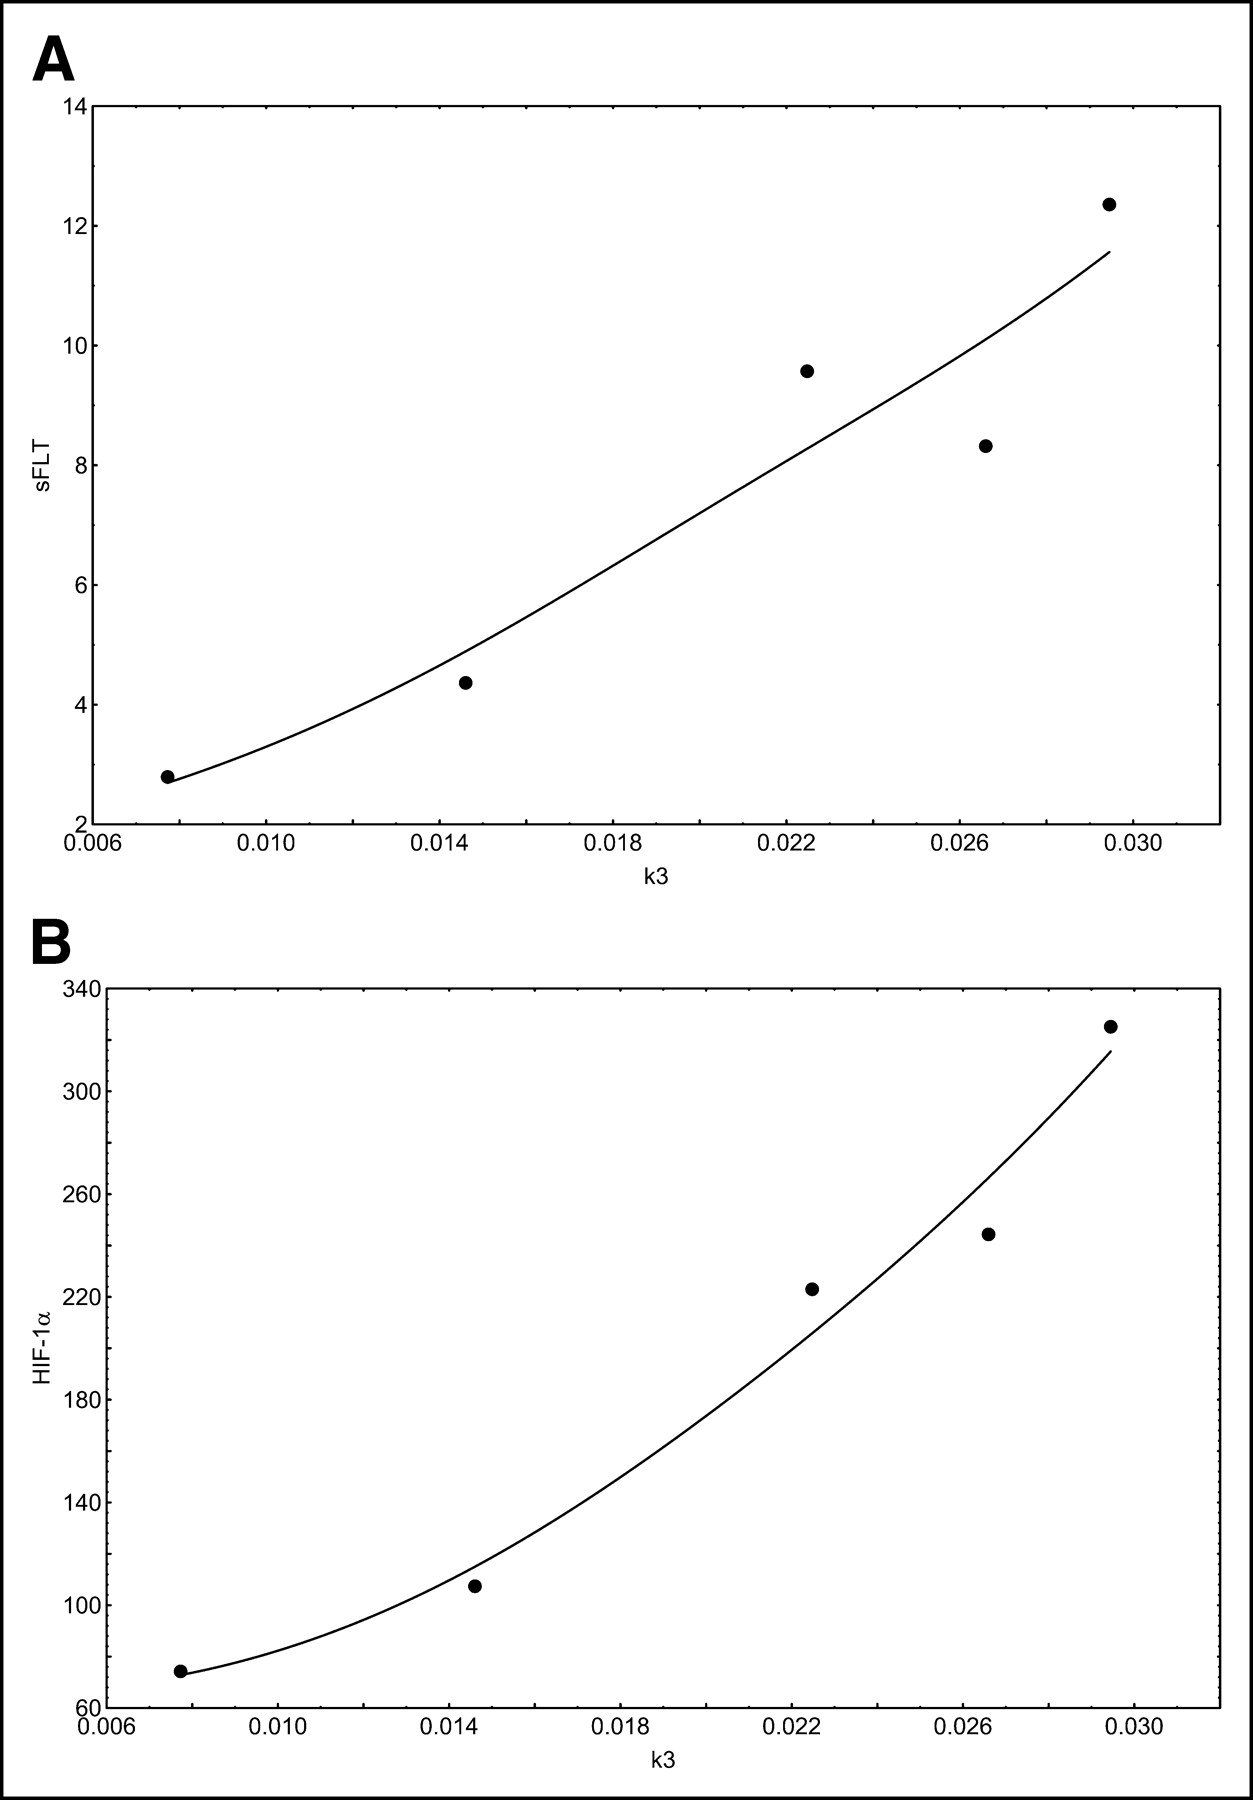
(A) Correlation of k3 with sFLT (r = 0.9444; P = 0.0156). (B) Correlation of k3 with HIF-1 (r = 0.9738; P = 0.0051).
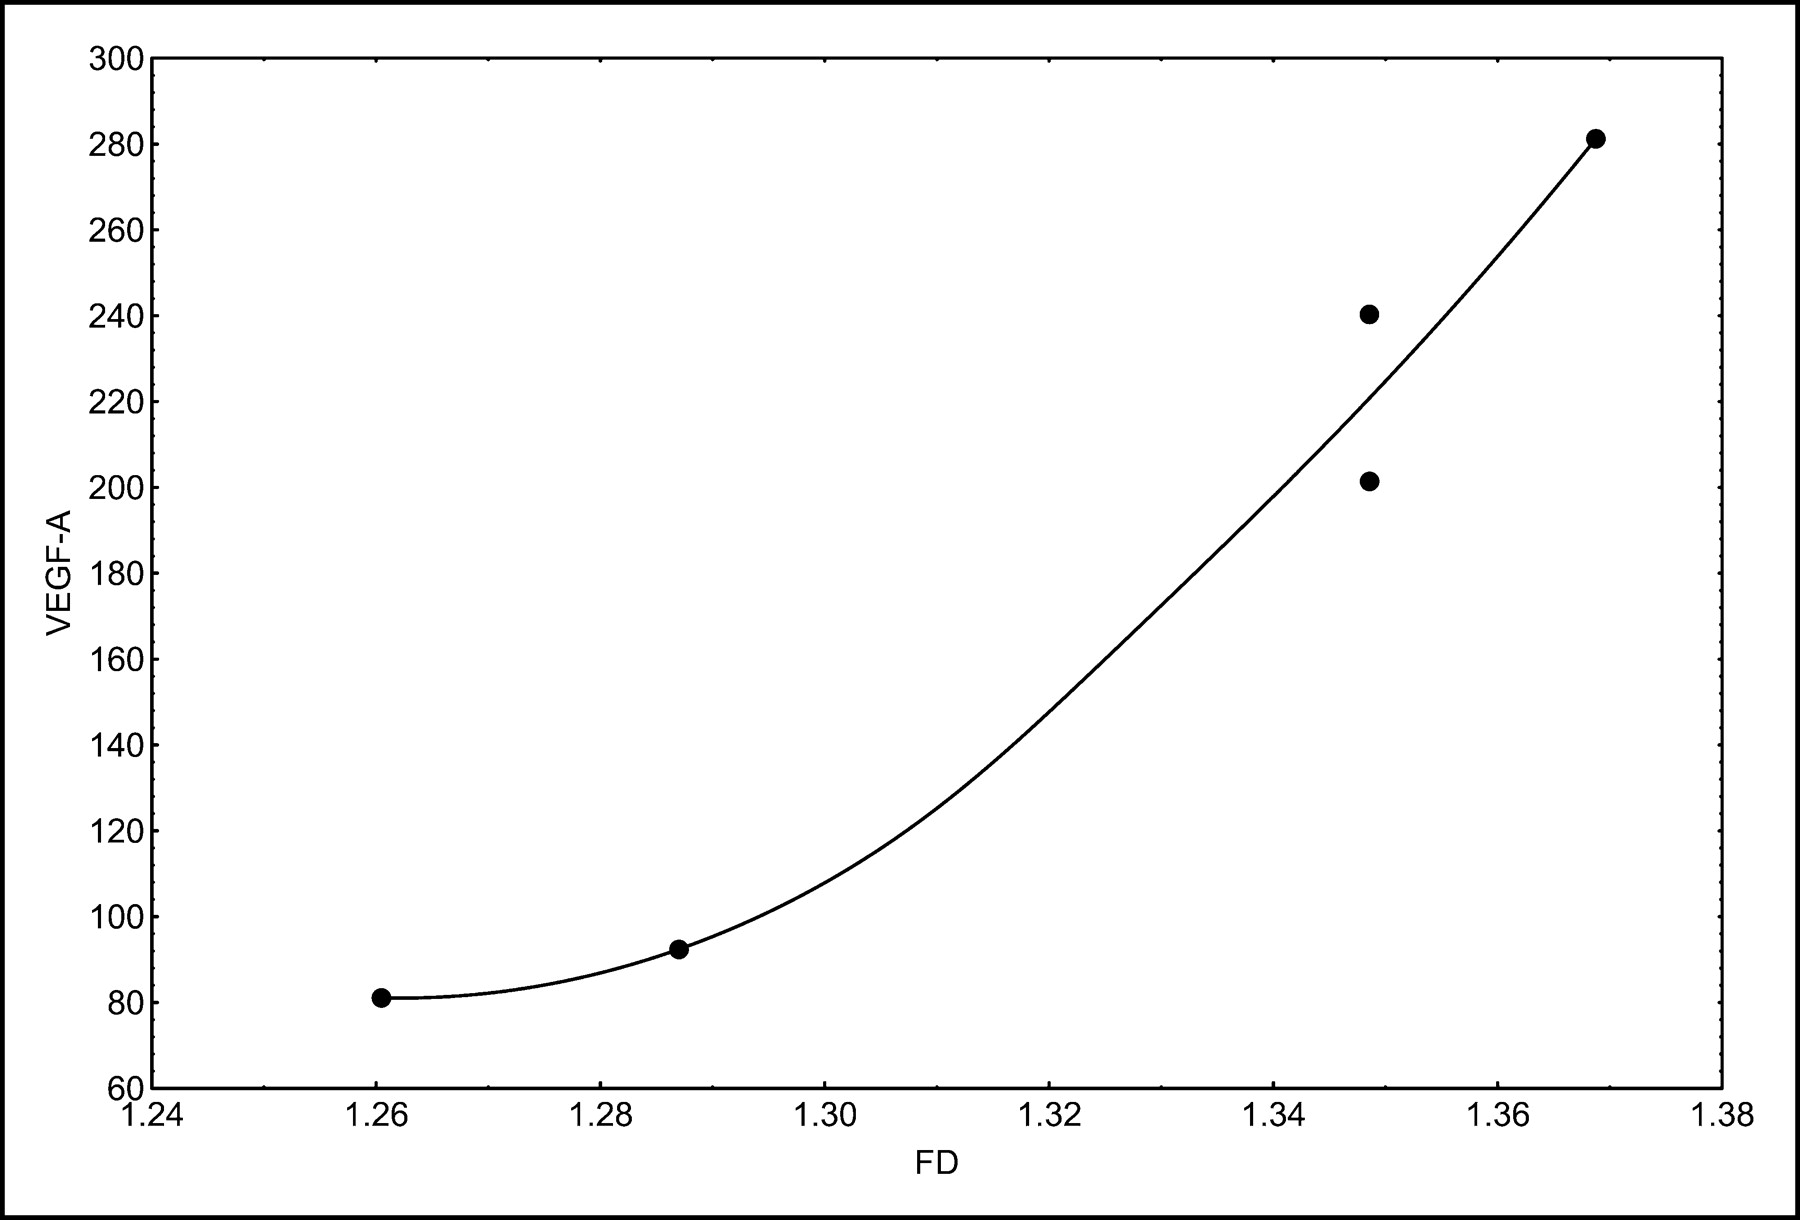
Correlation of fractal dimension (FD) with VEGF-A (r = 0.9707; P = 0.0060).
Overall, the kinetic data and the SUV were mainly correlated with genes related to angiogenesis and cell proliferation. Low tracer uptake was noted for tumors with low VEGF-A expression (Fig. 6). Cluster analysis (complete linkage with Euclidian distances) of the 5 gene chips revealed 2 subgroups (Fig. 1). The group comprising 2 tumors showed lower expression of several genes than did the group comprising the other 3 tumors. One of the 2 tumors with lower expression was a recurrent giant cell tumor.

Comparison of 2 giant cell tumors with low 18F-FDG uptake and high 18F-FDG uptake. Both images are scaled to the same range (SUV, 0–5.8). (Upper image) Giant cell tumor of right tibia with an 18F-FDG SUV of 2.4. The relative expression value for VEGF-A was 81. (Lower image) Giant cell tumor of left tibia with an 18F-FDG SUV of 5.8. The relative expression value for VEGF-A was 240.
DISCUSSION
Giant cell tumors are usually classified as benign tumors but may cause problems because of local recurrence. Furthermore, metastases may occur. Whether to classify giant cell tumors as low-grade sarcomas is still being debated. The primary diagnosis of giant cell tumors is usually based on radiologic examinations and can be done with high accuracy for giant cell tumors of the long bones. Jelinek et al. evaluated 110 tumors assessed by image-guided biopsy and reported an accuracy of 88% (19). One of 16 giant cell tumors was missed in that study. However, the approach is invasive and may cause problems with some malignant tumors.
In addition to radiographic examinations, PET with 18F-FDG may be helpful for gaining diagnostic information by assessing tumor metabolism. However, only limited information is available about the use of 18F-FDG for giant cell tumors. Kern et al. was one of the first groups to describe the uptake of 18F-FDG in a cystic giant cell tumor of the femur (20). The authors evaluated 5 patients with bone and soft-tissue tumors and noted for giant cell tumors a glucose utilization rate comparable to that of neurofibromas and lower than that of grade I liposarcomas. Dimitrakopoulou-Strauss et al. evaluated patients with soft-tissue sarcomas and reported a median SUV of 0.7, with a range of 0.3–2.2, for 10 patients with grade I liposarcomas (21). We noted a median SUV of 4.6 for the 19 giant cell tumors that we studied; this SUV is significantly higher than that found by those authors for grade I liposarcomas. Interestingly, the median value for k1 was 1.8 times higher in our study than the k1 reported for soft-tissue sarcomas; this result indicates significantly higher 18F-FDG transport in giant cell tumors than in sarcomas. In a study of 37 malignant bone tumors, Wu et al. reported a median SUV of 3.1 (range, 0.446–12.290), which is more comparable to our data for giant cell tumors (22). Aoki et al. evaluated the SUV for 52 primary benign and malignant bone tumors, including 5 giant cell tumors; they reported a mean SUV of 4.6, which is in excellent agreement with our finding of a mean SUV of 4.8 (23). However, those authors performed only SUV measurements, and no kinetic data were provided. According to our experience with the assessment of 18F-FDG kinetics in malignant tumors, mainly VB and k1 contribute to 18F-FDG uptake in giant cell tumors.
Several studies have been performed to evaluate gene coexpression. Ito et al. evaluated the coexpression of GLUT-1 and matrix metalloproteinase 2 (MMP-2) in 8 human cancer cell lines and 80 human cancer specimens (24). They concluded that MMP-2 expression and cell invasiveness are associated with GLUT-1 expression in human cancer cell lines. Interestingly, only 45 human tumor specimens (56%) showed the coexpression of GLUT-1 and MMP-2, while 19 expressed neither GLUT-1 nor MMP-2. However, with regard to an expected coexpression fraction of only 56%, we would not assume a high correlation for GLUT-1 and MMP-2. Indeed, in a review of our gene chip data, we noted a correlation of only 0.36 for GLUT-1 and MMP-2; this value was not significant. However, we noted a high, significant correlation of 0.93 between MMP-2 expression and the vascular fraction (VB) calculated from the PET kinetic data. This result suggests a link between the VB and MMP-2 activity.
Angiogenesis and glucose transport as well as the role of hypoxia have been studied by several authors. Pedersen et al. assessed 18F-FDG uptake as well as the expression of glucose transporters and VEGF in 2 small-cell lung cancer cell lines (25). They noted a significant upregulation of VEGF-A and GLUT-1 mRNAs as well as GLUT-1 and GLUT-3 proteins during hypoxia. 18F-FDG uptake changed according to the GLUT-1 protein level. Burke et al. evaluated the change in gene expression during hypoxia in human macrophages (26). They used macrophages and a complementary DNA array and found that the mRNA levels were upregulated for several genes, including those for GLUT-1, VEGF-A, matrix metalloproteinase 7, neuromedin B receptor, and the DNA-binding protein inhibitor Id2 (26). The data suggest that 1 parameter, such as hypoxia in tumors, may have an impact on a group of genes, resulting in different effects on the biologic properties of a tumor lesion.
Overall, the literature results provided evidence for a linkage of glucose metabolism, glucose transporter expression, angiogenesis-related gene expression, and hypoxia. The results that we obtained for the 5 giant cell tumors that we studied demonstrated that 18F-FDG uptake, as measured by SUV, was correlated with VEGF-A expression. Furthermore, the fractal dimension for the 18F-FDG kinetic data also was associated with VEGF-A expression, and a very high correlation coefficient was noted for these parameters (r = 0.9707). The correlation of VEGF-A and GLUT-1 was 0.83, which was significant at a P value of <0.1. However, our results showed that the vascular fraction (VB) was correlated with both VEGF-A (r = 0.86; P < 0.1 [significant]) and VEGF-B (r = 0.87; P < 0.1 [significant]) but not with VEGF-C. These results are in agreement with the functions of VEGF-A and VEGF-B, which are related to the formation of new vessels, whereas VEGF-C is mainly related to the lymphatic spread of tumors. The data suggest that VEGF-A and VEGF-B have a major impact on 18F-FDG kinetics and that gene expression levels may be classified on the basis of SUV, VB, and fractal dimension, obtained by quantitative analysis of 18F-FDG kinetics, as predictor variables.
Interestingly, sFLT-1, which binds to VEGF-A and acts as a VEGF-A antagonist, was correlated with k3 (Fig. 4A), possibly because sFLT-1 and VEGF-A may show simultaneous enhancement of gene expression in tumor cells. This finding was reported by Inoue et al. for human hematopoietic cell lines (27). They noted that 16 of 17 cell lines showing enhanced expression of sFLT-1 also showed enhanced expression of VEGF-A. Therefore, the overall effect on tumor angiogenesis is dependent on the impact of all of the parameters. Interestingly, k3 was also associated with HIF-1. HIF-1 expression is usually enhanced in cells with hypoxia and is one of the reasons for increased expression of VEGF-A. HIF-1 is known to be linked to the expression of glucose transporters. Our data also show that k3 is dependent on parameters linked to angiogenesis.
Prognostic parameters are generally important for improving therapy management in patients with tumor lesions. Takahashi et al. evaluated VEGF-A expression in gastrointestinal stromal tumors of the stomach and showed that it was an indicator of a poor prognosis (28). Several studies have been performed with giant cell tumors to detect parameters relevant for prognosis. Zheng et al. evaluated giant cell tumors and noted that 3 major isoforms were present in the tumors (29). We noted the highest median values for the expression of VEGF-A splice variant 189 and VEGF-A, whereas VEGF-B expression was 5-fold lower and VEGF-C expression was only 6% of VEGF-A expression. Zheng et al. were able to show that VEGF-A expression was correlated with clinical stage (29). Therefore, the overexpression of VEGF-A is likely to be associated with a more advanced tumor stage. On the basis of the previously discussed correlation of VEGF-A and VEGF-B with 18F-FDG kinetic data, the quantitative evaluation of PET 18F-FDG kinetics can help to detect tumors with a higher likelihood of an advanced stage.
Microvessel counting is used as an indicator of a poor prognosis for several tumor types (30). However, the number of microvessels alone may not be directly associated with VEGF-A expression or a poor prognosis. Marion-Audibert et al. assessed microvascular density in endocrine tumors of the pancreas and noted a significant difference in the survival curves, with an association of shorter survival and lower vessel density (31). Furthermore, no close correlation was observed between vascular density and VEGF-A expression for this tumor type. Those authors concluded that on the basis of their data, other factors may be involved in the regulation of tumor-associated angiogenesis. Sulh et al. evaluated the proliferative index and the vascular density for 7 nonrecurrent and 13 recurrent giant cell tumors (32). They noted no significant difference in the mean values for the groups and concluded that neither parameter is helpful for predicting tumor recurrence. However, the data from Sulh et al. showed that the SDs for both groups were high; therefore, the lack of significance may have been related to the high variability of the parameters in both groups.
Besides VEGF-A, VEGF-B also binds to the receptor VEGFR1, also known as Flt-1 (33). Silvestre et al. evaluated VEGF-B and emphasized that VEGF-B promotes angiogenesis in association with the activation of Akt and eNOS-related pathways (34). We noted a significant correlation of the vascular fraction, as measured by VB, with VEGF-B expression (Fig. 3A). Although the median expression of VEGF-B (relative expression value, 44.5) was lower than that of VEGF-A (relative expression value, 220.5) for the 5 giant cell tumors that we studied, the median expression of VEGF-B splice variant 186 (relative expression value, 339.9) exceeded even that of VEGF-A. The data indicate a major role of both VEGF-A and VEGF-B in angiogenesis for these tumors.
CONCLUSION
Despite their classification as benign tumors, giant cell tumors have generally enhanced 18F-FDG uptake, mainly attributable to an enhanced vascular fraction and increased 18F-FDG transport. A comparison of gene chip data and 18F-FDG kinetic data showed a close association of quantitative 18F-FDG results and the expression of genes related to angiogenesis.
Footnotes
Received Jan. 21, 2004; revision accepted Mar. 10, 2004.
For correspondence or reprints contact: Ludwig G. Strauss, MD, Medical PET Group-Biological Imaging (E0601), Clinical Cooperation Unit Nuclear Medicine, German Cancer Research Center, Im Neuenheimer Feld 280, D-69120 Heidelberg, Germany.
E-mail: lgs{at}ads-lgs.com
REFERENCES
In this issue


Jump to section
Related Articles
Cited By...
- Metabolic Subtyping of Pheochromocytoma and Paraganglioma by 18F-FDG Pharmacokinetics Using Dynamic PET/CT Scanning
- Giant Cell Tumor of Bone
- The Biology of Small Leucine-rich Proteoglycans in Bone Pathophysiology
- 18F-FDG PET of Locally Invasive Breast Cancer and Association of Estrogen Receptor Status with Standardized Uptake Value: Microarray and Immunohistochemical Analysis
- Is the Physical Decay Correction of the 18F-FDG Input Function in Dynamic PET Imaging Justified?
- The Effect of Renal Failure on 18F-FDG Uptake: A Theoretic Assessment
- Impact of Angiogenesis-Related Gene Expression on the Tracer Kinetics of 18F-FDG in Colorectal Tumors
- Comparison of Integrin {alpha}v 3 Expression and Glucose Metabolism in Primary and Metastatic Lesions in Cancer Patients: A PET Study Using 18F-Galacto-RGD and 18F-FDG
- 68Ga-Labeled Bombesin Studies in Patients with Gastrointestinal Stromal Tumors: Comparison with 18F-FDG