


Abstract
The aim of this study was to determine the spatial correlation of O-(2-18F-fluoroethyl)-l-tyrosine (18F-FET) uptake and the concentrations of choline (Cho), creatine (Cr), and total N-acetylaspartate (tNAA) determined with proton magnetic resonance spectroscopic imaging (1H MRSI) in cerebral gliomas for the multimodal evaluation of metabolic changes. Methods: 18F-FET PET and 2-dimensional 1H MRSI were performed in 15 patients with cerebral gliomas of World Health Organization (WHO) grades II–IV. PET and 1H MRSI datasets were coregistered by use of mutual information. On the basis of their levels of 18F-FET uptake, 4 different areas in a tumor (maximum, strong, moderate, and low 18F-FET uptake) were defined on PET slices as being congruent with the volume of interest in the 1H MRSI experiment. 18F-FET uptake in lesions was evaluated as tumor-to-brain ratios. Metabolite concentrations for Cho, Cr, and tNAA and Cho/tNAA ratios were computed for these 4 areas in the tumor and for the contralateral normal brain. Results: In the area with maximum 18F-FET uptake, the concentration of tNAA (R = −0.588) and the Cho/tNAA ratio (R = 0.945) correlated significantly with 18F-FET uptake. In the areas with strong and moderate 18F-FET uptake, only the Cho/tNAA ratios (R = 0.811 and R = 0.531, respectively) were significantly associated with amino acid transport. At low 18F-FET uptake, analysis of the correlations of amino acid uptake and metabolite concentrations yielded a significant result only for the concentration of Cr (R = 0.626). No correlation was found for metabolite concentrations determined with 1H MRSI and 18F-FET uptake in normal brain tissue. Maximum 18F-FET uptake and the tNAA concentration were significantly different between gliomas of WHO grades II and IV, with P values of 0.032 and 0.016, respectively. Conclusion: High 18F-FET uptake, which is indicative of tumor cell infiltration, associates with neuronal cell loss (tNAA) and changes in ratios between parameters representing membrane proliferation and those of neuronal loss (Cho/tNAA ratio), which can be measured by 1H MRSI. The significant correlation coefficients detected for Cr in regions with low 18F-FET uptake suggests an association between the mechanism governing amino acid transport and energy metabolism in areas that are infiltrated by tumor cells to a lesser extent. These findings motivate further research directed at investigating the potential of 1H MRSI to define tumor boundaries in a manner analogous to that of amino acid PET.
In clinical practice, CT and MRI are the methods of choice for the detection and diagnosis of brain tumors. However, the main limiting factor of these imaging methods is the lack of metabolic information on pathologic changes, which is in fact attributable to their imaging principles: assessment of differences in absorption coefficients in the case of CT and variations in density and derived parameters (e.g., relaxation times) of water and fat protons in the case of MRI. Hence, it is often difficult to assess the entire extent of the pathology in brain tumors by CT or MRI, even after the application of contrast medium.
PET is currently the most powerful method of molecular imaging. PET with 18F-FDG is well accepted and widely used in the grading of brain tumors. However, the low tumor-to-background contrast, attributable to the high glucose uptake of the normal cortex, makes the delineation of the extent of these lesions difficult. Furthermore, the uptake of 18F-FDG by tumor cells is not specific for neoplastic tissue; it has been observed in infections or inflammations as well (1–3). To overcome these limitations, radiolabeled amino acids such as [methyl-11C]-l-methionine and amino acid analogs such as O-(2-18F-fluoroethyl)-l-tyrosine (18F-FET) have been developed. It has been demonstrated that amino acids appear to be more specific tumor imaging agents because amino acid transport and protein metabolism are significantly upregulated in brain tumors in comparison with normal brain tissue and inflammatory sites (4–6). 18F-FET is not incorporated into proteins, and the underlying mechanisms of 18F-FET uptake in vivo are still not fully clarified and are still under discussion (7).
Proton magnetic resonance spectroscopic imaging (1H MRSI) is another method of metabolic imaging that allows for investigation of the spatial distribution of metabolites in normal tissue and pathologic changes. Although in vivo 1H MRSI is not able to quantify tumor-specific metabolites, it can detect specific patterns in the changes in metabolite concentrations compared with those in normal brain tissue. Gliomas are characterized by an increased level of choline-containing compounds (Cho) and a reduction in the signal intensity of N-acetylaspartate (NAA) (8). These changes correlate well with tumor cell infiltration in solid tumors and correlate somewhat in the infiltration zone of gliomas (9). The 1H MRSI signal of Cho is composed of choline, phosphocholine, phosphatidylcholine, and glycerophosphocholine. Cho is a marker for increased cell membrane proliferation or higher cellular density (10). NAA is regarded as a neuronal marker mainly contained within neurons, where it is involved as an osmolyte in the fluid balance of the brain and in the synthesis of, for example, myelin and N-acetylaspartylglutamate (NAAG) (11). Because NAA is quite difficult to resolve from NAAG with in vivo 1H MRSI, it is common practice to determine the concentrations of NAA and NAAG as total NAA (tNAA). The creatine (Cr) peak originates from both creatine and phosphocreatine, which play a role in tissue energy metabolism (12).
Both metabolic imaging techniques provide insight into metabolic changes related to pathologic processes. The purpose of this study was to correlate the metabolic changes in gliomas investigated by these 2 different metabolic imaging methods, that is, 18F-FET PET and 1H MRSI, to provide sophisticated information about pathologic changes in metabolism for areas with variable extents of tumor infiltration. 18F-FET PET and 1H MRSI datasets were coregistered with an anatomic 3-dimensional (3D) MRI dataset, allowing for the direct correlation of changes in amino acid uptake and changes in membrane, energy, and neuronal metabolism.
MATERIALS AND METHODS
Patient Population
Fifteen patients (9 men; mean ± SD age, 45 ± 16 y; age range, 23–78 y) with cerebral gliomas were included in this study. Four patients had gliomas of World Health Organization (WHO) grade II, 5 patients had gliomas of WHO grade III, 1 patient had gliomatosis cerebri, and 5 patients had glioblastoma multiforme (GBM) of WHO grade IV (Table 1). All lesions were confirmed histopathologically with tissue samples obtained by a frameless stereotactic procedure after preoperative diagnosis with conventional MRI, 1H MRSI, and 18F-FET PET. For cases with congruence in the areas with maximum 18F-FET uptake and maximum changes in Cho/tNAA ratios of more than 50%, biopsies were obtained from the area of overlap. For cases with an overlap of less than 50%, biopsies were obtained from the area with maximum 18F-FET uptake.
Clinical Data for 15 Patients
The datasets of the 1H MRSI and PET experiments were acquired within 2 wk and retrospectively correlated. PET was performed as part of the routine preoperative diagnostic workup of gliomas at our institution. The ethics committee of the Department of Neurosurgery, Erlangen, gave its approval for the MR experiments.
MRI and 1H MRSI
The MR examinations were performed on a 1.5-T clinical whole-body scanner (Sonata; Siemens) equipped with the standard head coil. The conventional MRI protocol consisted of an axial turbo spin-echo sequence (T2 weighted; 5-mm section thickness; repetition time [TR]/echo time [TE] = 5,600–6,490/98 ms), an axial fluid-attenuated inversion recovery sequence (5-mm section thickness; TR/TE = 10,000/103 ms), and a pre- and postgadolinium contrast-enhanced anatomic 3D magnetization-prepared rapid acquisition gradient-echo (MPRAGE) sequence (1-mm isotropic voxels; 160 slices; TR/TE = 2,020/4.38 ms).
An axial spin-echo (SE) sequence (T1 weighted; TR/TE = 500/15 ms; matrix size, 256 × 256; field of view, 16 × 16 cm; 20 slices with no gap; slice thickness, 2 mm) was used for planning the 1H MRSI experiment and for the coregistration of spectroscopic data with anatomic MRI data (13). For preselection of the volume of interest for the 1H MRSI experiment, a point-resolved spectroscopy (PRESS) sequence scheme was used. The volume of interest was aligned parallel to the axial T1-weighted SE slices and positioned to exclude lipids of the skull and subcutaneous fat. Water suppression was achieved with 3 chemical shift–selective pulses before the PRESS excitation. The 1H MRSI parameters were as follows: TR/TE = 1,600/135 ms; 24 × 24 circular phase encoding scheme across a field of view of 16 × 16 cm; slice thickness, 1 cm; 50% Hamming filter; and 2 excitations. The total spectroscopic data acquisition time was less than 13 min. The nominal voxel size was 0.67 × 0.67 × 1.0 cm3 (∼0.45-cm3 resolution). After zero filling to a matrix size of 32 × 32, the volume of a voxel relevant for postprocessing was 0.25 cm3.
The user-independent spectral fit program LCModel (Linear Combination of Model, version 6.1-4A) (s-provencher.com) (14) was used for the quantitative evaluation of 1H MRSI data. The spectra were analyzed on a workstation (IBM Lenovo) as a linear combination of a set of reference basis spectra for PRESS and a TE of 135 ms. For calibration of the LCModel program and for determination of the metabolite concentrations for Cho, Cr, and tNAA, we used the phantom replacement technique (9,15). Voxel positions in the lesions and in contralateral apparently normal brain tissue were selected. Spectral fits were performed in an analysis window of 1.0–3.85 ppm. Spectra with a signal-to-noise ratio of less than 2 and a full width at half maximum of greater than 0.075 ppm were not included. All molar metabolite concentrations were corrected for relaxation time effects with T1 and T2 times from the literature (16).
Radiosynthesis of 18F-FET and 18F-FET PET Data Acquisition
Starting from 18F-fluoride that was produced by the 18O(p,n)18F reaction on 18O-enriched water (95%) with an 11-MeV proton beam generated by an RDS 111 cyclotron (PET Net GmbH), 18F-FET was synthesized via 18F-fluoroalkylation of the disodium salt of l-tyrosine by 18F-fluoroethyltosylate, in accordance with the procedure of Wester et al. (17). The 2-step procedure was performed by use of an automated synthesis module consisting of a Simatic S7-200 device (Siemens) and ProTool/Pro software (Siemens). 18F-FET was obtained as an intravenously injectable phosphate-buffered saline solution (pH 5.5) (490 ± 320 [mean ± SD] MBq/mL) containing tyrosine at 9–57 μg/mL. The non–decay-corrected radiochemical yield was about 18% at a molar radioactivity of greater than 150 GBq/μmol, and the radiochemical purity was at least 97%.
18F-FET PET scans from the brain were performed 10 min after the intravenous injection of 18F-FET at 7 MBq/kg of body weight. A partial-ring PET scanner (ECAT EMERGE; Siemens) equipped with lutetium oxyorthosilicate detectors was used. The technical performance of this machine was described recently (18). The measured attenuation correction scan time of transmission was 7 min. Emission data were acquired over 24 min (4 frames over 6 min). The ECAT EMERGE scanner allows data acquisition in the 3D mode only. Emission data corrected for randoms, dead time, and attenuation were reconstructed with an iterative reconstruction algorithm (ordered-subset expectation maximization; 4 iterations, 8 subsets). The number of projections and views was 192, the matrix size was 128 × 128 in plane, the voxel side length was 0.515 cm, the reconstructed image resolution was approximately 6.5 mm, the zoom was 2.57, and the slice thickness was 3.4 mm.
Coregistration of 1H MRSI and 18F-FET PET Data
For the coregistration of 18F-FET PET and 1H MRSI data, both datasets were previously coregistered with an anatomic 3D MRI dataset (MPRAGE). For this purpose, the 1H MRSI data were evaluated as metabolic maps of Cho and tNAA by use of the freely available reconstruction program csx (version for Linux; Kennedy Krieger Institute). The peak areas for Cho and tNAA were calculated by integration over frequency ranges of 3.34–3.14 and 2.22–1.82 ppm, respectively. Smooth linear interpolation to a matrix size of 256 × 256 resulted in metabolic maps. Cho and tNAA images were used to calculate a map of Cho/tNAA ratios. Segmentation of the tumor on the basis of the metabolic changes related to the lesion on the Cho/tNAA ratio map was performed by a method described previously (19). A Cho/tNAA ratio map is particularly suited for delineation of brain tumors because it uses both the increase in Cho levels and the decrease in tNAA levels in lesions, resulting in enhanced contrast. Furthermore, in normal brain parenchyma, Cho/tNAA ratios show a gaussian distribution and are quite constant (19).
A so-called MRI/MRSI hybrid dataset, which consisted of anatomic MR images (T1-weighted SE sequence) and metabolic maps from the 1H MRSI data, was generated. Both the MRI/MRSI hybrid dataset and the 18F-FET PET data were transferred to a workstation (IBM Lenovo) for coregistration by use of the graphic image analysis tool VINCI (Volume Imaging in Neurologic Research; Max-Planck-Institute for Neurologic Research) (20). Coregistration of the 18F-FET PET data (Fig. 1A) and the 1H MRSI data (Fig. 1B) with the 3D MPRAGE dataset was achieved by use of a rigid registration algorithm. The fused dataset consisted of anatomic MR images, PET images, and metabolic maps from 1H MRSI and allowed for the direct correlation of 18F-FET uptake with metabolic concentrations for Cho, Cr, and tNAA and Cho/tNAA ratios (Fig. 1C).
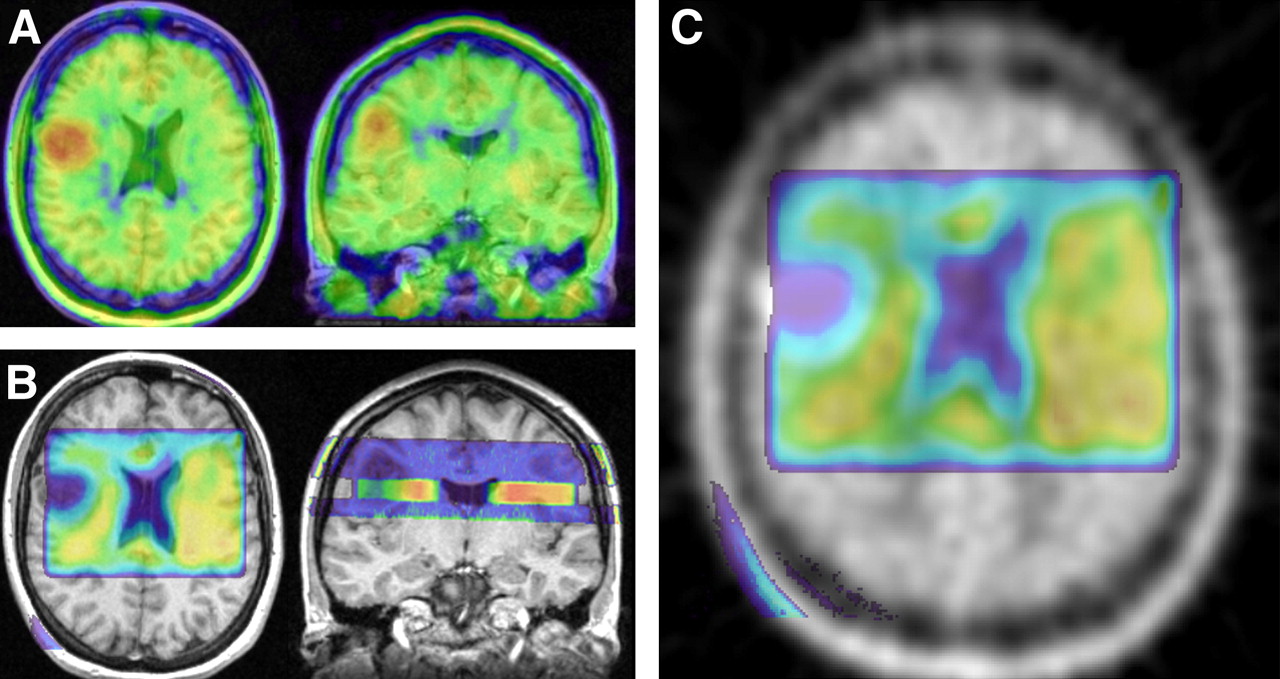
Procedure for coregistering 18F-FET PET and 1H MRSI data for patient 3. (A) Axial and coronal images of fused 18F-FET PET and anatomic MRI dataset, obtained by coregistration of color-coded PET dataset (color code: red = maximum 18F-FET uptake and blue = minimum 18F-FET uptake) with 3D MPRAGE dataset. (B) Axial and sagittal images of fused 1H MRSI data (evaluated as tNAA metabolic map) and anatomic MRI data, obtained by coregistration of color-coded MRI/MRSI hybrid dataset (color code: red = maximum tNAA concentration and blue = minimum tNAA concentration) with 3D MPRAGE dataset. (Sagittal image shows MRI/MRSI hybrid dataset consisting of anatomic information in blue above and below tNAA metabolic map.) (C) Axial image of coregistered 18F-FET PET dataset (gray scale) and tNAA metabolic map (color coded) calculated from 1H MRSI dataset.
Regions of interest (ROIs) were manually defined on PET images to segment lesions into 4 different areas according to 18F-FET uptake and in the contralateral normal brain (CNB). These areas were defined as follows: maximum 18F-FET uptake, which was defined as the area with the maximum uptake of 18F-FET in the lesion under study; strong 18F-FET uptake, which was defined as the area with 18F-FET uptake of less than the maximum but ≥75% of the maximum; moderate 18F-FET uptake, which was defined as the area with 18F-FET uptake of less than 75% but ≥50% of the maximum; and low 18F-FET uptake, which was defined as the area with 18F-FET uptake of less than 50% but ≥25% of the maximum (Fig. 2A). No defined area included any part of another defined area. The area with strong 18F-FET uptake, for example, did not include the area with maximum 18F-FET uptake. The area with maximum 18F-FET uptake was selected as a target for the stereotactic biopsy. A minimum volume of 1 cm3 was required as a target volume for the stereotactic procedure. In addition, this approach minimized partial-volume effects between 18F-FET PET and 1H MRSI, which were acquired at different spatial resolutions. The mean 18F-FET uptake values were calculated for these ROIs in the tumor and for the ROI in the CNB and used for the calculation of tumor-to-brain ratios (TBR) of 18F-FET uptake. The ROI in the CNB was equal in size to the sum of all 4 tumor ROIs.

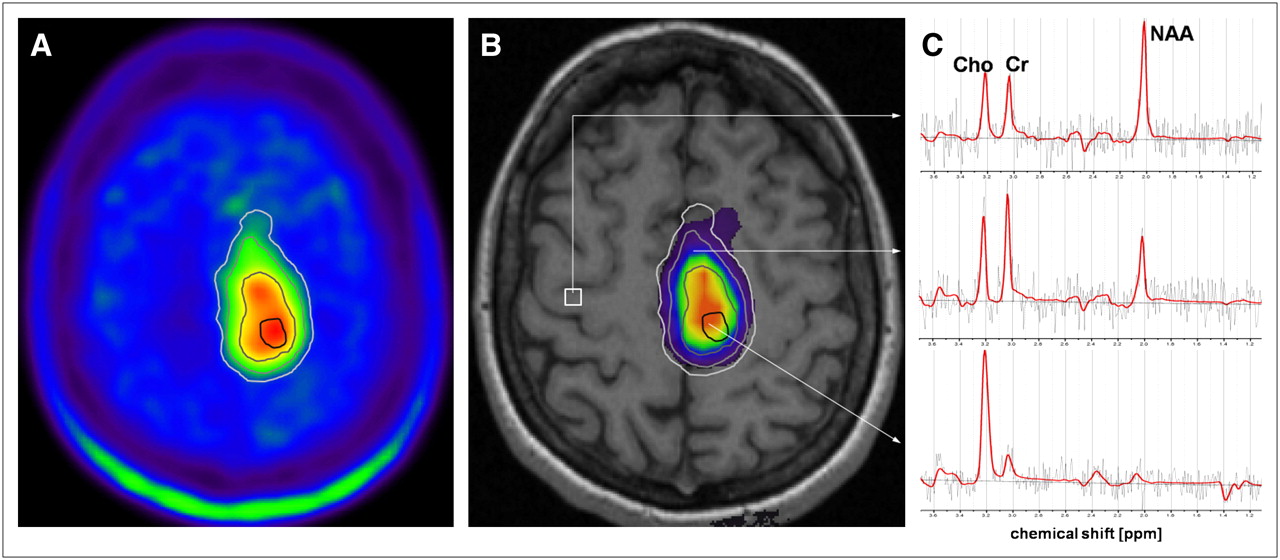
Segmentation of areas in lesion with different levels of 18F-FET uptake and copy of ROIs to 1H MRSI data for patient 5. (A) Axial PET image with manually defined ROIs for segmentation of areas with maximum 18F-FET uptake (black line), strong 18F-FET uptake (dark gray line), moderate 18F-FET uptake (gray line), and low 18F-FET uptake (light gray line). (B) Corresponding Cho/tNAA ratio map and ROIs overlaid on anatomic MR image. (C) LCModel fits (red line) of representative spectra. Upper spectrum is from voxel position in CNB (white square on B), middle spectrum is from voxel in area with moderate 18F-FET uptake, and lower spectrum is from voxel in area with maximum 18F-FET uptake.
Additionally, the ROIs that were defined on the PET dataset were copied to the coregistered 1H MRSI dataset (Fig. 2B) and used for calculation of the mean metabolite concentrations for Cho, Cr, and tNAA and Cho/tNAA ratios in the corresponding areas. The congruence of the areas of increased 18F-FET uptake and the areas of increased Cho/tNAA ratios in the lesions was estimated on the coregistered PET and 1H MRSI datasets. The same estimation of congruence was performed for the areas of maximum 18F-FET uptake and the areas of maximum changes in Cho/tNAA ratios by use of a 3-stage scale system: scale 2 for more than 50% overlap of the areas with maximum pathologic changes, scale 1 for less than 50% overlap, and scale 0 for no overlap (Fig. 3).
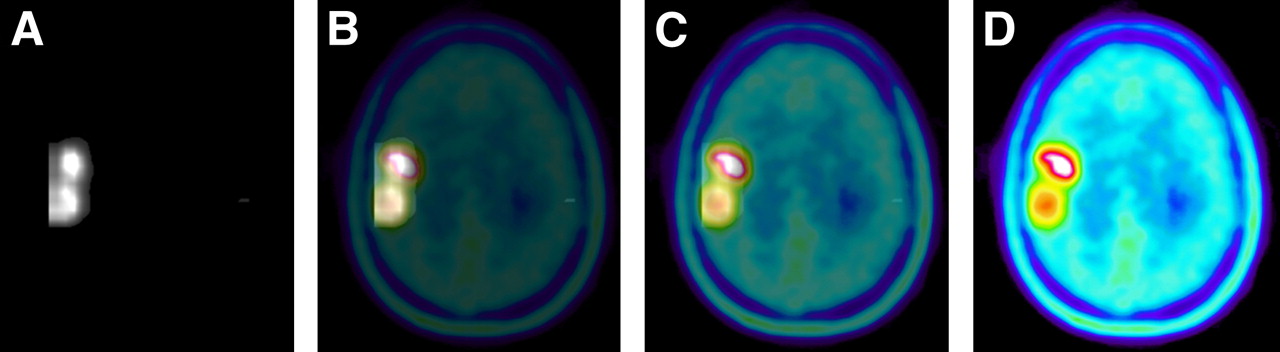
Series of images with variable opacities illustrating fusion of segmented Cho/tNAA ratio maps and 18F-FET PET images from patient 3. (A) Segmented Cho/tNAA ratio map with 100% opacity. (B and C) Fusion of segmented Cho/tNAA ratio map (with 75% opacity [B] and 25% opacity [C]) and 18F-FET PET images (with 25% opacity [B] and 75% opacity [C]). (D) 18F-FET PET image with 100% opacity.
Statistical Analysis
Data were analyzed by use of SPSS statistical software (version 14.0; SPSS). Spearman ρ correlation coefficients were calculated by linear regression analyses of correlations between TBR of 18F-FET uptake and metabolite data (Cho, Cr, and tNAA concentrations and Cho/tNAA ratios). Comparisons of TBR of 18F-FET uptake and metabolite data in the 4 tumor areas and in the CNB between groups (patients with gliomas of WHO grade II, those with gliomas of WHO grade III, and those with GBM of WHO grade IV) were performed by use of the Mann–Whitney U test. Probability values of less than 0.05 were considered significant. A correction for multiple comparisons was not applied.
RESULTS
Coregistration of 1H MRSI and 18F-FET PET was successful for data from all 15 patients. Figure 2C shows representative spectra from a voxel position in the CNB (upper spectrum), from a voxel in the area with moderate 18F-FET uptake (middle spectrum), and from a voxel in the area with maximum 18F-FET uptake (lower spectrum). For all 15 patients, the overlap of 18F-FET uptake and Cho/tNAA ratio data was more than 75%. The results of evaluating congruence for the areas of maximum 18F-FET uptake and maximum changes in Cho/tNAA ratios are shown in Table 1. Congruence of these “maximum” areas was found for all 15 patients. For 11 patients (73%), there was an overlap of more than 50% (Figs. 2 and 3), and for 4 patients (27%), there was an overlap of less than 50%. For the latter patients, the distances between the 18F-FET uptake maxima and the Cho/tNAA ratio maxima were 8.5–21 mm (mean ± SD, 13.5 ± 5.3 mm).
The results of the linear regression analyses of the correlations of 18F-FET uptake and 1H MRSI metabolite changes are shown in Table 2. The strongest correlations with 18F-FET uptake (TBR in tumor areas with maximum, strong, and moderate 18F-FET uptake) were found for Cho/tNAA ratios in areas with maximum and strong 18F-FET uptake and for tNAA in areas with maximum 18F-FET uptake. However, no significant correlation was registered for these two 1H MRSI parameters in the area with low 18F-FET uptake. Cho showed no significant correlation with 18F-FET uptake. Regression analysis of the TBR of 18F-FET uptake versus Cr revealed a significant correlation in the area with low 18F-FET uptake. In the CNB, no significant correlation was found for 1H MRSI metabolite changes and 18F-FET uptake. Figure 4 shows examples of scatter plots for significant correlations of Cho/tNAA ratios and tNAA in the area with maximum 18F-FET uptake (Figs. 4A and 4B) and Cr in the area with low 18F-FET uptake (Fig. 4C).
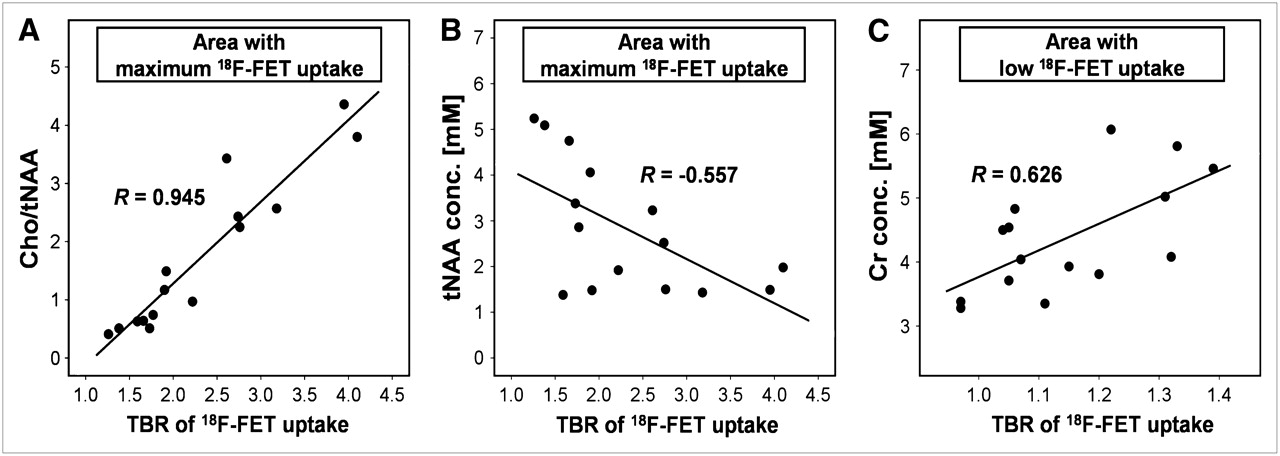
Scatter plots of correlations between metabolite data determined with 1H MRSI and TBR of 18F-FET uptake for all 15 patients with gliomas. Overlaid are Spearman ρ correlation coefficients from linear regression analyses. (A and B) Significant correlations between Cho/tNAA ratio and TBR of 18F-FET uptake (P < 0.001) (A) and between tNAA concentration and TBR of 18F-FET uptake (P = 0.031) (B) in area with maximum 18F-FET uptake. (C) Significant correlation between Cr concentration (conc.) and TBR of 18F-FET uptake in area with low 18F-FET uptake (P = 0.013).
Correlations of 18F-FET Uptake and 1H MRSI Metabolite Data
For the combination of all 4 tumor areas (i.e., maximum to low 18F-FET uptake), regression analyses revealed significant correlations for Cho, tNAA, and Cho/tNAA ratios and the TBR of 18F-FET uptake (Table 2). Similar results were found when the WHO grades of the lesions were considered (Table 2).
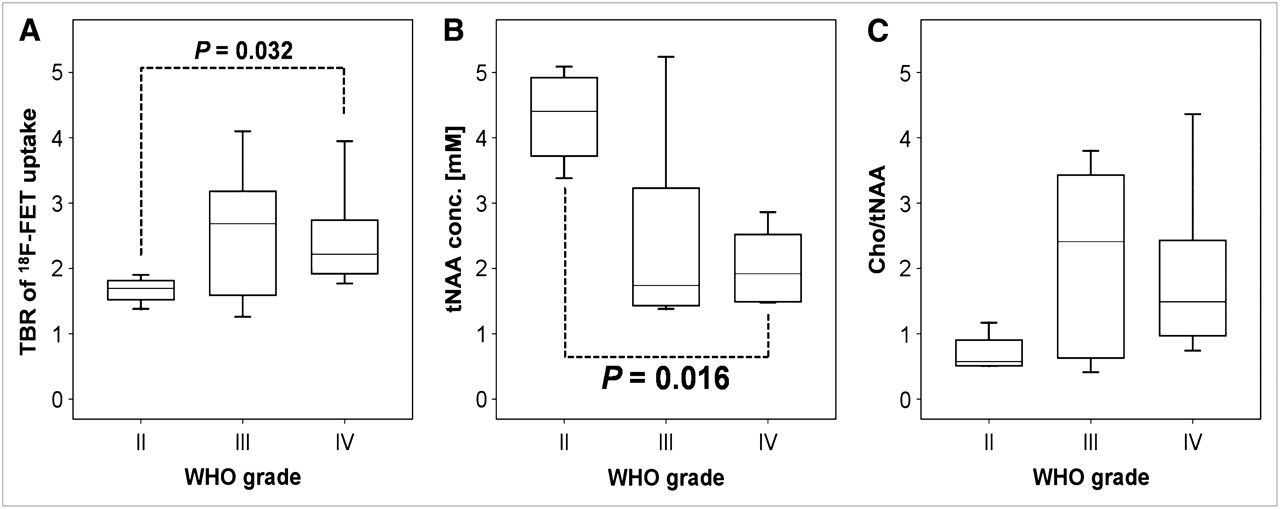
A Mann–Whitney U test for the comparison of 18F-FET uptake in subgroups of patients with gliomas of different WHO grades revealed significant differences (P = 0.032) in maximum 18F-FET uptake between gliomas of WHO grade II and GBM of WHO grade IV. For Cho, Cr, and tNAA concentrations and Cho/tNAA ratios, a Mann–Whitney U test revealed significant differences (P = 0.016) in tNAA concentrations in areas with maximum, strong, and moderate 18F-FET uptake between WHO grade II and IV gliomas.
Figure 5 shows box plots of the TBR of 18F-FET uptake, tNAA concentrations, and Cho/tNAA ratios in the area with maximum 18F-FET uptake for the 3 subgroups of patients.

Box plots of TBR of 18F-FET uptake (A), tNAA concentration (conc.) (B), and Cho/tNAA ratio (C) in area with maximum 18F-FET uptake for groups of patients with gliomas of WHO grades II, III, and IV. Significant differences between subgroups are marked with dotted lines, and P values are overlaid.
DISCUSSION
Several studies have demonstrated the benefit of 18F-FET PET for the management of gliomas in terms of differential diagnosis and grading (21–23), in the prognosis of patient outcomes (24), in therapy monitoring (25), and in the detection and diagnosis of tumor recurrence (26–28). Pauleit et al. (21) demonstrated an improvement in diagnostic accuracy when a combination of MRI and 18F-FET PET was used to delineate tumor borders. They found a sensitivity of 96% and a specificity of 53% for the detection of tumor tissue with MRI alone and a sensitivity of 93% and a specificity of 94% with the combination of MRI and 18F-FET PET.
However, the mechanisms of uptake and retention of 18F-FET in different parts of lesions are not yet fully clarified. Early in vitro and in vivo studies have shown that 18F-FET is not incorporated into proteins but that uptake into tumor cells occurs via specific amino acid carrier systems (17,29). A comparative study by Langen et al. (30) suggested that 18F-FET transport in F98 rat gliomas occurs via both Na+-independent system L and the +-dependent system B0,+. However, clinical studies of different tumor types have indicated that the situation is more complex (7). For brain tumors specifically, the influence of the disruption of the blood–brain barrier has been discussed (22,25,31,32). Spaeth et al. (31,32) concluded from their results of a 18F-FET PET study in F98 rat gliomas that increased 18F-FET uptake may be facilitated by the tumor cells themselves, whereas active transport across the blood–brain barrier is probably not a rate-limiting factor. They further concluded that disruption of the blood–brain barrier may result in the leakage of 18F-FET into the interstitial space (31,32).
Recent studies by Salber et al. investigated the uptake of 18F-FET in comparison with the uptake of 3H-methionine and 3H-deoxyglucose in brain abscesses (33) and 3H-methionine in focal cortical ischemia in rat models (34). They found discrepancies between the rates of uptake of the tracers in these nonneoplastic lesions, indicating that nonspecifically increased 18F-FET uptake may be related to reactive astrocytosis.
A few studies involved combined metabolic measurements for gliomas with 18F-FDG PET and magnetic resonance spectroscopy (MRS). Most of these studies reported correlations between glucose metabolism and 1H MRSI–derived variables (35–39). Kwee et al. (40) performed 18F-fluorocholine PET and 1H MRSI for 2 patients with intracranial lesions; 1 had a demyelinating process, and 1 had GBM. They demonstrated significant correlations between the mean and maximum standardized uptake values of the radiopharmaceutical and the regional Cho/Cr ratio for the patient with GBM but not for the patient with the demyelinating process.
As yet, only one other multimodal metabolic imaging study combining 18F-FET PET and 1H MRSI for gliomas has been published (41). Floeth et al. (41) determined the predictive value of 18F-FET PET and single-voxel 1H MRSI for the differential diagnosis of benign and malignant cerebral lesions with a lesion-to-brain ratio of 18F-FET uptake of greater than 1.6 and an NAA/Cho ratio of less than 0.7 as tumor indicators. Compared with conventional MRI, they reported an increase in diagnostic accuracy for the combination of MRI with 18F-FET PET and 1H MRSI for this purpose. Plotkin et al. (42) performed SPECT with 123I-iodomethyltyrosine and single-voxel MRS for differentiation between residual tumor or recurrence and treatment-related changes in pretreated patients with gliomas (42). They found that 123I-iodomethyltyrosine had higher sensitivity, specificity, and accuracy than single-voxel MRS for distinguishing the changes.
In contrast, our purpose was to correlate the spatial heterogeneity of 18F-FET PET and multivoxel 1H MRSI for gliomas. This spatial heterogeneity most likely reflects different extents of tumor infiltration. We performed multimodal metabolic imaging of cerebral gliomas to correlate differences in 18F-FET uptake in the lesion with metabolite concentrations for Cho, Cr, and tNAA and Cho/tNAA ratios. Our purpose was to obtain multimodal metabolic information from tumor areas with variable degrees of pathology.
We found congruence between elevated 18F-FET uptake and increases in Cho/NAA ratios for the delineation of the whole tumor as well as for the detection of maximum pathologic changes. Although both modalities detected different metabolic activities in the lesions, they provided comparable results in delineating pathologic changes most likely reflecting tumor infiltration.
In areas with maximum, strong, and moderate 18F-FET uptake, a significant correlation of that variable with the Cho/tNAA ratio, that is, the ratio of membrane turnover to neuronal loss, was found. The concentration of tNAA, that is, the absolute extent of neuronal loss, showed a significant correlation only in areas with maximum 18F-FET uptake. In recent studies, we were able to demonstrate that a strong correlation exists between the extent of tumor cell infiltration and tNAA and Cho/tNAA ratio (9). It is legitimate to conclude that the same correlation exists between 18F-FET uptake and tumor cell infiltration. These data corroborate the findings of earlier studies, providing evidence for the usefulness of 18F-FET PET in determining tumor extent (21,22,27,28).
An interesting and unexpected result was the correlation of the Cr concentration, a marker of energy metabolism, with amino acid accumulation in areas with low 18F-FET uptake. This correlation may have been associated with the mechanisms of tumor infiltration into normal brain tissue or the immune response of brain parenchyma. This hitherto unreported observation deserves further investigation.
We found significant differences in maximum 18F-FET uptake and the tNAA concentration between WHO grade II and IV gliomas but not for between these 2 tumor grades and WHO grade III. Because of the small number of patients in the subgroups of patients with different WHO grades (4 patients had gliomas of WHO grade II), we decided not to compare low-grade gliomas (4 patients) and high-grade gliomas (11 patients). However, our findings for maximum 18F-FET uptake are in good agreement with the results of previous studies investigating the kinetics of 18F-FET uptake. In our study, PET scans were performed in an early phase, starting 10 min after injection. Significant differences in 18F-FET uptake between low- and high-grade gliomas were documented for untreated gliomas in the first 10 min after injection (22) as well as for recurrent gliomas at 5–20 min after injection (26). An 18F-FET PET data acquisition starting more than 20 min after injection seems to result in 18F-FET uptake values that are not significantly different in low- and high-grade gliomas (21,22,26,27).
Our data may be considered preliminary in view of the comparatively small number of subjects studied. A further limitation is the fact that we performed the 1H MRSI experiment as a 2-dimensional experiment. To cover the entire or at least the bulk of the tumor volume, it will be necessary to use a 3D 1H MRSI sequence with a spatial resolution comparable to those of PET scans. The latter has the drawbacks of longer acquisition times and a decline in the signal-to-noise ratio. The application of so-called parallel imaging techniques (e.g., sensitivity-encoded spectroscopic imaging) (43) at higher magnetic field strengths (3 T or more) (44) would be a strategy for overcoming this problem. However, 1H MRSI is very sensitive to susceptibility artifacts, a property that excludes the use of this method in patients with tumors in subcranial, frontobasal, or temporal locations or in patients after surgery. Unfortunately, these problems are more evident at higher magnetic field strengths. On the other hand, in theory, 1H MRSI can be performed with any modern MR scanner, provided that a license exists, whereas the availability of 18F-FET PET is still limited.
CONCLUSION
In this study, we demonstrated a significant correlation between amino acid uptake assessed with 18F-FET PET and various parameters derived from 1H MRSI data for patients with gliomas. In the tumor center, the increase in 18F-FET transport correlates with the extent of neuronal loss (tNAA) and correlates partially with the extent of the increase in membrane proliferation (Cho). The correlation of the marker for energy metabolism (Cr) with 18F-FET uptake in the tumor border needs to be investigated in further studies. This is the first study correlating the spatial heterogeneity of changes in amino acid transport assessed with 18F-FET PET and parameters derived from 1H MRSI. Both methods provided complementary information in the study of glioma metabolism that may be useful in planning and targeting surgery and radiochemotherapy.
Acknowledgments
The authors thank Wilhelm Hamkens and Dr. Willi Kalender (PET Net GmbH, Erlangen, Germany) for expert technical support and excellent collaboration.
Footnotes
-
COPYRIGHT © 2008 by the Society of Nuclear Medicine, Inc.
References
- Received for publication November 17, 2007.
- Accepted for publication January 30, 2008.


Jump to section
Related Articles
Cited By...
- Spatial Relationship of Glioma Volume Derived from 18F-FET PET and Volumetric MR Spectroscopy Imaging: A Hybrid PET/MRI Study
- Performance of 18F-Fluoro-Ethyl-Tyrosine (18F-FET) PET for the Differential Diagnosis of Primary Brain Tumor: A Systematic Review and Metaanalysis
- Imaging biomarkers of brain tumour margin and tumour invasion
- Imaging biomarkers of angiogenesis and the microvascular environment in cerebral tumours
- Multimodality Assessment of Brain Tumors and Tumor Recurrence
- Classification of Peritumoral Fiber Tract Alterations in Gliomas Using Metabolic and Structural Neuroimaging
- Value of 1H-magnetic resonance spectroscopy chemical shift imaging for detection of anaplastic foci in diffusely infiltrating gliomas with non-significant contrast-enhancement
- Molecular Imaging: 18F-FDG PET and a Whole Lot More