


Article Figures & Data
Figures
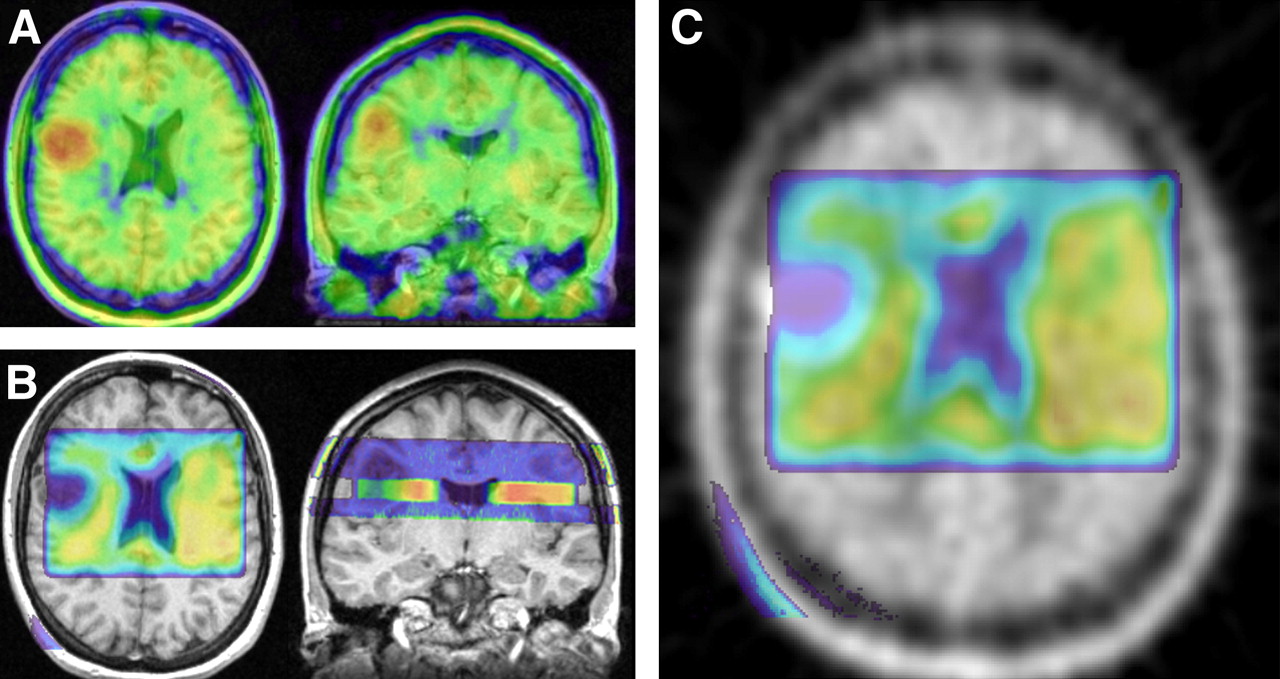
- FIGURE 1.
Procedure for coregistering 18F-FET PET and 1H MRSI data for patient 3. (A) Axial and coronal images of fused 18F-FET PET and anatomic MRI dataset, obtained by coregistration of color-coded PET dataset (color code: red = maximum 18F-FET uptake and blue = minimum 18F-FET uptake) with 3D MPRAGE dataset. (B) Axial and sagittal images of fused 1H MRSI data (evaluated as tNAA metabolic map) and anatomic MRI data, obtained by coregistration of color-coded MRI/MRSI hybrid dataset (color code: red = maximum tNAA concentration and blue = minimum tNAA concentration) with 3D MPRAGE dataset. (Sagittal image shows MRI/MRSI hybrid dataset consisting of anatomic information in blue above and below tNAA metabolic map.) (C) Axial image of coregistered 18F-FET PET dataset (gray scale) and tNAA metabolic map (color coded) calculated from 1H MRSI dataset.
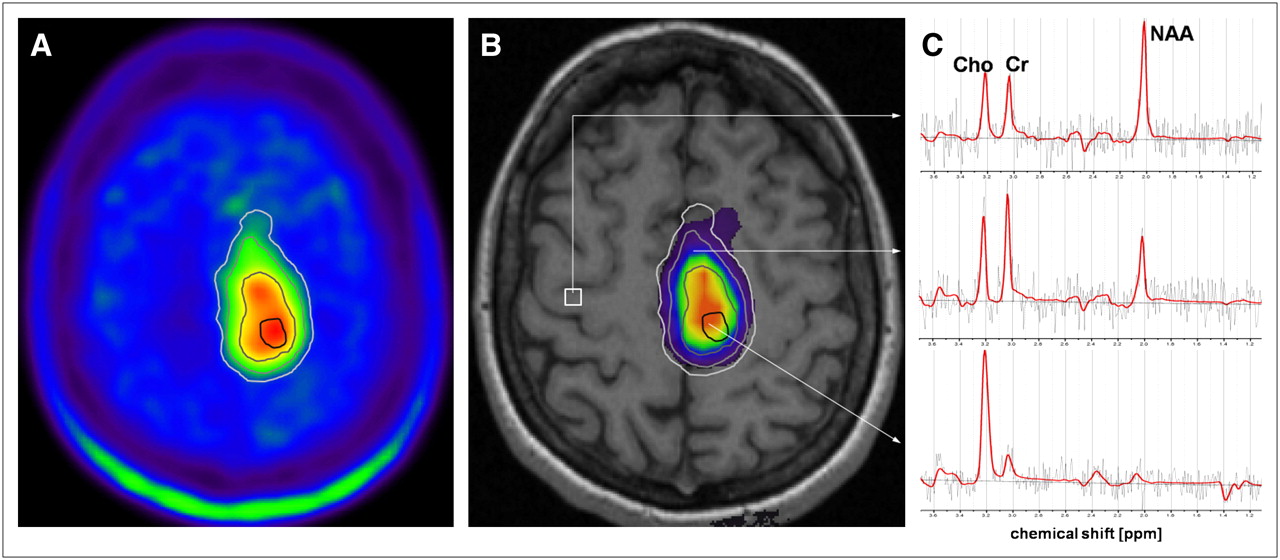
- FIGURE 2.
Segmentation of areas in lesion with different levels of 18F-FET uptake and copy of ROIs to 1H MRSI data for patient 5. (A) Axial PET image with manually defined ROIs for segmentation of areas with maximum 18F-FET uptake (black line), strong 18F-FET uptake (dark gray line), moderate 18F-FET uptake (gray line), and low 18F-FET uptake (light gray line). (B) Corresponding Cho/tNAA ratio map and ROIs overlaid on anatomic MR image. (C) LCModel fits (red line) of representative spectra. Upper spectrum is from voxel position in CNB (white square on B), middle spectrum is from voxel in area with moderate 18F-FET uptake, and lower spectrum is from voxel in area with maximum 18F-FET uptake.
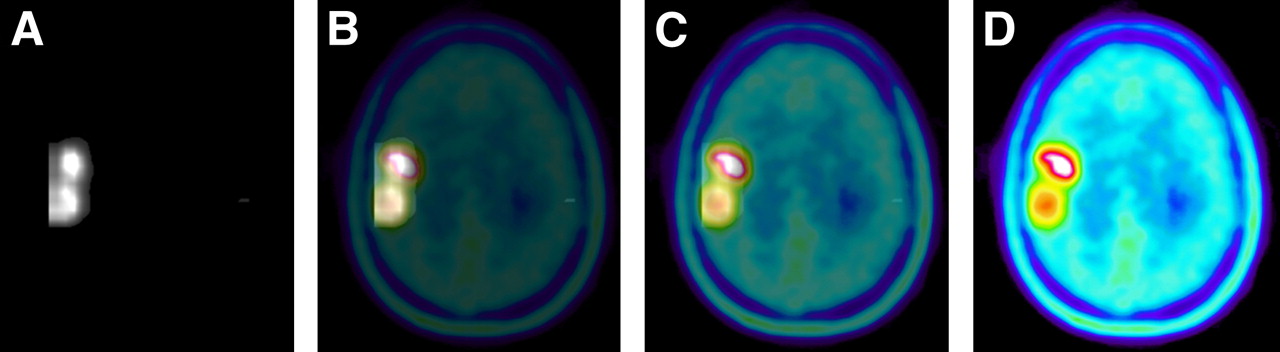
- FIGURE 3.
Series of images with variable opacities illustrating fusion of segmented Cho/tNAA ratio maps and 18F-FET PET images from patient 3. (A) Segmented Cho/tNAA ratio map with 100% opacity. (B and C) Fusion of segmented Cho/tNAA ratio map (with 75% opacity [B] and 25% opacity [C]) and 18F-FET PET images (with 25% opacity [B] and 75% opacity [C]). (D) 18F-FET PET image with 100% opacity.
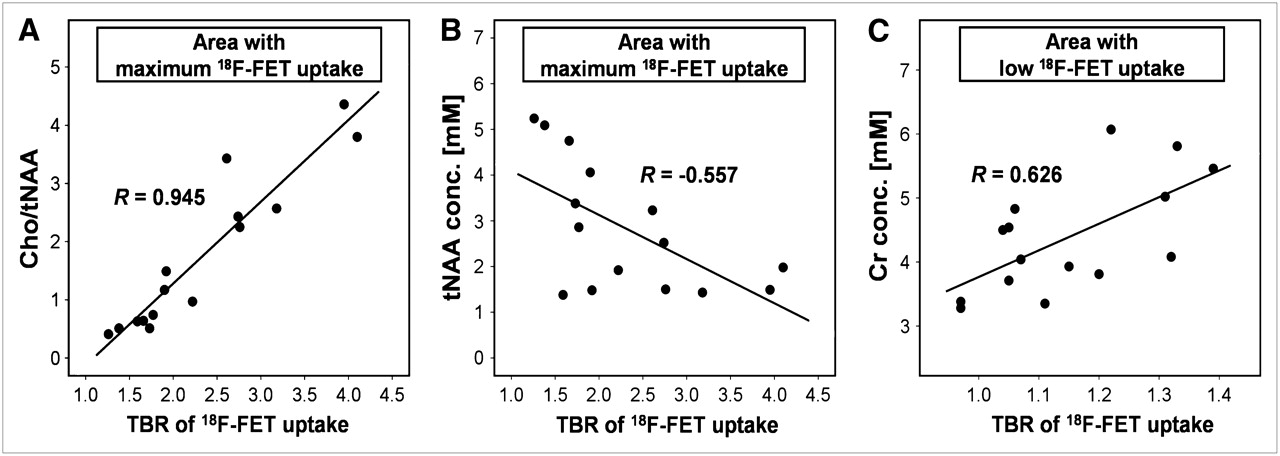
- FIGURE 4.
Scatter plots of correlations between metabolite data determined with 1H MRSI and TBR of 18F-FET uptake for all 15 patients with gliomas. Overlaid are Spearman ρ correlation coefficients from linear regression analyses. (A and B) Significant correlations between Cho/tNAA ratio and TBR of 18F-FET uptake (P < 0.001) (A) and between tNAA concentration and TBR of 18F-FET uptake (P = 0.031) (B) in area with maximum 18F-FET uptake. (C) Significant correlation between Cr concentration (conc.) and TBR of 18F-FET uptake in area with low 18F-FET uptake (P = 0.013).
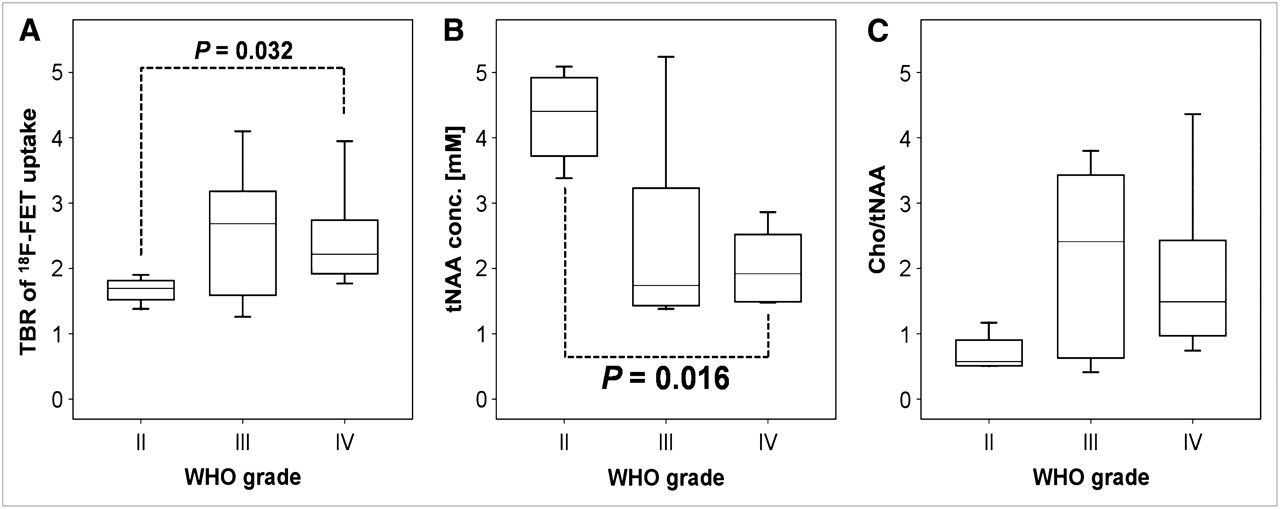
- FIGURE 5.
Box plots of TBR of 18F-FET uptake (A), tNAA concentration (conc.) (B), and Cho/tNAA ratio (C) in area with maximum 18F-FET uptake for groups of patients with gliomas of WHO grades II, III, and IV. Significant differences between subgroups are marked with dotted lines, and P values are overlaid.


Tables
Patient Age (y) Sex Histologic diagnosis Location Overlap of maxima* 1 51 F Astrocytoma of WHO grade III R, frontotemporal 2 2 29 M Astrocytoma of WHO grade II L, postcentral 2 3 37 F Oligoastrocytoma of WHO grade III R, frontal 2 4 34 M GBM of WHO grade IV L, temporoparietal 2 5 39 F GBM of WHO grade IV L, frontal 2 6 57 F Astrocytoma of WHO grade III L, frontal 1 7 54 M Astrocytoma of WHO grade III L, frontal 1 8 38 M Astrocytoma of WHO grade II L, frontoparietal 2 9 23 F Oligoastrocytoma of WHO grade II R, occipital 2 10 24 F Astrocytoma of WHO grade III L, frontal 2 11 78 M Gliomatosis cerebri R, temporal 1 12 43 M GBM of WHO grade IV R, temporal 1 13 66 M GBM of WHO grade IV L, temporal 2 14 59 M GBM of WHO grade IV R, frontal 2 15 43 M Oligoastrocytoma of WHO grade II R, parietal 2 ↵* Overlap of maxima = estimation of overlap between area with maximum 18F-FET uptake and area with maximum changes in corresponding Cho/tNAA ratio maps: 2 = 100%–50% overlap; 1 = <50% but more than no overlap; 0 = no overlap.
R = right hemisphere; L = left hemisphere.
R for: Area of 18F-FET uptake Cho Cr tNAA Cho/tNAA Maximum 0.475 −0.064 −0.557* 0.945† Strong 0.492 0.464 −0.404 0.811† Moderate 0.164 0.471 −0.482 0.531* Low 0.072 0.626* −0.089 0.095 CNB −0.134 −0.290 0.384 −0.329 All tumor areas‡ 0.501† −0.022 −0.880† 0.891† Tumors of following WHO grade§ (no. of subjects): II (4) 0.535* −0.126 −0.871† 0.849† III (6) 0.406* 0.007 −0.845† 0.851† IV (5) 0.705† 0.036 −0.913† 0.947† ↵* P < 0.05.
↵† P < 0.001.
↵‡ Correlations for combination of all 4 areas in lesions (maximum to low 18F-FET uptake).
↵§ Correlations for all tumor areas in subgroups of patients with WHO grade II, III, and IV gliomas. Patient with gliomatosis cerebri was included in group of patients with glioma of WHO grade III.


Jump to section
Related Articles
Cited By...
- Spatial Relationship of Glioma Volume Derived from 18F-FET PET and Volumetric MR Spectroscopy Imaging: A Hybrid PET/MRI Study
- Performance of 18F-Fluoro-Ethyl-Tyrosine (18F-FET) PET for the Differential Diagnosis of Primary Brain Tumor: A Systematic Review and Metaanalysis
- Imaging biomarkers of brain tumour margin and tumour invasion
- Imaging biomarkers of angiogenesis and the microvascular environment in cerebral tumours
- Multimodality Assessment of Brain Tumors and Tumor Recurrence
- Classification of Peritumoral Fiber Tract Alterations in Gliomas Using Metabolic and Structural Neuroimaging
- Value of 1H-magnetic resonance spectroscopy chemical shift imaging for detection of anaplastic foci in diffusely infiltrating gliomas with non-significant contrast-enhancement
- Molecular Imaging: 18F-FDG PET and a Whole Lot More