


Abstract
PET molecular imaging of 15O-labeled water is the gold standard for measuring blood flow in humans. However, this requires an on-site cyclotron to produce the short-lived 15O tracer, which is cost-prohibitive for most clinical PET centers. The purpose of this study was to determine if the early uptake of 18F-FDG could be used to measure regional blood flow in tumors in the absence of 15O-water. Methods: PET scans were obtained in patients being evaluated for tumor perfusion and glucose metabolism in a phase I dose-escalating protocol for endostatin, a novel antiangiogenic agent. A 2-min perfusion scan was performed with a bolus injection of 2,220 MBq (60 mCi) of 15O-water, which was followed by a 370-MBq (10 mCi) dose of 18F-FDG. Four sequential scans of 18F-FDG uptake were acquired, consisting of an early 2-min uptake scan—or first-pass scan—and 3 sequential 15-min late 18F-FDG uptake scans. Regions of interest (ROIs) were drawn on 2 or more tumor sites and on back muscle, as a control ROI, for each patient. Arterial blood concentration was derived from the PET scans by drawing an ROI over a large artery in the field of view. Blood flow was computed with a simple 1-compartment blood flow model using the first 2 min of data after injection. Results: Blood flow estimated from the early uptake of 18F-FDG was linearly correlated with 15O-measured blood flow, with an intercept of 0.01, a slope of 0.86, and an R2 regression coefficient of 0.74 (r = 0.86). The 18F-FDG tumor extraction fraction relative to 15O-water averaged 0.86. A preliminary case study of a patient with prostate cancer confirms the utility of the first-pass 18F-FDG blood flow analysis in tumor diagnosis. Conclusion: These results suggest that the first-pass uptake of 18F-FDG may provide an estimate of perfusion in a tumor within the limitations of incomplete extraction of 18F-FDG compared with 15O-water.
Malignant tumors are typically associated with an increase in blood flow, after neovascularization, and cellular metabolism (1–4). In most cases tumor metabolism is coupled to the increase in blood flow, although in some cases the 2 parameters may be uncoupled. As a consequence, changes in tumor blood flow and tumor metabolism are 2 key parameters used to characterize the response of malignant tumors to therapy (1,5,6).
The current gold standard method for measuring blood flow in humans is PET of 15O-labeled water (7,8). 15O-water is a short-lived tracer with a 2-min half-life. Because of its short half-life, the tracer must be made at a cyclotron that is in close proximity to the PET scanner. Cyclotrons are expensive to own and operate and, as a consequence, only a few research sites are able to measure tumor blood flow with 15O-water in combination with metabolism.
Tumor metabolism is measured using 18F-FDG PET where the tracer can be made off-site and shipped to the PET center. A method of measuring blood flow and metabolism in tumors from a single injection of 18F-FDG may be an important addition to functional imaging of tumors with 18F-FDG PET.
We have performed a preliminary study to extract a measure of tumor perfusion from the first-pass delivery of 18F-FDG to the tumor tissue. PET scans were performed beginning from the injection of the isotope for a period of 60 min. A first-pass 2-min scan of 18F-FDG uptake (early uptake), after injection of the tracer, was used to compute tumor blood flow and compared with 15O-labeled blood flow images obtained similarly in the first 2 min after injection. 18F-FDG scans obtained between 35 and 50 min after injection (late uptake) were used to compute tumor metabolism. Preliminary results of the current study suggest that extracting an index of tumor blood flow and glucose metabolism from a single injection of 18F-FDG may be feasible. These data were presented in part in abstract form (9).
MATERIALS AND METHODS
First-Pass Model for Measurement of Blood Flow
The concept of measuring tumor perfusion from the first-pass of 18F-FDG is based on the first-pass model of Mullani and coworkers (10–13). The model postulates that during the first pass of a tracer through tissue, the venous egress of the tracer is delayed by some time, which is a function of the distribution volume and vessel density of the tracer in the tissue of interest. During this delay time, for highly extracted tracers, most of the tracer is retained in the tissue so that venous egress is very small. Blood flow can be calculated during this delay time by using a simple flow equation similar to the one used for microspheres, as we have developed previously for 82Rb first-pass analysis in myocardium and kidney (11–13). It follows that any tracer that is highly extracted into the tissue can potentially be used to measure blood flow if an appropriate delay time for egress is apparent.
Kinetic modeling of 18F-FDG in tissue shows that there is initially a large influx of 18F-FDG into tissue during the first pass of the tracer that is delivered as a function of the blood flow to the tissue (14–16). This initial influx is termed the “free” tracer that diffuses across the capillary wall into the extravascular space and washes out of the tissue at a slower rate without being metabolically trapped in the cell. This initial component may also include early uptake of tracer into tissue cells via glucose transporters before trapping, especially for cells with high metabolic rates. The “trapped” portion of the 18F-FDG tracer results from the metabolism of the tracer, which accumulates slowly and takes 30–60 min to reach a maximum value in normal tissue. The concept of free and trapped tracer modeling has been used previously with another partially extracted PET tracer, 82Rb, to measure first-pass blood flow in the myocardium and kidney as reported by Mullani and coworkers (11,13).
Extraction of 18F-FDG in tissue can be described by 2 extraction fractions, the first-pass extraction fraction, Efp, and the metabolic, or trapped, extraction fraction, Emet. The initial large influx of 18F-FDG into the tissue in the free state, including any free 18F-FDG uptake into cells, suggests that the Efp may be very high. The exact value of Efp has not been published and is unknown for tumors. Emet is quite small initially, but with continued metabolic trapping of 18F-FDG over a long time period (35–50 min), it will slowly accumulate in the tissue. The theoretic basis for using the first-pass scans to model blood flow using a simple blood flow model is outlined in the Supplemental Appendix (supplemental material is available online only at http://jnm.snmjournals.org).
Scan Times for Measurement of Blood Flow
Scan times of 1–2 min are routinely used for measuring blood flow in the brain with 15O-water using the simple blood flow model (17–20). Ruotsalainen et al. (21) used this autoradiographic imaging method with 15O-labeled water and PET to measure blood flow in muscle using a bolus injection of tracer and a single scan. They validated the use of the bolus method of blood flow comparison against the gold standard of constant infusion of tracer. They demonstrated that 90- and 200-s scan times lead to underestimates of blood flow near 8% and 20%, respectively. A similar study by Okazawa et al. (22) on blood flow to the brain showed a 20% underestimation with 180-s integration times for blood flow values up to 70 mL/min/100 g. We estimate from these 2 studies that a 120-s integration time used in our study will result in an approximately 14% underestimation of blood flow. We also limited our blood flow analysis to <70 mL/min/100 g to be consistent with the published validations.
In the current study we measured tumor blood flow with 15O-water and glucose metabolism with 18F-FDG in patients who were undergoing a Phase I dose-escalation trial for endostatin, an angiogenesis inhibitor (23,24). Endostatin is thought to block the growth of new blood vessels that are required for the increased blood flow demands of the growing tumor, thereby limiting the growth of the tumor. In addition, as outlined heretofore, we also acquired data on the early uptake (2 min after injection) of 18F-FDG and compared it with blood flow images acquired with the 2-min acquisition of 15O-water.
Patient Population
Data from the first 16 patients were reanalyzed from a Phase I study for the effect of endostatin on blood flow and glucose metabolism in human tumors (23,24). These patients and their clinical history are described in detail by Herbst et al. (24). These patients was diagnosed with different types of tumors, which included 3 melanomas, 2 renal cell carcinomas, 2 breast cancers, 2 colon cancers, 2 leiomyosarcomas, squamous cell carcinoma, adenocarcinoma, medullary thyroid, chondrosarcoma, and liposarcoma. All tumors analyzed were 2 cm or larger (24).
All of the patients were scanned before any treatment for a baseline study. Subsequently, most of the patients were scanned after 28 and 56 d of treatment with endostatin. Some of the patients dropped out of the protocol before the 56-d scans were obtained. All patients were recruited at The University of Texas M.D. Anderson Cancer Center and signed the consent forms required by the Investigational Review Board. Most of the patients had 2 or more tumors in the field of view of the PET camera.
Imaging Protocol
Patients were imaged by PET using the Posicam 6.5BGO systems (Posicam; Positron Corp), which collects 21 slices simultaneously using methods similar to that done previously (24,25). Images were reconstructed in a 128 × 128 matrix using the standard filtered backprojection method. The reconstructed transaxial resolution of the system for clinical studies was approximately 10-mm full width at half maximum (FWHM), and the axial resolution was 12-mm FWHM with slice spacing of 5.25 mm. The PET scanner used did not have the capability of rapid serial sampling, thus limiting the data acquisition protocols to a limited number of sequential scan times.
Patients were asked to fast for a minimum of 8 h before the PET study. The patients were imaged first for 20 min before tracer injection for the acquisition of attenuation data collected with a rotating rod source. A 2,220-MBq (60 mCi) bolus injection of 15O-water was performed, and a 2-min image was acquired. After a wait time of approximately 10 min (12 min after injection) for the 15O isotope to decay, a 370-MBq (10 mCi) bolus injection of 18F-FDG was performed. Radiation decay for the 124-s half-life 15O tracer is estimated at 97% at 12 min after injection. This, combined with the washout of 15O-water from tumors and equilibration of the tracer in the water space in the patient, should result in a negligible contamination of the 15O tracer in the first-pass 18F-FDG scan.
The data acquisition for the 18F-FDG imaging included a 2-min early acquisition (first-pass scan), similar to the 15O data acquisition, which was followed by three 15-min scans. The last 15-min 18F-FDG scan (late scan) was used to compute the standardized uptake value (SUV) of the tumor.
Image Analysis
The reconstructed images were viewed in the transaxial mode and regions of interest (ROIs) were drawn on the tumors. A separate region, usually on the back muscle, was drawn as a control ROI for estimating blood flow and metabolism in nontumor tissue. An average number of 3 tumor ROIs was drawn for each patient (24). ROIs for the repeated scans were drawn to match the ROIs in the previous scans. Arterial concentrations of the injected tracers were obtained by drawing a region over a large artery, such as the descending aorta, on the first-pass 18F-FDG images. Tumor regions were drawn on the late 18F-FDG images and superimposed onto the 2-min first-pass images. The 18F-FDG ROIs were used to analyze the 15O-water images.
Partial-Volume Correction
Partial-volume errors are caused by the finite resolution of the PET camera as compared with the object being imaged. Objects that are smaller than 2 times the resolution of the PET camera will result in reduced uptake of tracer and an underestimation of concentrations. However, most of the tumors imaged in this study were larger than 2 cm in diameter and, hence, no partial-volume corrections were applied to the tumor data. Moreover, when comparing the blood flow obtained by 15O-water and the first pass of 18F-FDG, the partial-volume errors almost cancel out because the same ROIs were used for both sets of images.
Blood Flow Computation
Blood flow for the 2 tracers was computed using the 1-compartment blood flow model described previously by Mullani and coworkers (11–13), as outlined in the Supplemental Appendix. A 0- to 2-min scan was used for all blood flow estimates. The equation for blood flow, F, is: Eq. 1where Q(T) represents the residual amount of the tracer in sampled tissue at any time T, E(T) is the extraction fraction of tracer, and Ca(t) is the arterial concentration of the tracer at any time t (Supplemental Appendix). We hypothesize that 18F-FDG is highly extracted in tumor tissue during the first pass of the tracer. Therefore, as a first approximation we have assumed that E(T) is near 1 during the early uptake of the tracer. Whereupon, Equation 1 reduces to:
 Eq. 2where A(T) is the integrated arterial concentration of the tracer at any time T (= the integral of Ca). The model assumes accumulation of tracer in the tissue, Q(T), with very little egress of the tracer from the tissue during the 2 min of data acquisition. As noted heretofore, this simple model may lead to a 14% underestimation of blood flow, which has been ignored for this simple comparison of 2 tracers. Equation 2 is the same as Equation A6 in the Supplemental Appendix, where the limitations of the methods are outlined in greater detail.
RESULTS
Comparison of Early 18F-FDG Images and 15O Blood Flow Images
Tumor PET images comparing 15O-water uptake with the first-pass 18F-FDG uptake during the first 2 min after injection of the tracers are shown in Figures 1A and 1B. The late uptake of 18F-FDG for the delineation of tumors (and metabolism) is also shown for comparison on the right side of the figure (Fig. 1C). It is apparent from these examples that the early 18F-FDG images are closer in image content and distribution to the 15O-water images than to the metabolism images obtained during the late scans.
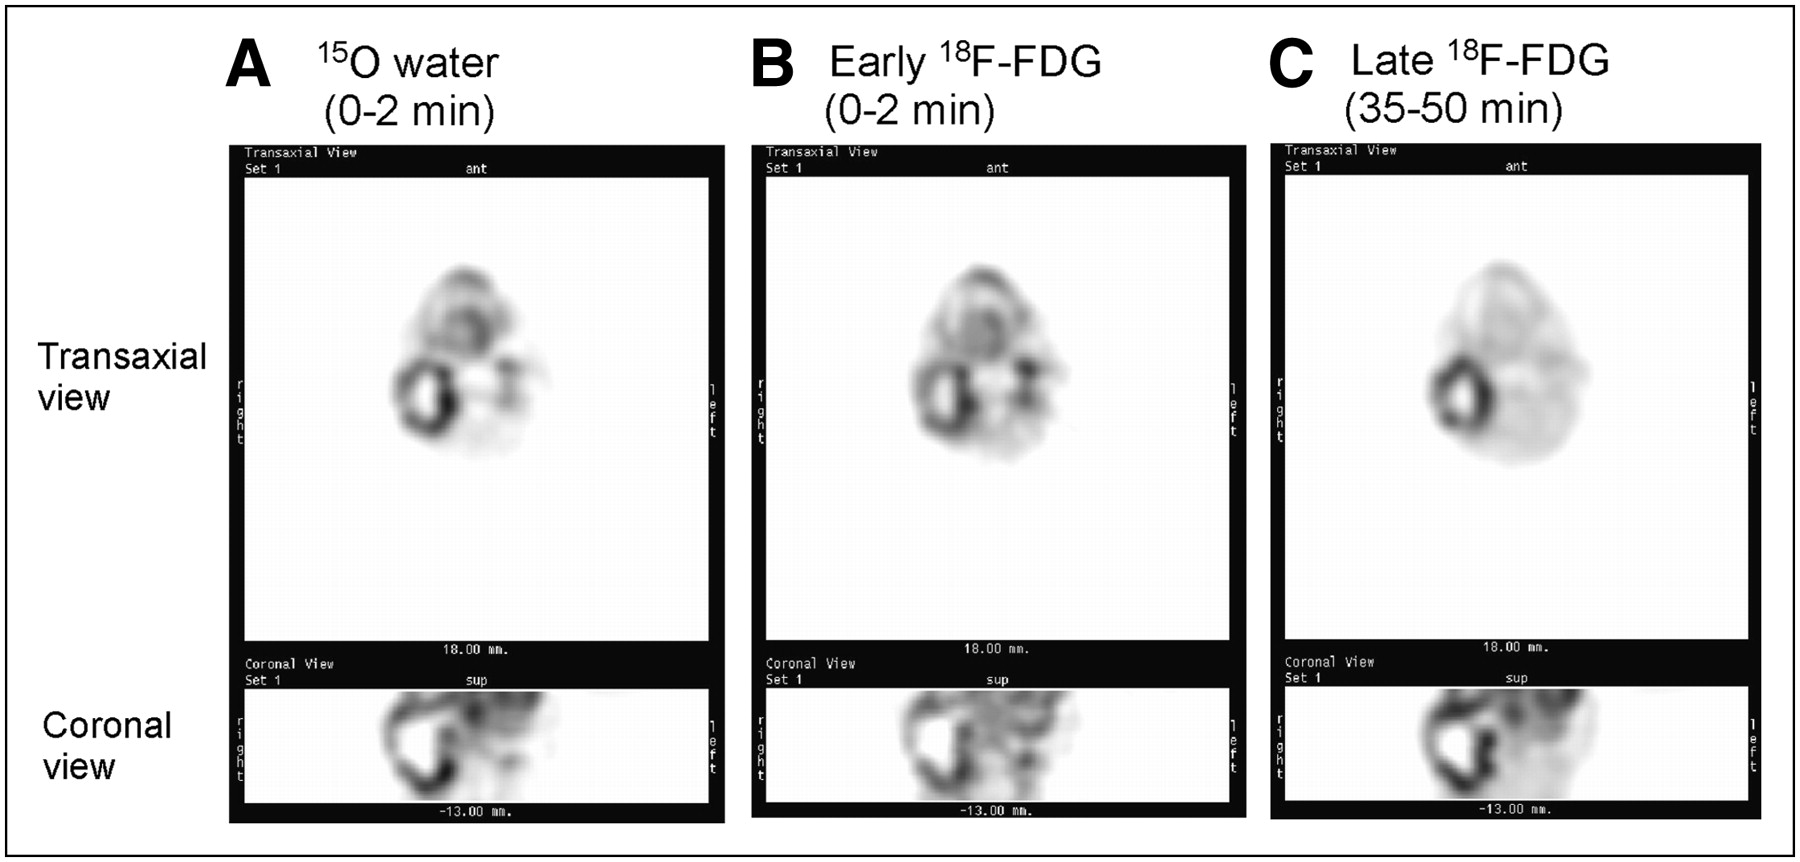
Representative PET images of a head and neck tumor comparing 15O-water scans with 18F-FDG scans. (A) 15O-water uptake during the first 2 min. (B) First-pass 18F-FDG uptake during the first 2 min. (C) Late 18F-FDG uptake, 35–50 min. Transaxial and coronal views are shown.
Comparison of Early 18F-FDG Images and Late 18F-FDG Images
A comparison of the early and the late 18F-FDG uptake images show major differences in the distribution pattern (compare Fig. 1B with Fig. 1C). Tumor uptake of glucose is enhanced in the late image, as anticipated, after a long delay of 35 min, demonstrating metabolic trapping of 18F-FDG. Areas of increased uptake during the first 2 min of 18F-FDG delivery are reduced in areas of high blood concentration, such as blood vessels and the mandible, during the late (last) scan.
The sequential imaging of 18F-FDG in tumors was performed as a function of time. Typically, 4 images were obtained beginning with the first 2-min scan, which then was followed by 3 subsequent 15-min acquisitions (data not shown). The changing pattern of 18F-FDG uptake is apparent in the later scans, reflecting metabolic trapping of 18F-FDG, consistent with that shown for the late scan in Figure 1C.
Correlation of First-Pass 18F-FDG Blood Flow and 15O Blood Flow
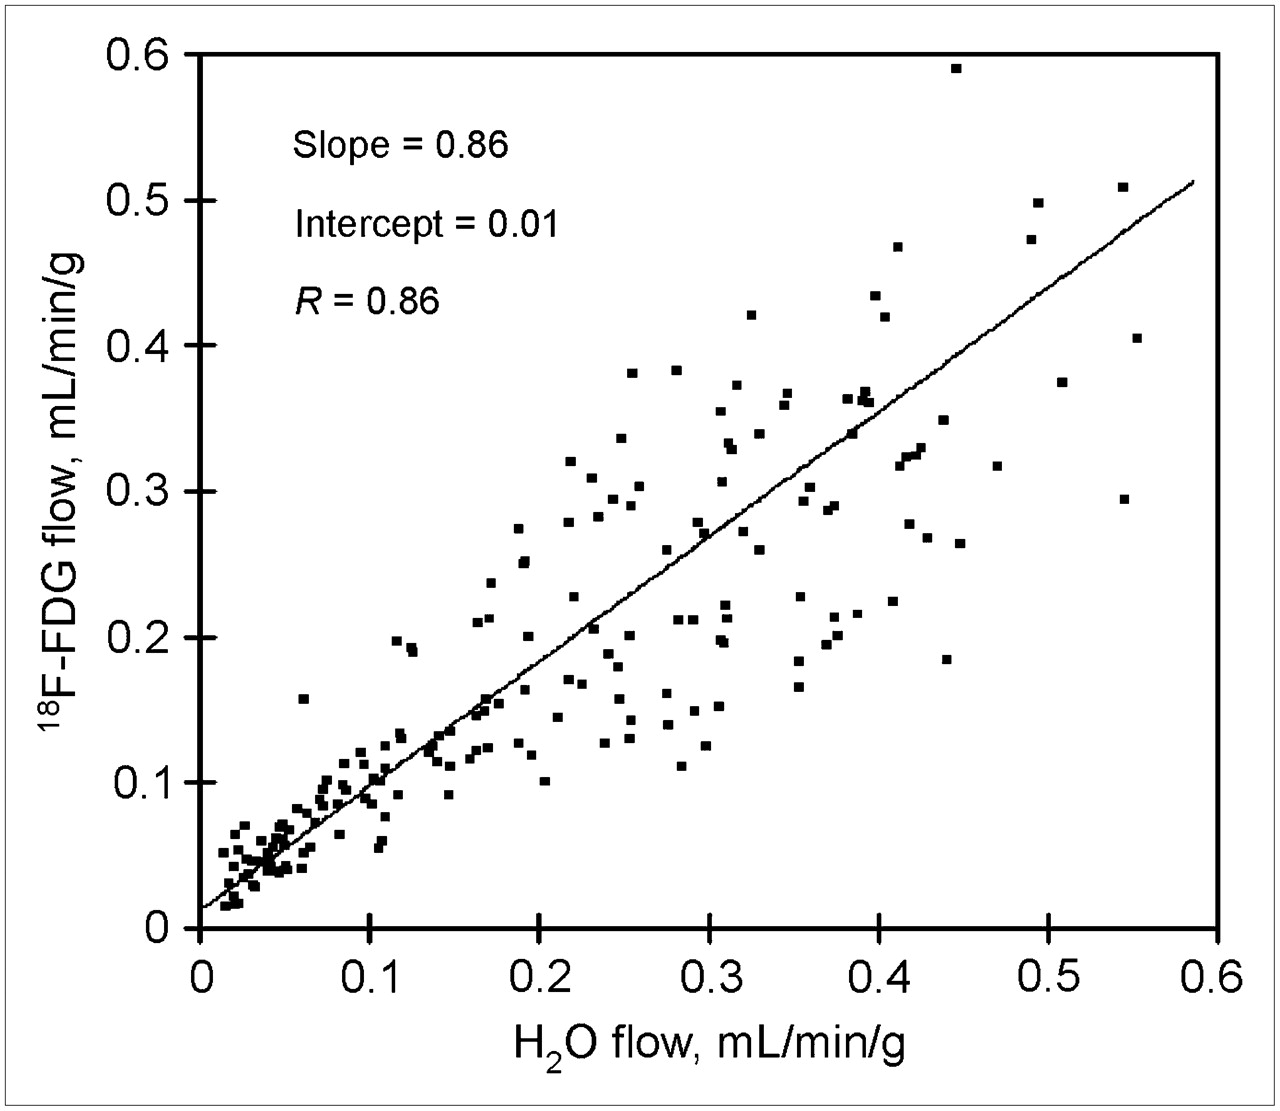
Blood flow estimates from the first-pass 18F-FDG images (early 18F-FDG images) and 15O images were obtained for each patient (Fig. 2). 18F-FDG estimated blood flow was linearly correlated with 15O-water estimates with a slope of 0.86 and an intercept of 0.01 (18F-FDG flow = 0.012 + [0.86 · 15O-water flow]). The R2 regression coefficient was 0.74 (R2 = 0.86), demonstrating a close positive correlation between the estimates. The first-pass extraction fraction of 18F-FDG relative to extraction of 15O-water averaged 0.86. Hence, 18F-FDG extraction in tumors was relatively high compared with 15O-water extraction, averaging only 14% less, indicating that 18F-FDG is a highly extracted tracer, during first pass, in malignant tissue. In general, as would be anticipated for a highly extracted tracer, the first-pass 18F-FDG blood flow estimates were closely correlated with the 15O-water estimates. In some cases in which tumors displayed very high metabolic rates, however, the first-pass extraction of 18F-FDG appeared to trend to artificially high values, although this was not statistically verifiable.

Correlation between 15O-water uptake (0–2 min) and first-pass 18F-FDG uptake (0–2 min) in various tumors of all patients. Data were fit to the equation: 18F-FDG flow = 0.012 + (0.86 · 15O-water flow) (n = 190 ROI pairs). Data include both treated and untreated patients.
Tseng et al. (26) have shown in human studies of breast cancers treated with chemotherapy that the ratio of 18F-FDG blood flow (K1 parameter in their 2-compartment model of 18F-FDG uptake) to 15O-water blood flow changes after treatment. We analyzed our data before treatment and after endostatin treatment (Table 1). Mean blood flow measured by 15O-water was unchanged before and after treatment. Mean blood flow measured by first-pass 18F-FDG did appear to trend upward, but this was not statistically verifiable. In contrast, the SUV did increase significantly after treatment, but no correlation was found between blood flow and SUV.
Comparison of Flow Estimates for Untreated and Treated Groups
The slope of the regression line between first-pass 18F-FDG flow and 15O-water flow was found to be 0.65 for the untreated group and 0.85 for the treated group (Table 1). The slope values compare favorably with the 18F-FDG K1 value to 15O-water flows by Tseng et al. (26) and Zasadny et al. (27).
Case Study: First-Pass 18F-FDG Blood Flow Imaging of Prostate Cancer with PET/CT
The practical utility of using first-pass 18F-FDG PET in a clinical setting was evaluated in one patient with prostate cancer in a preliminary “proof-of-principle” study. This is a noted difficult malignancy to accurately diagnose by PET. The patient was a 64-y-old man with a prostate-specific antigen level that increased from 2.9 to 4.1 ng/mL in 1 y. No palpable nodules were detected with a rectal examination of the prostate. An ultrasound-guided needle biopsy of the prostate was performed with 6 samples obtained from the right lobe and 6 samples obtained from the left lobe. Needle biopsy results revealed adenoma cancer in the left lobe with none detected in the right lobe. The Gleason score in the cancerous tissue of the left lobe ranged from 7 to 8. A standard CT scan of the prostate showed an enlarged prostate, but no lymph node involvement.
An 18F-FDG PET/CT scan was performed using first-pass 18F-FDG imaging of the prostate during the first 2 min after injection of the tracer. This was followed by a late scan for glucose metabolism after a delay of 30 min and a whole-body scan after that. Figure 3 shows combined PET/CT images of the prostate obtained during the first 2 min (Fig. 3A) and the delayed 18F-FDG image (Fig. 3B). The classic late image shows high levels of radioactivity in the bladder and the rectum (Fig. 3B). Prostate 18F-FDG uptake is marginally increased in the late image. In contrast, the early first-pass image of the prostate shows increased blood flow in both the left and the right lobes of the prostate (Fig. 3A). As anticipated for the first-pass 18F-FDG image, there is very little 18F-FDG in the bladder to interfere with imaging the prostate. Increased radiotracer is seen in the arteries. The patient subsequently underwent a radical prostatectomy. The pathology report revealed cancer in both lobes of the prostate with a Gleason score ranging from 7 to 8 in both lobes.
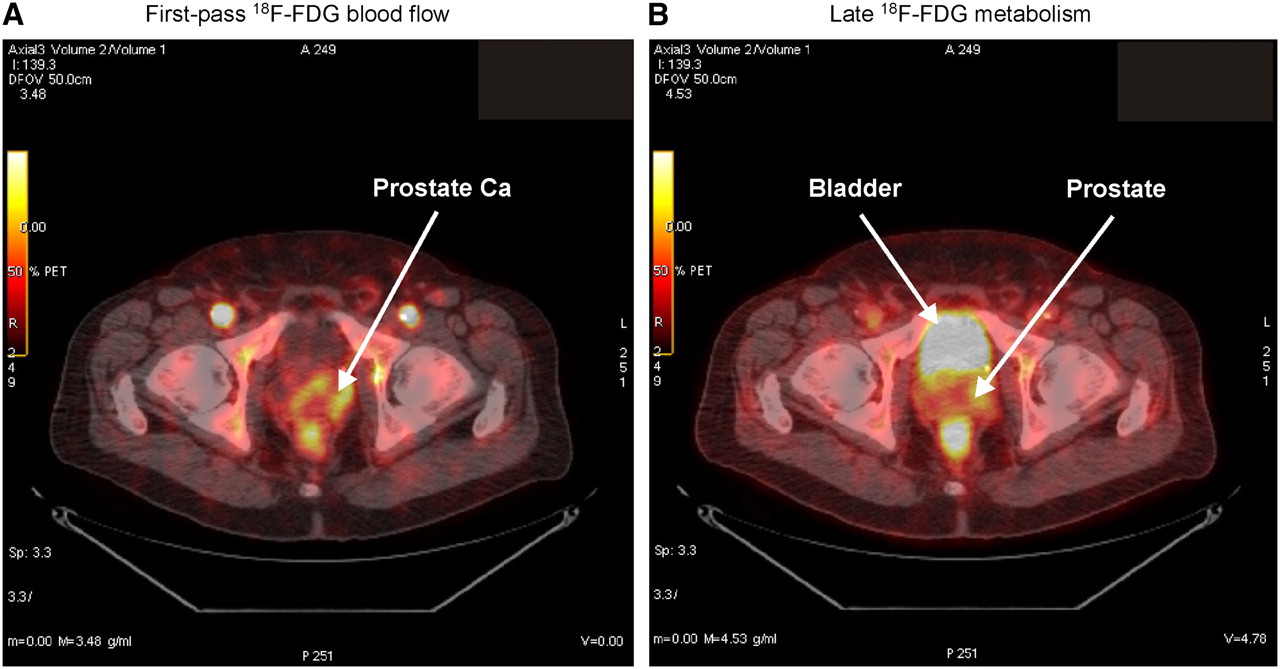
Case study using first-pass blood flow and late metabolic imaging of 18F-FDG PET scan of prostate cancer with 18F-FDG PET/CT. (A) Early (2 min) first-pass 18F-FDG scan for measurement of blood flow showing early uptake of 18F-FDG in prostate gland (Prostate Ca). (B) Late imaging of 18F-FDG metabolism (scan at 40 min) after injection of 18F-FDG.
The case study demonstrates proof-of-principle in using first-pass 18F-FDG blood flow as an index of blood flow to the prostate gland. The first-pass 18F-FDG blood flow analysis provided an early enhanced diagnosis of cancer in a tissue that is hard to image using the traditional late 18F-FDG imaging procedures.
DISCUSSION
Exciting Potential for Early 18F-FDG Images as Perfusion Indicator
The current study was designed to demonstrate that a simple 2-min scan method of imaging the first pass of 18F-FDG has the potential to provide an estimate of blood flow in tumors. Preliminary results from this study were first presented by Mullani et al. (9) and showed—to our knowledge, for the first time—the potential of using early 18F-FDG PET to provide an index of blood flow in human tumors. Subsequently, elegant studies by Tseng et al. (26) and Zasadny et al. (27) have shown that the flow component, K1, extracted from 18F-FDG dynamic imaging of breast cancer yields a good correlation to 15O-water measured blood flow. These studies of blood flow estimated from dynamic 18F-FDG uptake and that estimated with the more traditional 15O-water estimates provide strong support for the concept of using first-pass 18F-FDG images as a perfusion indicator. Because late 18F-FDG PET images are typically used to monitor metabolism, these observations suggest the exciting possibility of using 18F-FDG PET to measure both blood flow (early images) and metabolism (late images) in tumors in the same study using one injection of 18F-FDG.
Clinical Utility of Perfusion Images for Tumor Imaging
The ability to obtain both an index of tumor perfusion and metabolism from a single 18F-FDG PET study may be particularly advantageous in the clinical setting. In many tumors the aggressiveness of growth—and, hence, metabolism—is paralleled by increased tissue perfusion because of the neovascularization of the malignant tissue needed to support the growth of the tumor (28,29). As a consequence, many tumors are characterized by a functional coupling of blood flow and metabolism as evidenced by parallel increases in blood flow and tumor glucose metabolism as reported for numerous tumors, including those of the breast (27,30) and lung (31). In contrast, some tumors appear to display considerable variance between perfusion and metabolism with evidence of an uncoupling of blood flow from metabolism in specific cases (32), as recently reported for some head and neck cancers (33) and certain liver and metastatic colon cancers (34). Hence, in these cases it is important to be able to monitor both blood flow and metabolism to aid in the assessment of the type of cancer, the staging, or the planning of treatment regimens before therapy.
The diagnosis of certain types of tumors may also be greatly aided by early 18F-FDG imaging as a perfusion indicator, whereas standard static imaging of 18F-FDG uptake may have limited value. This may occur in cancers in which 18F-FDG uptake is variable or complicated because of 18F-FDG background uptake. We have shown an example of prostate cancer imaging with first-pass and late 18F-FDG imaging. Performing an initial measurement of blood flow during early first-pass imaging of 18F-FDG greatly reduces the background presence of 18F-FDG in the bladder and provides an estimate of blood flow in prostate cancer. Inaba (35) has measured prostate cancer blood flow using 15O-water and PET in humans. He found that prostatic blood flow averaged near 15.7 mL/min/100 g and increased to 29.4 mL/min/100 g in prostate cancer tissue. Benign prostatic hypertrophy had marginally increased blood flow relative to normal prostate tissue. Increased blood flow in prostate cancer tissue has been shown by CT contrast imaging to be approximately twice as high as that in normal prostate tissue (36,37). Therefore, a measure of blood flow in prostate cancer may have some clinical utility.
Limitations and Use of Early 18F-FDG Imaging
Although first-pass 18F-FDG imaging may have broad potential as a perfusion indicator in many tumors, the use of this marker as a perfusion indicator may not be applicable in all cases. Tseng et al. (26) has shown a change in the K1 rate constant after chemotherapy treatment. We also show a potential change in blood flow values for patients treated with endostatin (Table 1). Indeed, we and others (24,32) have shown that 18F-FDG uptake and blood flow can become uncoupled with antiangiogenic treatment. Thus, the application of a simple model to other studies should be undertaken with caution.
Because the early first-pass images of 18F-FDG could potentially include both the free and the trapped components of 18F-FDG, it is possible that—in tumors characterized by high metabolic rates—the first-pass 18F-FDG imaging may contain some trapped 18F-FDG that can lead to an overestimate of blood flow due to increased extraction in tumor cells. Hence, high 18F-FDG extraction by some tissues, or a change in the distribution volume of 18F-FDG in tumor tissue, may present challenges to using the simple first-pass 18F-FDG imaging as a perfusion indicator. A more robust dynamic imaging of the full uptake of 18F-FDG and appropriate kinetic models of 18F-FDG will be necessary to separate the flow component, K1, from the metabolic component of uptake.
CONCLUSION
We have shown, in this preliminary study, that in the absence of a typical perfusion tracer it is possible to obtain a measure of tumor perfusion by imaging the first-pass uptake of 18F-FDG by PET using a simple 2-min scan. Although this method may not be as accurate as measuring blood flow with a traditional flow tracer and dynamic imaging, the information obtained from the first-pass images may greatly enhance 18F-FDG PET assessments by obtaining an estimate of tumor perfusion to complement the late images of metabolism. This may be highly advantageous in diagnosis, staging, or managing treatment of malignancies.
Acknowledgments
This research was supported by U.S. Public Health grants U01 CA62461, U54 CA90810, and CCSG CA16672.
Footnotes
-
COPYRIGHT © 2008 by the Society of Nuclear Medicine, Inc.
References
- Received for publication November 1, 2007.
- Accepted for publication December 20, 2007.


Jump to section
Related Articles
Cited By...
- Quantitative Total-Body Imaging of Blood Flow with High-Temporal-Resolution Early Dynamic 18F-FDG PET Kinetic Modeling
- Quantitative Total-Body Imaging of Blood Flow with High Temporal Resolution Early Dynamic 18F-Fluorodeoxyglucose PET Kinetic Modeling
- Mapping 18F-FDG Kinetics Together with Patient-Specific Bootstrap Assessment of Uncertainties: An Illustration with Data from a PET/CT Scanner with a Long Axial Field of View
- High-Temporal-Resolution Lung Kinetic Modeling Using Total-Body Dynamic PET with Time-Delay and Dispersion Corrections
- Principles of Tracer Kinetic Analysis in Oncology, Part II: Examples and Future Directions
- Principles of Tracer Kinetic Analysis in Oncology, Part I: Principles and Overview of Methodology
- Total-Body Quantitative Parametric Imaging of Early Kinetics of 18F-FDG
- PennPET Explorer: Human Imaging on a Whole-Body Imager
- Reply: Semiquantification Limitations: FMTVDM(C)copysr Demonstrates Quantified Tumor Response to Treatment with Both Regional Blood Flow and Metabolic Changes
- Breast Cancer Blood Flow and Metabolism on Dual-Acquisition 18F-FDG PET: Correlation with Tumor Phenotype and Neoadjuvant Chemotherapy Response
- Sympathetic Innervation of Cold-Activated Brown and White Fat in Lean Young Adults
- 18F-FDG PET-Derived Tumor Blood Flow Changes After 1 Cycle of Neoadjuvant Chemotherapy Predicts Outcome in Triple-Negative Breast Cancer
- Getting the Most out of 18F-FDG PET Scans: The Predictive Value of 18F-FDG PET-Derived Blood Flow Estimates for Breast Cancer
- Progressing Toward a Cohesive Pediatric 18F-FDG PET/MR Protocol: Is Administration of Gadolinium Chelates Necessary?
- Role of Positron Emission Tomography for the Monitoring of Response to Therapy in Breast Cancer
- Effect of Small-Molecule Modification on Single-Cell Pharmacokinetics of PARP Inhibitors
- Noninvasive Quantitative Assessment of Pulmonary Blood Flow with 18F-FDG PET
- Early Dynamic 18F-FDG PET to Detect Hyperperfusion in Hepatocellular Carcinoma Liver Lesions
- Evaluation of Breast Tumor Blood Flow with Dynamic First-Pass 18F-FDG PET/CT: Comparison with Angiogenesis Markers and Prognostic Factors
- Synergistic Memory Impairment Through the Interaction of Chronic Cerebral Hypoperfusion and Amlyloid Toxicity in a Rat Model
- A Mouse Model Characterizing Features of Vascular Dementia With Hippocampal Atrophy * Supplemental Methods
- Monitoring Predominantly Cytostatic Treatment Response with 18F-FDG PET
- The Role of Radiotracer Imaging in the Diagnosis and Management of Patients with Breast Cancer: Part 2--Response to Therapy, Other Indications, and Future Directions