


Abstract
PET with [11C]-(R)-PK11195 is currently the modality of choice for the in vivo imaging of microglial activation in the human brain. In this work we devised a supervised clustering procedure and a new quantification methodology capable of producing binding potential (BP) estimates quantitatively comparable with those derived from plasma input with robust quantitative implementation at the pixel level. Methods: The new methodology uses predefined kinetic classes to extract a gray matter reference tissue without specific tracer binding and devoid of spurious signals (in particular, blood pool and muscle). Kinetic classes were derived from an historical database of 12 healthy control subjects and from 3 patients with Huntington's disease. BP estimates were obtained using rank-shaping exponential spectral analysis (RS-ESA) (both plasma and reference input) and the simplified reference tissue model (SRTM). Comparison between plasma- derived BPs and those produced with the new reference methodology was performed using 6 additional healthy control subjects. Reliability of the new methodology was performed on 4 test–retest studies of patients with Alzheimer's disease. Results: The new algorithm selected reference voxels in gray matter tissue avoiding regions with specific binding located, in particular, in the venous and arterial circulation. Using the new reference, BP values obtained using a plasma input and a reference input were in excellent agreement and highly correlated (r = 0.811, P < 10−5) when calculated with RS-ESA and less so (r = 0.507, P < 0.005) when SRTM was used. In the production of parametric maps, SRTM was used with the new reference extraction, resulting in test–retest variability (10.6%; mean ICC = 0.878) that was superior to that obtained using the previous unsupervised clustering approach (mean ICC = 0.596). Conclusion: Reference region modeling combined with supervised reference tissue extraction produces a robust and reproducible quantitative assessment of [11C]-(R)-PK11195 studies in the human brain.
A selective ligand for the peripheral benzodiazepine receptor (PBBS) is PK11195. The PBBS is a nuclear-encoded mitochondrial protein that is abundant in peripheral organs—particularly in adrenal glands, kidney, as well as hematogenous cells—but is present in the normal central nervous system only at low levels (1). The function of the PBBS is still in need of full elucidation but the receptor is known to play an important role in steroid synthesis and in the regulation of immunologic responses by mononuclear phagocytes (2).
In diseases of the central nervous system, a higher density of PBBS has been observed in macrophages and activated microglia, the intrinsic immune defense of the brain (3). Significant microglial activation occurs after mild-to-severe neuronal damage resulting from traumatic, inflammatory, degenerative, and neoplastic disease (3). Microglia, therefore, act as sensors for pathologic events, including subtle ones without any obvious structural damage (4), and are activated not only in the surroundings of focal lesions but also in the distant, anterograde and retrograde projection areas of the lesioned neural pathway and even in structurally normal transsynaptic areas (5,6).
The high selectivity for the PBBS has made PK11195 the ligand of choice for the in vivo imaging of activated microglia with PET. PET imaging with the molecular marker [11C]-(R)-PK11195 (7) now provides an indicator of active disease in the brain with wide applicability (3).
MATERIALS AND METHODS
Methodologic Aspects of PK11195 PET Studies
Quantification of [11C]-(R)-PK11195 PET studies has so far been approached either by normalization of the uptake to a reference region or by application of the simplified reference tissue model (SRTM) (8). Full kinetic characterization of [11C]-(R)-PK11195 with measurement of the arterial input function has been reported only recently with the application of the appropriate 2-tissue compartments, 4-rate-constants model (Fig. 1) (9).

Compartmental model for [11C]-(R)-PK11195 assumes a target region with a specific bound fraction and a compartment for a free fraction plus possibly a nonspecific bound fraction (NS) that equilibrates fast with the unbound fraction. The (ideal) reference region should be devoid of PBBSs and, therefore, be fitted best with a 1-tissue compartment model. K1 and k2 represent first-order rate constants for transport of ligand from plasma to tissue and vice versa (K1′ and k2′ for reference region); k3 and k4 represent rate constants between the free and specifically bound compartments in tissue.
Further work has shown that blood input modeling provides binding potentials (BP = k3/k4) that correlate significantly with those estimated with the simplified reference region model (10). However, the same studies highlighted large differences between the BP estimates obtained from blood input modeling (BP ∼ 1.6 in cortical gray matter in controls) and those calculated with a tissue reference (BP ∼ 0.07–0.46) (9). This difference could have resulted from the presence of significant nonspecific binding in brain tissue (7). However, BP values obtained from plasma input and corrected for nonspecific binding calculated from the reference region were still higher than SRTM BP values indicating, among several possible data and model deficiencies, the presence of specific binding in the reference used (10).
The use of a tissue input function may provide practical advantages, but the selection of a reference region devoid of PBBS is a challenging task. Microglia are distributed ubiquitously throughout the brain and their activation may occur along projections into healthy-appearing tissue (3). Furthermore, activation of microglia is associated with aging even in the normal brain (11).
The use of postmortem data for the selection of appropriate reference regions devoid of active microglia may be valuable in specific diseases and can increase [11C]-(R)-PK11195 sensitivity even with small sample sizes (12). When an informed choice is not possible, an alternative approach is the use of cluster analysis that segments voxels into classes on the basis of their time courses and selects as reference the class of voxels that exhibits the kinetic behavior closest to that of gray matter in healthy controls (13).
Improved Reference Region Extraction: Scope and Rationale
Here we present an improved clustering algorithm for the automatic extraction of a reference tissue region for the quantification of [11C]-(R)-PK11195 PET studies. Improvement was sought on 3 different grounds. The first aim was to increase the reliability of current clustering methodology that is based on unsupervised tissue classification. An unsupervised clustering algorithm defines tissue classes in a data-dependent manner according to a very generic model (e.g., a mixture of gaussian distributions) that may not accurately describe the underlying physiology and, therefore, introduce instability or inaccuracies in the grouping.
Second, we considered an algorithmic design that aimed at the extraction of a proper reference region, whereby “proper” meant that its use as input function would produce BP values comparable with those obtained with a blood input function.
Third, we considered further methodologic developments in the BP calculations that could accommodate the improved modeling of the reference region and produce robust and reproducible BP estimates.
Supervised Clustering of [11C]-(R)-PK11195 Studies
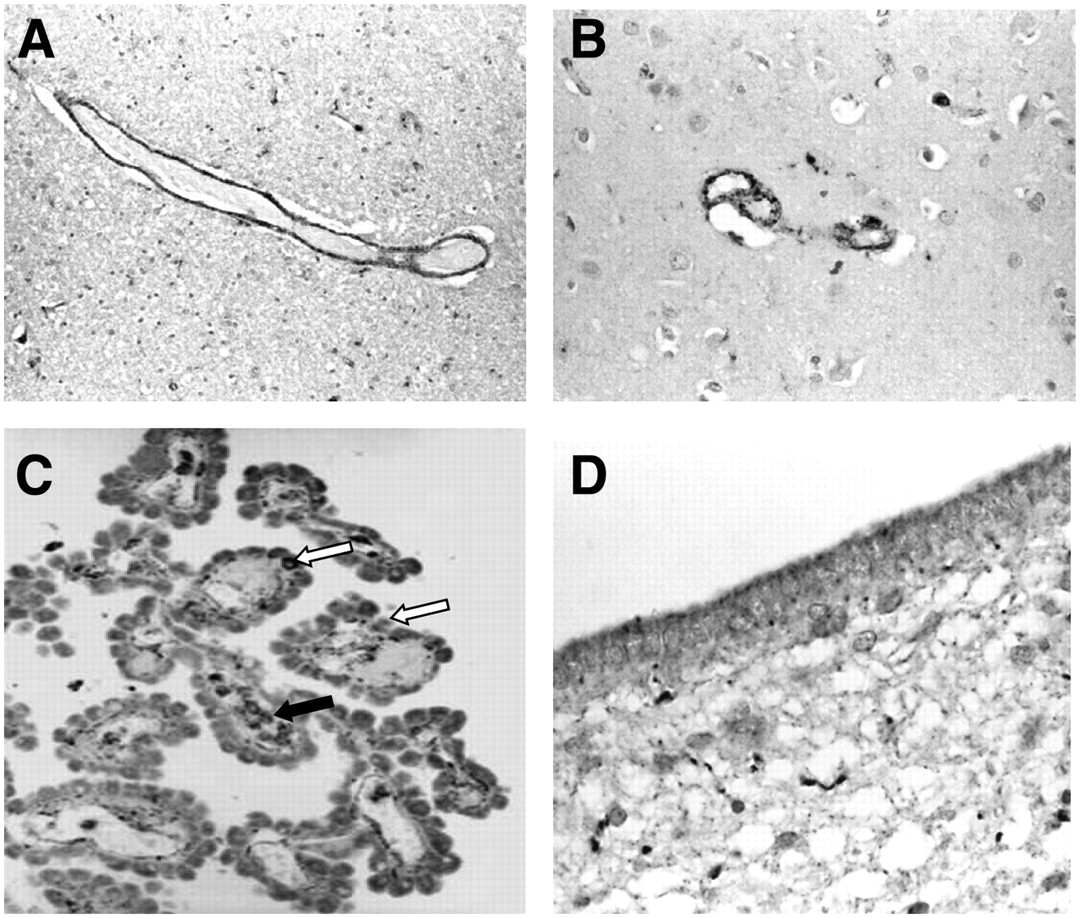
In the normal brain, immunocytochemical staining suggests the presence of PBBS in muscle cells of small- and medium-sized intraparenchymal arteries and in the bigger leptomeningeal arteries; in perivascular macrophages, lymphocytes, and neutrophils; in the choroid plexus; and in the ependyma (Fig. 2). Other regions with a rich density of receptors include the meninges, olfactory bulbs, and the pituitary gland (3). Given the limited spatial resolution of PET images, specific binding in these areas is a likely source of diffuse low-level [11C]-(R)-PK11195−specific signal that may easily affect the reference region even in healthy control subjects.

Immunostaining of PBBS in normal brain (monoclonal, clone 8D7 [kindly supplied by Dr. Pier Casellas, Department of Immunology–Oncology, Sanofi Synthelabo, Montpellier, France], dilution 1:200). Expression of PBBS is seen in smooth muscle cells of tunica media of medium-sized artery in cerebellar white matter (A) and of small cortical artery of frontal cortex (B). (C) PBBS expression is seen in some cuboidal cells (white arrows) of choroid plexus and in some macrophages in underlying fibrovascular core (black arrow). (D) Ependymal cells show expression of PBBS, which is mainly localized in apical cytoplasm.
This observation commanded the use of a supervised clustering approach to extract a gray matter reference region filtered from unwanted contributions from the described sources. At the same time, the use of a supervised approach was expected to increase the robustness of the region extraction as demonstrated in previous applications (14).
Scanning Protocol
All [11C]-(R)-PK11195 studies were performed on an ECAT EXACT 3D (CTI/Siemens) PET camera with 23.4-cm axial field of view, 95 transaxial planes (15). To reduce the effect of activity outside the direct field of view in brain scans, the tomograph was equipped with annular side shielding. A transmission scan was acquired before every emission using a single rotating photon point source of 150 MBq of 137Cs for subsequent attenuation correction and scatter correction. The spatial resolution of the images reconstructed using the reprojection algorithm with the ramp and Colsher filters set to Nyquist frequency is close to isotropic: 5.1-mm (full width at half maximum [FWHM]) transaxially and 5.9-mm FWHM axially (15).
Subjects consisted of 12 healthy control subjects injected with 185 MBq without arterial blood sampling, 6 healthy controls injected with 296 MBq for whom an arterial input function was available, 3 patients with Huntington's disease (HD) (296 MBq injected) (16), and 4 patients with Alzheimer's disease (AD) scanned twice (296 MBq injected for each scan) with a maximum time interval of 6 wk (no blood sampling available for the patient group). [11C]-(R)-PK11195 was provided by Hammersmith Imanet plc.
Thirty seconds after the start of the emission scan, [11C]-(R)-PK11195 was infused intravenously over 10 s in 5 mL physiologic saline. Emission data were then acquired over 60 min in list mode and rebinned as 18 time frames (30-s background frame, 1 × 15-s frame, 1 × 5-s frame, 1 × 10-s frame, 1 × 30-s frame, 4 × 60-s frames, 7 × 300-s frames, and 2 × 600-s frames). Subjects were placed in the scanner oriented parallel to the orbitomeatal line, and head positioning was monitored throughout the scan. Volumetric T1-weighted MR images were obtained on a 1.0-T Picker HPQ scanner (Picker International) at the Robert Steiner MR Unit, Hammersmith Hospital, London.
Ethical approval was granted by the Hammersmith Hospitals Trust Ethics Committee, and permission to administer radioisotopes was granted by the Administration of Radioactive Substances Advisory Committee of the Department of Health, U.K. Informed written consent was obtained from all patients and healthy volunteers.
Blood Sampling Protocol
Blood input data were available for 6 control subjects. For these subjects, arterial whole-blood activity was monitored continuously for the first 15 min of the scan with a bismuth germanate coincidence detector at a flow rate of 5 mL/min (17). Eight discrete arterial blood samples were taken at 5, 10, 15, 20, 30, 40, 50, and 60 min into heparinized syringes. The activity concentrations of the whole blood and plasma were measured.
Five plasma samples per scan (at 5, 10, 20, 40, and 60 min) were analyzed for metabolites using a semiautomated system with online solid-phase extraction followed by reverse-phase chromatography with online radioactivity and ultraviolet detectors and integration system (18).
For the generation of the plasma input functions, the time course of the plasma-to-blood ratio obtained from the 8 discrete arterial samples was fitted to a model. On average, the ratio started at ∼1.4 and steadily decreased to ∼1.3 at 60 min, and the function of choice was the straight line: Eq. 1where POB(t) is the plasma over blood ratio, p0 and p1 are the coefficients of the linear model, and t is time.
Next, the measurement of the arterial whole-blood activity obtained from the continuous detector system was multiplied with that ratio to obtain a total plasma activity curve for the first 15 min of the scan. This curve was then combined with the discrete plasma activity concentration measurements at 20, 30, 40, 50, and 60 min to form an input function describing the total plasma activity concentration for the entire scan.
Finally, the input function of the activity concentration due to unmetabolized [11C]-(R)-PK11195 in plasma was created by multiplying the total plasma activity input function with the function obtained from the fit of the model for the parent fraction in plasma with the 5 measurements of the parent compound during the scan. The mathematic model for the description of the amount of parent compound in plasma was the following equation: Eq. 2with qi > 0.
This function describes an exponential approach to a falling straight line, beginning at 1 for t = 0.
Data Processing
The clustering code described in the following sections was implemented using Matlab (The Mathworks Inc.) on a SUN Ultra10 workstation (Sun Microsystems, Inc.). Statistical parametric mapping SPM2 (Functional Imaging Laboratory, Wellcome Department of Imaging Neuroscience, University College London, London) was used for PET/PET and PET/MRI coregistration, normalization to the MNI/ICBM152 space (MNI is Montreal Neurological Institute. ICBM is International Consortium for Brain Mapping), as well as MRI segmentation. An in-house package for tracer kinetic modeling written in Matlab was used for the kinetic analysis of the time–activity curves and blood data processing. Parametric maps of BP values using SRTM were calculated using the software package RPM written in Matlab (19). Statistical analysis of region-of-interest (ROI) values was performed in SPSS version 13 (SPSS Inc.).
Algorithm Implementation
The supervised clustering algorithm developed for the analysis of dynamic [11C]-(R)-PK11195 data consisted of 3 elements:
An input normalization procedure to scale each volume of the dynamic sequence.
A set of predefined kinetic classes.
A regression procedure to calculate the contribution of each kinetic class to each pixel's kinetic.
Dynamic studies were normalized by subtracting from each frame its mean and dividing it by its SD to create a unit input (14). This created for each pixel i the normalized kinetic  for the N pixels in the PET volume. Six kinetic classes were predefined: nonspecific gray matter, nonspecific white matter, pathologic PBBS binding, blood pool, skull, and muscle. If
  is the normalized kinetic for class j, where j = 1, …, 6, the supervised clustering algorithm modeled the kinetic of each pixel as a weighted linear combination of the class kinetics as:
 Eq. 3with wij ≥ 0.
Because the kinetic classes  are not orthogonal, the weights wij were constrained to be positive by solving Equation 3 with the nonnegative least-squares algorithm (20).
Solution of Equation 3 created a volumetric map of weights wij for each class j. The reference region time–activity curve R1(t) (where j = 1 refers to the gray matter class) was finally calculated as a weighted average of the (unnormalized) pixel time–activity curves as: Eq. 4
Eq. 4
Definition of Classes 1 and 2: Normal Gray and White Matter
Gray and white matter kinetics in healthy brain were extracted from 12 control subjects belonging to the Unit's normal database. Gray and white matter maps were obtained from the segmented MRI volume and then thresholded (only map values > 90% of maximum value were retained) to minimize the effect of partial volume. These maps were then coregistered to the dynamic scans and multiplied with them to obtain the normalized time courses that were then averaged to obtain the class average normalized time–activity curve.
Definition of Class 3: Pathologic PBBS Binding
To define the kinetic class specific for tissue with intense microglia activation we considered 3 symptomatic patients with HD. All 3 patients had genetically proven disease with an expanded CAG repeat in the IT15 gene on chromosome 4.
Time–activity curves were defined on the striatum and globus pallidus that have well-documented microglia activity in the disease (16,21) and that were hyperintense on the PET scans (weighted summed average radioactivity images) of these subjects.
Definition of Classes 4, 5, and 6: Blood Pool, Muscle, and Skull
The average time–activity curve specific for the blood fraction was obtained by manually drawing an ROI on the venous sinus of the 12 healthy subjects. Intense signal was identified in muscle and a class kinetic for this tissue was obtained by drawing an ROI on the sternomastoid muscle. A class was also defined for the kinetic of the skull by manually drawing ROIs directly on the PET image.
Validation: Comparison with Blood Input Modeling
The first part of the validation consisted of the comparison between the BP values obtained with blood modeling and those obtained with the reference region extracted by the supervised clustering. Six control subjects were used for whom arterial sampling of the input function was available.
Whole gray and white matter were extracted by segmentation of the MRI volume and then coregistered to the PET. The kinetics of these regions, which have a high signal-to-noise ratio, were inspected using exponential spectral analysis (ESA) (22). ESA basis functions spanned the range from 10 s to 60 min. Regions were also manually drawn on the MR image on cerebellum, thalamus, and parietal cortex and the respective time–activity curve extracted from the matched PET volumes.
BP estimates for both sets of regions were calculated using the plasma input function with the formula: Eq. 5where Vtg and Vref are the volumes of distribution for the target and reference region, respectively, and Vref is used as an estimate of the volume of distribution of the free and nonspecifically bound tracer. The reference region used was the one obtained by the supervised clustering. Vtg and Vref were calculated using rank-shaping regularized ESA (RS-ESA) (23). RS-ESA is a Bayesian development of ESA that does not rely on the nonnegativity constraints of ESA and produces reliable estimates of volumes of distribution for both plasma and reference modeling. RS-ESA reaches an effective compromise between the reliability of the estimates obtained by compartmental models with the flexibility of SA that does not require a predefined compartmental structure. BP estimates were also obtained using the reference input by the formula (24):
 Eq. 6where
  is the volume of distribution in the target region calculated with RS-ESA using the input extracted by the clustering algorithm. Note that RS-ESA incorporated a blood time–activity curve in the functional base when plasma input was used but obviously this was not possible using a reference tissue input. However, this is not expected to affect the BP estimate significantly. The fraction of signal coming from blood in PK11195 studies is no greater than in any other tracer even at late times because, although the first-pass extraction in brain is low, there is very large uptake of the tracer in peripheral organs (lung, heart, liver, and kidneys).
Finally, BP estimates were calculated using SRTM and the reference region extracted by the supervised algorithm for comparison.
Validation: Test–Retest Reproducibility
The second part of the validation consisted of the assessment of the reproducibility of supervised clustering in comparison with the previous unsupervised approach. We used a set of test–retest data that consisted of 4 subjects with AD scanned twice at an interval of <6 wk. Arterial input data were not available for this cohort. To reproduce a current processing protocol of the Unit, parametric maps were obtained first and ROIs were placed later after normalization into MNI space and application of the latest version of an ROI maximum-probability brain atlas (25). The atlas was individualized for each subject by convolving it with the subject's thresholded gray matter map. ROI sampling included hippocampus, amygdala, cerebellum, lateral occipital lobe, anterior and posterior cingulate gyrus, middle frontal gyrus, posterior temporal lobe, parietal cortex, putamen, thalamus (all sampled separately on the left and right), and brain stem.
Parametric maps were produced using both RS-ESA and SRTM. Reproducibility of the 2 clustering methods was assessed by calculating the test–retest variability and the intraclass correlation coefficient (ICC).
RESULTS
Supervised Clustering and Reference Region Extraction
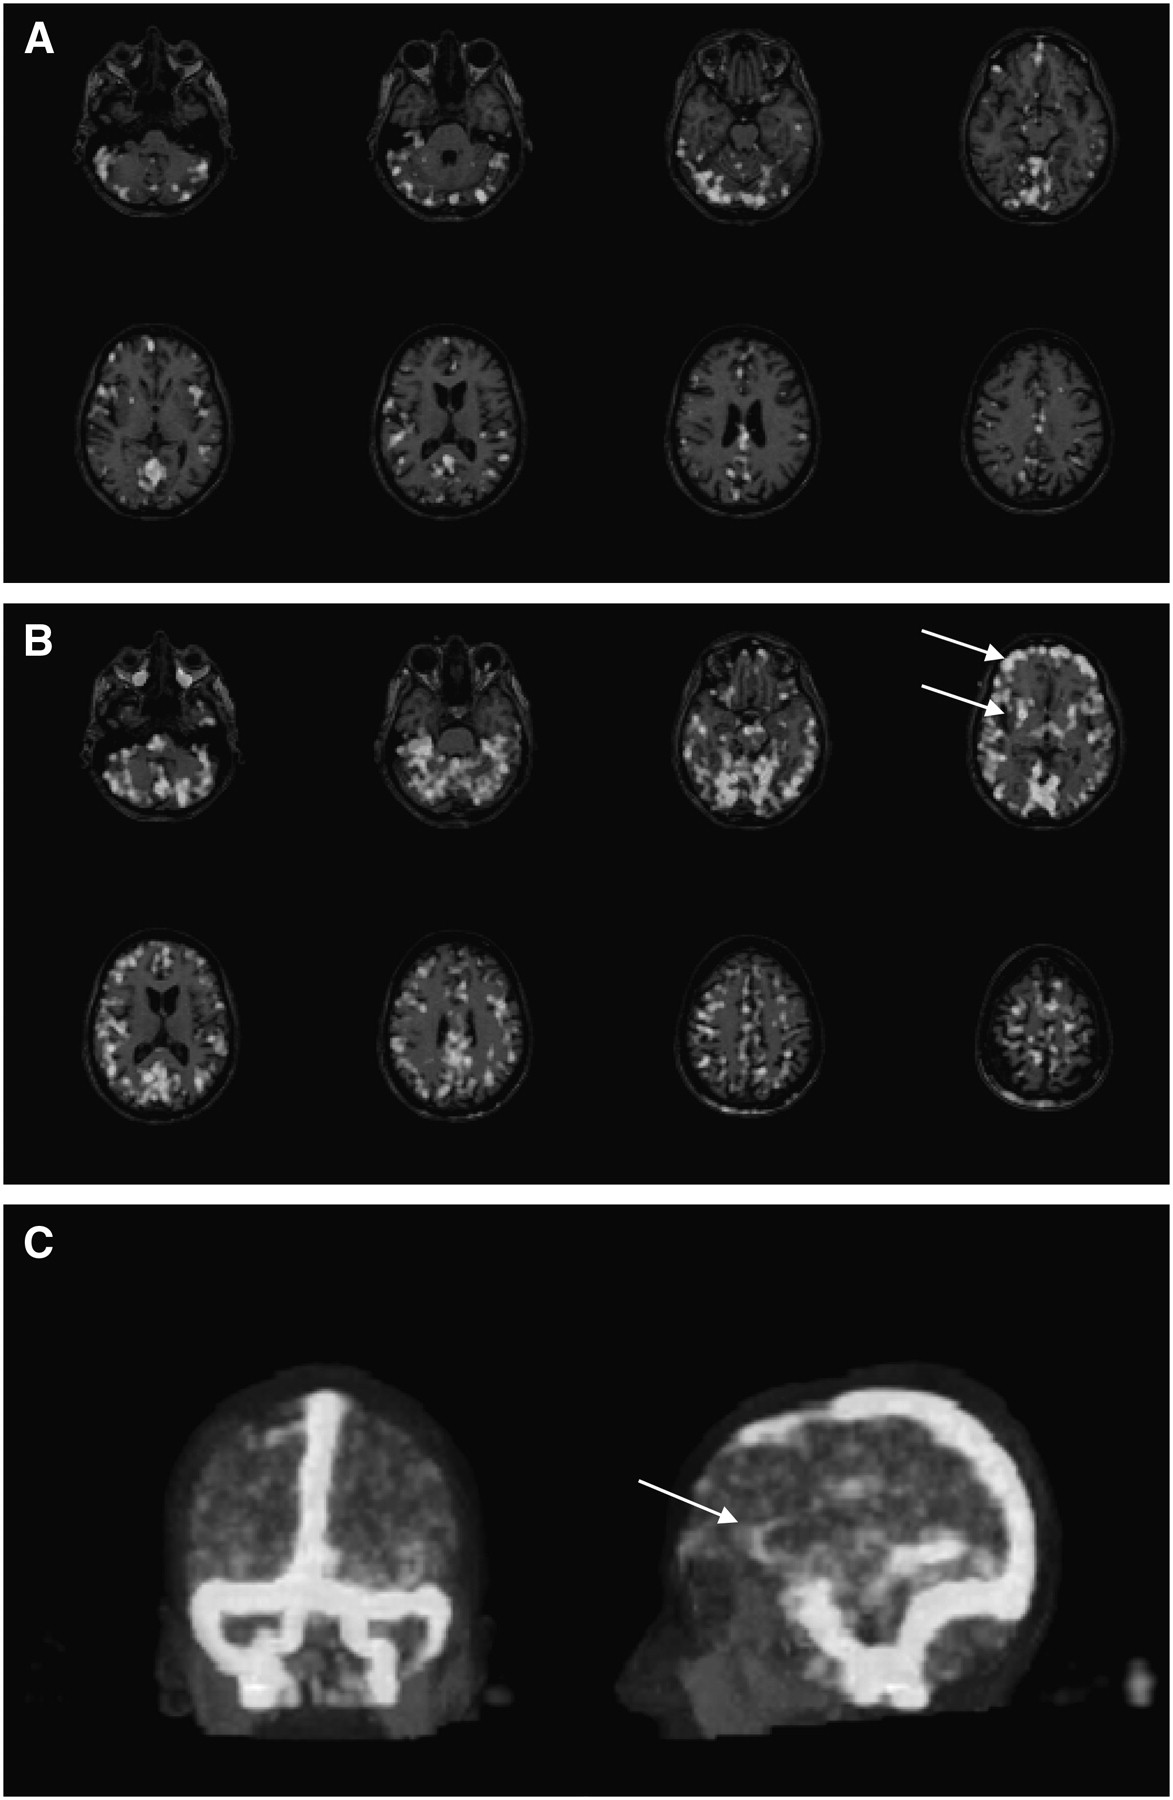
The performance of the supervised clustering is epitomized by the results for one of the 3 HD patients. The supervised algorithm selects as reference region a set of gray matter voxels, mostly in the cerebellum but also in the cerebral cortex (Fig. 3A). The algorithm clusters into the PBBS-specific binding class regions, where high binding is expected in HD, such as striatum and frontal cortex (Fig. 3B). The algorithm also identifies large areas with significant signal coming from the blood fraction and is able to reconstruct a remarkably clear picture of the blood vessels (Fig. 3C), where sinuses and even the major arteries can be clearly identified.

HD patient. (A) Map of gray matter reference region extracted by supervised algorithm as overlaid on the coregistered MR image. (B) Map of high PBBS density class. It includes voxels belonging to striatum and frontal cortex (arrows), where microglia activation is expected. (C) Maximum-intensity rendering of blood fraction cluster. Both posterior (left) and lateral (right) views are shown. Note clear detection of venous system but also of major arteries (arrow points to anterior cerebral artery).
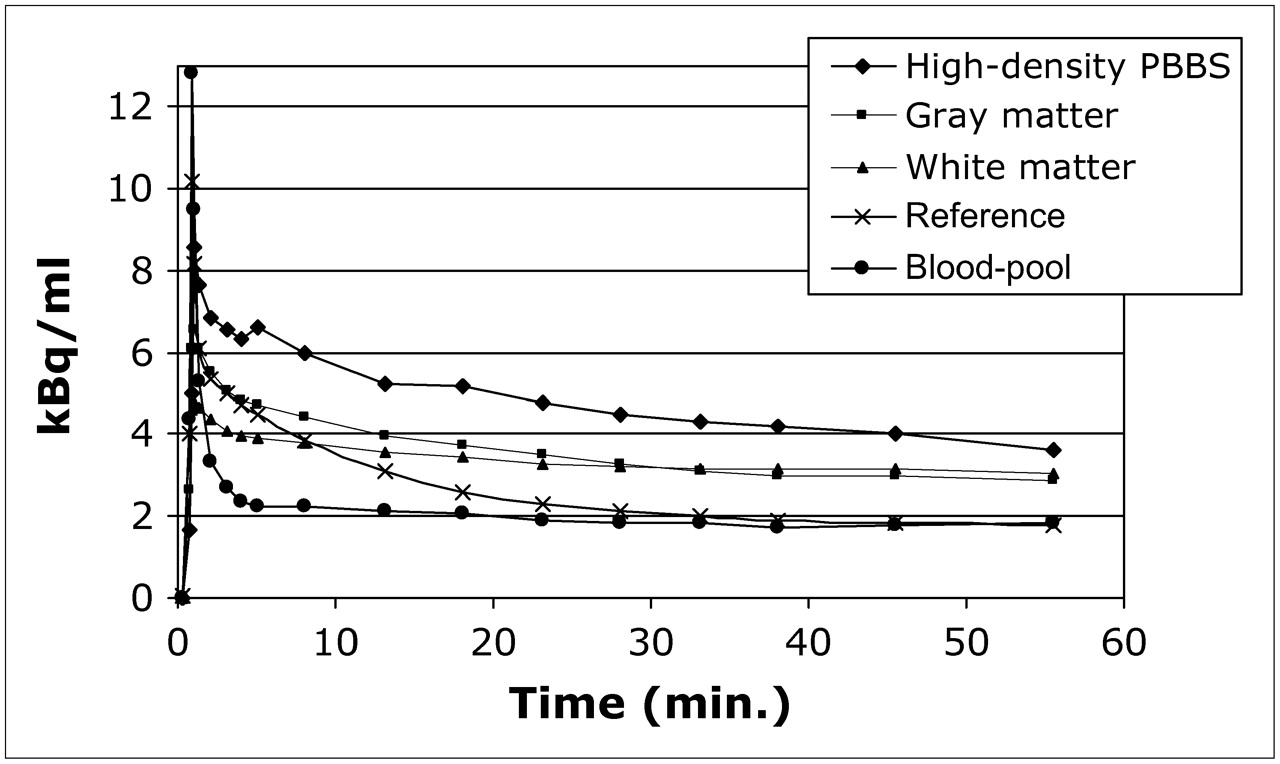
Figure 4 illustrates, for the same subject as in Figure 3, the time–activity curves of an ROI averaged over putamen, caudate, and globus pallidus, where strong specific signal was expected, the time–activity curves of whole gray matter and whole white matter, and the time–activity curves of the gray matter reference region and blood pool extracted by the supervised clustering. Figure 4 suggests that the time–activity curve of the supervised region is filtered from the contributions of specific binding and white matter but also from signal coming from the blood pool. Indeed, it is noticeable that the kinetic of the blood pool, after the initial fast clearance, levels at a steady, if not slowly, increasing level. This suggests the presence of a slowly equilibrating component in the vasculature and, given the steady clearance of radioactivity (parent tracer and metabolites) measured from arterial blood, it is consistent with binding to the vasculature that can be eminently identified by immunostaining.

Time–activity curves extracted from [11C]-(R)-PK11195 dynamic scan of HD patient. ROIs were drawn on areas where high density of PBBS related to microglia activation was expected (caudate, putamen, and globus pallidus), whole gray and white matter. Activity in gray matter reference region and in blood fraction region as extracted by supervised clustering is illustrated. Time–activity curves are decay corrected.
These findings were repeated in the other 2 patients with HD. The considerable signal in the blood pool was common to all studies examined, both healthy control subjects and patients.
Comparison Between Reference Input and Plasma Input Modeling
Blood input data were used initially to confirm the presence of a slowly equilibrating kinetic component in brain tissues. Figure 5 shows the kinetic components extracted by ESA on the whole gray matter of healthy volunteers. The result is shown for 2 subjects to illustrate its consistency. Very similar results were obtained in all other control subjects. It is clear from Figure 5 that ESA detects a slowly increasing kinetic component that corresponds to ∼75% of the total radioactivity at 60 min. Furthermore, Figure 6 illustrates for the same 2 subjects how—by subtracting from the whole gray matter time–activity curve the slow component extracted by ESA—one obtains a time–activity curve that is comparable with the one of the reference regions obtained by the supervised clustering algorithm. This suggests that the supervised clustering algorithm selects as reference region gray matter voxels that are distant from the vasculature, where the slow kinetic component is prominent. This kinetic component is much slower than the one we apportion to microglia but is very similar to the kinetic of PK11195 previously reported in the heart (26). This is consistent with either different transport rates of the tracer or, more likely, different affinities of the PBBS in endothelium and muscle.

Results of application of ESA with blood input function to time–activity curve of whole normal gray matter for 2 healthy control subjects. Time–activity curves are decay corrected. Also shown are ESA fit to data (squares), kinetic components extracted (continuous lines), plus slowly equilibrating component (dashed line) that, by end of scan, accounts for ∼75% of total radioactivity.
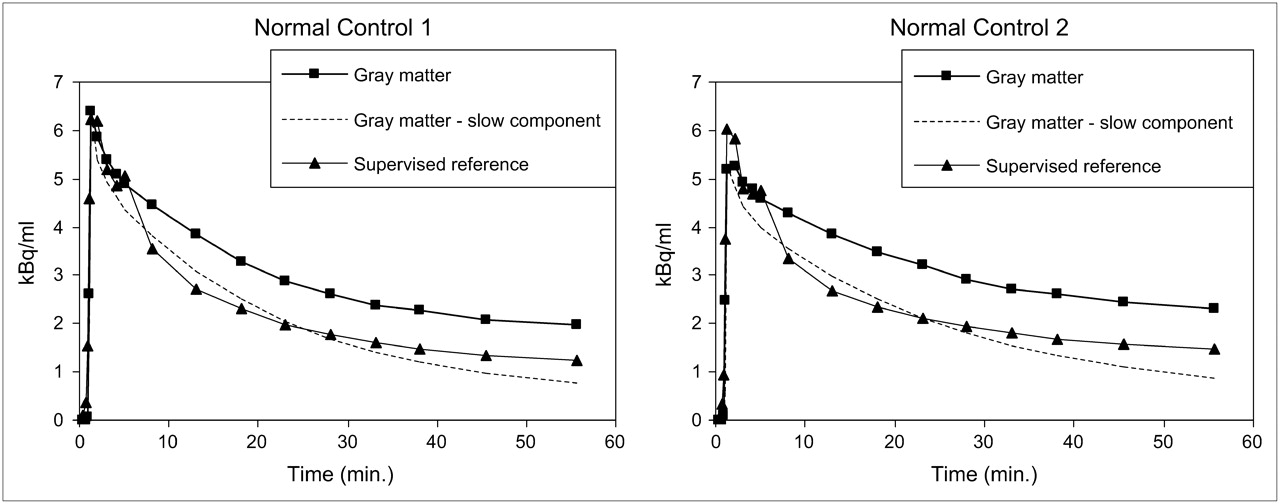
For the same subjects as in Figure 7, the slowly equilibrating component of vascular origin was subtracted from the whole gray matter time–activity curve (squares), producing a time–activity curve (dashed line) that was comparable with the time–activity curve of reference region extracted by supervised clustering method (triangles). The ability of the supervised methodology to filter out pixels with significant endothelial binding is illustrated.
This new finding makes the compartmental structure of the kinetic model for [11C]-(R)-PK11195 quite complex, as it now requires an additional tissue compartment for the specific binding in the vasculature. This further source of specific binding, plus the expected significant amount of nonspecific binding (7), renders the direct estimation of BP values from a compartmental model quite unattractive. However, the ability to extract a valid reference region with no specific binding and the use of RS-ESA, which can calculate robust estimates of the volume of distribution with no prerequisite of assuming a particular compartmental structure, make the task of BP estimation for both plasma and reference region quite straightforward through application of Equations 5 and 6. Using this approach we obtained a very close agreement between the BP estimates obtained with the reference region and the plasma input function as illustrated Table 1. Note the low values of BP for white matter, clustered around 0 and therefore including negative values, which were expected given the lack of PBBS in normal white matter and the lower vascular density. Mean values for cortical gray matter were 0.26 for plasma-derived BPs, and 0.19 for reference-derived BPs, which are physiologically meaningful given the overall low density of PBBS in the normal brain. Mean values were highest in the thalamus, where increased PBBS density is expected in elderly control subjects (27). Note that ESA did not detect a significant endothelial component in the thalamic areas.
BP Values for 6 Healthy Control Subjects
Correlation between the reference-derived and plasma input−derived BPs was also high (r = 0.811, P < 10−5), as illustrated in the scatter plot in Figure 7A.
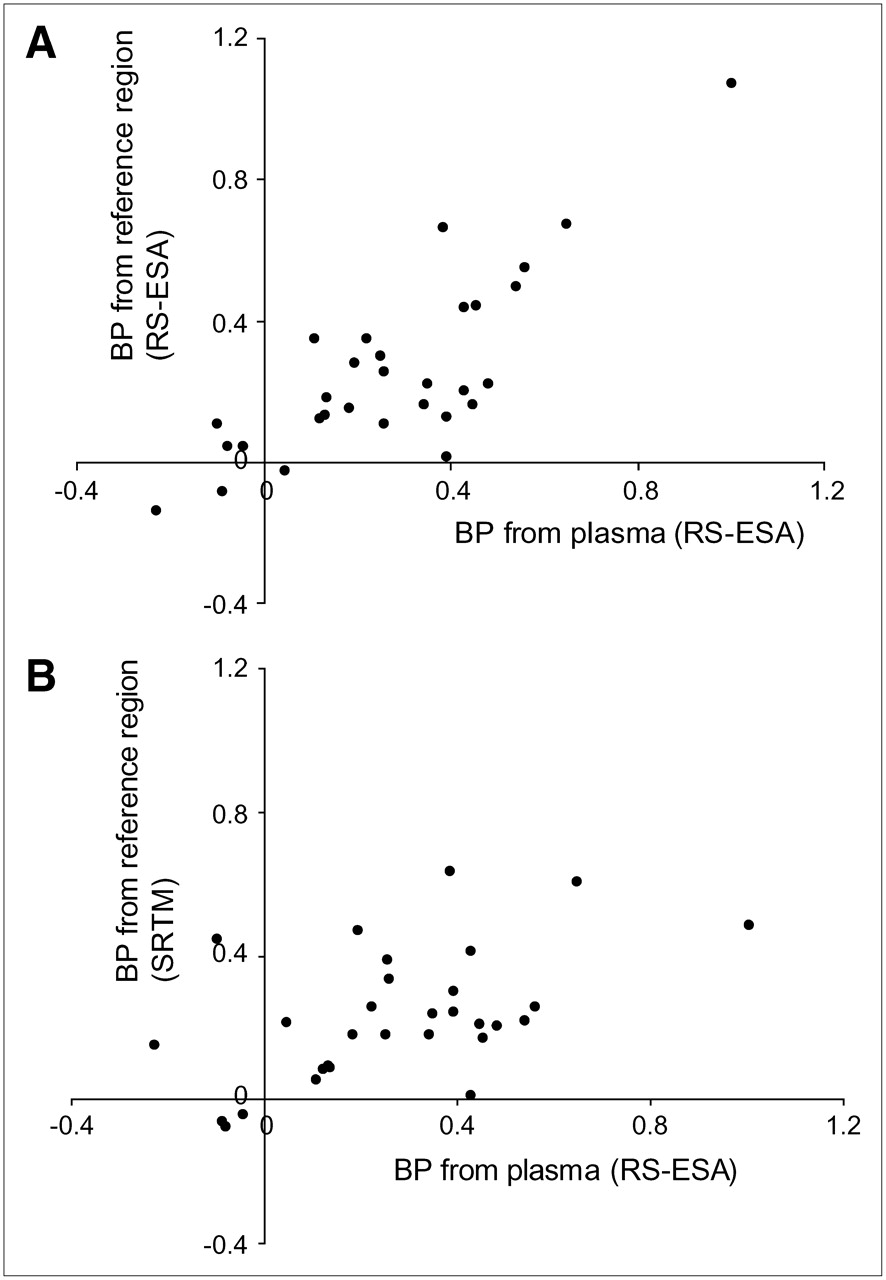
Correlation between reference region-derived and plasma-derived BP values. Reference region was extracted by supervised algorithm. BP values with reference region input were calculated using RS-ESA (A) and SRTM (B). In the case of RS-ESA, there was very close agreement and high correlation (r = 0.811, P < 10−5) between BP values calculated by reference tissue input and those derived from plasma input. SRTM consistently underestimated BP values and correlation with plasma-derived measures was poorer (r = 0.507, P = 0.004).
In this ROI analysis, the simple modeling structure of SRTM lacked the degrees of freedom to describe time–activity curves with high signal-to-noise ratios and the fits were poor. Consequently, there was little correspondence between SRTM-derived BPs and plasma-derived BPs (Table 1), and correlation between the 2 measures was lower (r = 0.507, P < 0.004; Fig. 7B). In particular, SRTM overestimated BPs in white matter (Table 1), due to the inability of the model to cope with the irreducible spillover of signal from gray matter caused by imperfect segmentation. Note that percentage errors for the estimates of the volumes of distributions were low for both RS-ESA and SRTM (∼1.5% for large regions such as cortex and cerebellum, ∼3% for thalamus).
Validation: Test–Retest Reproducibility
The final validation consisted of the comparison of the reproducibility of the new reference region extraction with that obtained through the unsupervised algorithm (13). Both SRTM and RS-ESA were used to generate parametric maps. RS-ESA performed poorly in the pixel-by-pixel estimation, producing maps with high variability (data not shown). SRTM's simpler structure instead performed well with the high noise levels and the less heterogeneous signal at the pixel level and was selected as the better compromise for the estimation of parametric maps. Therefore, only SRTM results are reported.
Tables 2 and 3 show results for the 4 AD subjects injected with 296 MBq for whom test–retest data were available in terms of mean value, mean of the differences between the first and second scan, percentage mean difference, and the ICC.
Test–Retest BP Values and ICC Obtained Using Reference Region Extracted by Unsupervised Clustering Algorithm
Test–Retest BP Values and ICC Obtained Using Reference Region Extracted by Supervised Clustering Algorithm
Table 2 reports the reproducibility results for SRTM where the reference was extracted with the unsupervised clustering. Care must be taken in the interpretation of this table: Because the reference region selected by the unsupervised algorithm contained specific binding, BP values obtained by SRTM in this case were close to zero if not negative. For those regions with a mean value around 0, the percentage mean difference was therefore abnormally high but is included for completeness. Reproducibility can be better appreciated by looking at the absolute mean differences and at the ICC values.
Regional ICCs were 0.596, on average, for the BPs obtained using the unsupervised clustering methodology. This value must be compared with the average ICC obtained using the supervised reference extraction—that is, 0.878—as shown in Table 3. In this table, given that BP values are higher, fractional mean differences are more informative and equal to 10.6% on average.
DISCUSSION
One peculiar aspect of [11C]-(R)-PK11195 studies in brain is the very scarce presence of the PBBS in the normal brain. This renders the modeling of this tracer particularly difficult because effects of no interest such as tissue heterogeneity and vascular signal become predominant, whereas the abundant presence of the PBBS in the periphery affects the availability of [11C]-(R)-PK11195 for binding in the brain. This problem affects the definition of a reference region, a process that already must take into account the unknown location of microglia activation. In this work we have introduced a new supervised clustering procedure, totally automatic, that is able to extract a gray matter reference region devoid of nuisance signal.
A relevant finding of the study is the presence of a slowly equilibrating kinetic component in the tissue time–activity curves. Evidence from immunohistochemistry suggests that this signal is specific for PBBS binding in the vasculature, and its kinetic, although different from that of specific binding to activated microglia, resembles closely the [11C]-(R)-PK11195 kinetic in heart (26).
The presence of this additional component introduced another level of complexity in the kinetic modeling of ROI time–activity curves. For this task we abandoned compartmental modeling and adopted RS-ESA for the calculation of BP estimates for both plasma input and reference tissue input analyses. The effective extraction of a reference region combined with parameter estimation through RS-ESA provided an excellent agreement between plasma input and reference tissue input−derived BPs that were also highly correlated (r = 0.811, P < 10−5). This validates further the use of reference region modeling for the quantification of [11C]-(R)-PK11195 and allows direct comparison with the plasma input counterpart.
Finally, we investigated the reliability of the new reference extraction when BP parametric maps for [11C]-(R)-PK11195 are produced on a test–retest dataset. In this application, given the generally low signal-to-noise ratio in [11C]-(R)-PK11195 studies, SRTM was the method of choice for kinetic analysis. Results confirmed a substantial increase in the reliability of the estimates with the new supervised approach (mean ICC = 0.878) compared with the unsupervised approach (mean ICC = 0.596) and low test–retest variability (10.6%).
CONCLUSION
Reference region modeling combined with supervised reference tissue extraction produces reproducible and reliable parametric maps of [11C]-(R)-PK11195 binding in the human brain.
Acknowledgments
This study was funded in part by the EC-FP6-project DiMI, LSHB-CT-2005-512146A, and by the Parkinson's Disease Society, United Kingdom (MAP 02/04). The authors thank Ralph Myers and Marie Claude Asselin at Hammersmith Imanet for helpful comments and discussion. Hammersmith Imanet provided [11C]-(R)-PK11195 and all PET scanning equipment.
Footnotes
-
COPYRIGHT © 2006 by the Society of Nuclear Medicine, Inc.
References
- Received for publication May 22, 2006.
- Accepted for publication September 25, 2006.


Jump to section
Related Articles
Cited By...
- Validating the Utility of Supervised Clustering Algorithm for Precise [11C]DPA-713 PET Brain Image Quantification
- Integrating TSPO-PET imaging with metabolomics for enhanced prognostic accuracy in multiple sclerosis
- Association of serum neurofilament light with microglial activation in multiple sclerosis
- Association of serum neurofilament light with microglial activation in multiple sclerosis
- APOE {varepsilon}4 gene dose effect on imaging and blood biomarkers of glial reactivity and {beta}-amyloid pathology
- Association of Microglial Activation With Spontaneous ARIA-E and CSF Levels of Anti-A{beta} Autoantibodies
- Choroid plexus enlargement is associated with neuroinflammation and reduction of blood brain barrier permeability in depression
- [11C]PK11195-PET Brain Imaging of the Mitochondrial Translocator Protein in Mitochondrial Disease
- Microglia Activation in Basal Ganglia Is a Late Event in Huntington Disease Pathophysiology
- Increased serum peripheral C-reactive protein is associated with reduced small-molecule brain perfusion in healthy volunteers and subjects with major depressive disorder
- A modest increase in 11C-PK11195-PET TSPO binding in depression is not associated with serum C-reactive protein or body mass index
- PET markers of tau and neuroinflammation are co-localized in progressive supranuclear palsy
- In vivo neuroinflammation and cerebral small vessel disease in mild cognitive impairment and Alzheimers disease
- Neuroinflammation and functional connectivity in Alzheimers disease: interactive influences on cognitive performance
- Neuroinflammation and Functional Connectivity in Alzheimer's Disease: Interactive Influences on Cognitive Performance
- Automatic Extraction of a Reference Region for the Noninvasive Quantification of Translocator Protein in Brain Using 11C-PBR28
- Natalizumab treatment reduces microglial activation in the white matter of the MS brain
- Correlation of Microglial Activation with White Matter Changes in Dementia with Lewy Bodies
- Test-retest reliability and convergent validity of (R)-[11C]PK11195 outcome measures without arterial input function
- Head-to-Head Comparison of 11C-PBR28 and 18F-GE180 for Quantification of the Translocator Protein in the Human Brain
- Flortaucipir F 18 Quantitation Using Parametric Estimation of Reference Signal Intensity
- [11C]PK11195 binding in Alzheimer disease and progressive supranuclear palsy
- Microglial activation, white matter tract damage, and disability in MS
- Impact of Endothelial 18-kDa Translocator Protein on the Quantification of 18F-DPA-714
- Evaluation of the Effect of Fingolimod Treatment on Microglial Activation Using Serial PET Imaging in Multiple Sclerosis
- 11C-PBR28 and 18F-PBR111 Detect White Matter Inflammatory Heterogeneity in Multiple Sclerosis
- 11C-ER176, a Radioligand for 18-kDa Translocator Protein, Has Adequate Sensitivity to Robustly Image All Three Affinity Genotypes in Human Brain
- Imaging of neuroinflammation in dementia: a review
- The methodology of TSPO imaging with positron emission tomography
- Optimized Quantification of Translocator Protein Radioligand 18F-DPA-714 Uptake in the Brain of Genotyped Healthy Volunteers
- Cerebellum Can Serve As a Pseudo-Reference Region in Alzheimer Disease to Detect Neuroinflammation Measured with PET Radioligand Binding to Translocator Protein
- Cocaine Abuse in Humans Is Not Associated with Increased Microglial Activation: An 18-kDa Translocator Protein Positron Emission Tomography Imaging Study with [11C]PBR28
- In Vivo Assessment of Brain White Matter Inflammation in Multiple Sclerosis with 18F-PBR111 PET
- In Vivo Detection of Diffuse Inflammation in Secondary Progressive Multiple Sclerosis Using PET Imaging and the Radioligand 11C-PK11195
- Quantification of the Specific Translocator Protein Signal of 18F-PBR111 in Healthy Humans: A Genetic Polymorphism Effect on In Vivo Binding
- Increased PK11195 PET binding in the cortex of patients with MS correlates with disability
- Widespread and Prolonged Increase in (R)-11C-PK11195 Binding After Traumatic Brain Injury
- Detection and Quantification of Large-Vessel Inflammation with 11C-(R)-PK11195 PET/CT
- Initial Evaluation of 11C-DPA-713, a Novel TSPO PET Ligand, in Humans
- Microglial activation and amyloid deposition in mild cognitive impairment: A PET study
- Novel Reference Region Model Reveals Increased Microglial and Reduced Vascular Binding of 11C-(R)-PK11195 in Patients with Alzheimer's Disease
- PET Image Denoising Using a Synergistic Multiresolution Analysis of Structural (MRI/CT) and Functional Datasets