


Abstract
18F-DPA-714 is a second-generation tracer for PET imaging of the 18-kDa translocator protein (TSPO), a marker of neuroinflammation. Analysis and interpretation of TSPO PET are challenging, especially because of the basal expression of TSPO. The aim of this study was to evaluate a compartmental model that accounts for the effect of endothelial TSPO binding on the quantification of 18F-DPA-714 PET scans from a cohort of healthy subjects. Methods: Fifteen healthy subjects (9 high-affinity binders and 6 mixed-affinity binders) underwent 18F-DPA-714 PET scans with arterial blood sampling and metabolite analysis. The kinetic parameters were quantified using a 2-tissue compartmental model (2TC) as well as a 2TC with an extra, irreversible, compartment for endothelial binding (2TC-1K). These regional parameters and messenger RNA (mRNA) expression specific to endothelial cells were correlated with regional TSPO mRNA expression. Results: The 2TC-1K model was more appropriate than the 2TC for 81% of fits. The total volume of distribution was significantly reduced by 21% ± 12% across all regions with the 2TC-1K, compared with the 2TC. The endothelial binding parameter Kb varied highly across brain regions. Kb strongly and significantly correlated with all 3 probes extracted for TSPO mRNA expression (r = 0.80, r = 0.79, and r = 0.90), but no correlation was seen with the other binding parameters from the 2TC-1K. For the 2TC, there was a lower but significant correlation between the volume of distribution and one of the TSPO mRNA probes (r = 0.65). A strong, significant correlation was seen between mRNA for TSPO and genes specific to endothelial cells. Conclusion: Accounting for endothelial TSPO in the kinetic model improved the fit of PET data. The high correlation between Kb and TSPO mRNA suggests that the 2TC-1K model reveals more biologic information about the regional density of TSPO than the 2TC. The correlation between TSPO and endothelial cell mRNA supports the relationship between the regional variation of Kb and endothelial TSPO. These results can improve the estimation of binding parameter estimates from 18F-DPA-714 PET, especially in diseases that induce vascular change.
The 18-kDa translocator protein (TSPO) is a five-transmembrane domain protein predominantly located on the outer membrane of mitochondria (1,2). This protein is present in peripheral tissues and in the central nervous system. TSPO has a role in the immune and inflammatory response, being upregulated by microglia in an activated state after a brain injury (3). This characteristic makes TSPO a biomarker of interest for neuroinflammation in the study of neurodegenerative and neurologic diseases such as Alzheimer disease, Parkinson disease, multiple sclerosis, and epilepsy (4).
Several PET radioligands that target TSPO have been developed, beginning with 11C-PK11195. A second generation of TSPO ligands for PET was developed (5), among which the most used are 11C-PBR-28, 18F-PBR-111, and 18F-DPA-714 (N,N-diethyl-2-[4-(2-fluoroethoxy)phenyl]-5,7-dimethylpyrazolo[1,5-a]pyrimidine-3-acetamide).
The initial evaluation of 18F-DPA-714 in humans used the Logan plot to calculate kinetic parameters, reporting that the tracer could provide a sensitive measure of neuroinflammatory changes (6). Since then, 2 main studies have characterized the kinetic parameter estimates of 18F-DPA-714 in healthy subjects using modeling with 2 tissue compartments (2TC, Fig. 1A) and metabolite-corrected arterial input functions (7,8).

2TC (A) and 2TC-1K (B) models (proposed by Rizzo et al. (19)). Each compartment represents pool of radioligand concentration: CPL (concentration within plasma), CND (nondisplaceable concentration), CS (concentration specifically bound within brain tissue), and CVASC (concentration within vascular compartment). Dotted line indicates concentrations captured by PET scan, and hatched area indicates vascular fraction.
The analysis and interpretation of PET scans is challenging for all second-generation TSPO tracers for several reasons (9). One relates to the genetic polymorphism yielding 3 different levels of affinity (10)—high-, mixed-, and low-affinity binders—which ideally should be taken into consideration when analyzing PET scans.
Another challenge is the ubiquitous and nonnegligible TSPO expression present within healthy brain tissue. Increasing evidence has shown that this basal TSPO is not solely in the quiescent microglia and astrocytes but also in the endothelial cells of the blood–brain barrier. For example, Zhang et al. performed a messenger RNA (mRNA) expression analysis of the different cell types of the mouse cerebral cortex (11), and a searchable mRNA database is available online (https://web.stanford.edu/group/barres_lab/brain_rnaseq.html) showing that endothelial cells have the same levels of TSPO mRNA as microglia. Furthermore, several immunohistochemistry studies in the mouse, nonhuman primate, and human have shown colocalization of endothelial cell and TSPO markers (12–18).
Given the evidence in the literature for the nonnegligible presence of endothelial TSPO, a kinetic model that includes a separate component to account for this binding should be tested for TSPO tracers. So far, 2 kinetic models have been developed accounting for the TSPO within the neurovasculature. The first, developed for 11C-PK-11195 (14), modified the simplified reference tissue model to include a vascular signal, which was estimated directly from the image. The second, for 11C-PBR-28, used the classic 2TC model and added an extra, irreversible, compartment within the vascular volume to separate the vascular TSPO binding from the tissue TSPO binding, as shown in Figure 1B (2TC-1K model) (19). The authors demonstrated that for 11C-PBR-28, it was necessary to include a compartment for the vascular trapping of the ligand to avoid a significant bias in the estimated binding parameters.
The purpose of our study was to evaluate the 2TC-1K model when applied to 18F-DPA-714 scans in healthy subjects (8) and to compare the results with those from the 2TC model to observe the impact of incorporating a compartment to account for endothelial TSPO. Furthermore, we investigated whether the estimated binding parameters agreed with regional TSPO within brain tissue as predicted by mRNA data extracted from the Allen Human Brain (AHB) atlas (20).
MATERIALS AND METHODS
Study Design and Imaging Protocol
Fifteen healthy volunteers (8 women and 7 men; mean age ± SD, 50 ± 16 y) were included from 2 clinical protocols (NCT02305264 and NCT02319382). The study protocols were approved by a Medical Bioethics Committee of the Île de France Region and in accordance with French legislation and the 1975 Declaration of Helsinki (revised in 1983), and written informed consent was obtained from all participants. All individuals were genotyped for the s6971 polymorphism within the TSPO gene, yielding 9 high-affinity binders and 6 mixed-affinity binders. Each participant underwent T1-weighted MRI (for region-of-interest definition) and 18F-DPA-714 PET scans (ECAT High-Resolution Research Tomograph; Siemens Medical Solutions). An 18F-DPA-714 bolus was injected intravenously (192 ± 21 MBq), and the dynamic list-mode PET acquisition lasted 90 min. During the acquisition, arterial blood sampling and metabolism measurements were performed to generate an arterial input function. The demographic details, genetic analysis, metabolite analysis, 18F-DPA-714 synthesis, and imaging protocols were described by Lavisse et al. (8).
Reconstruction and Image Processing
Images were reconstructed using the expectation-maximization maximum-likelihood algorithm with 40 iterations, point-spread function modeling, and postsmoothing (21,22). The 33 time frames for the dynamic scan were 1 × 20, 10 × 10, 3 × 20, 2 × 60, 5 × 120, 9 × 300, and 3 × 600 s, and the images had an isotropic voxel size of 1.2 mm3. After reconstruction, each frame was corrected for motion using PMOD software (version 3.6; PMOD Technologies Ltd.). All T1-weighted MR images were segmented using FreeSurfer, version 5.3 (https://surfer.nmr.mgh.harvard.edu/), producing a neuroanatomic atlas that was registered with the PET scans for region-of-interest definition and time–activity curve extraction. Data from the left and right regions were averaged.
The ECAT High-Resolution Research Tomograph, dedicated to brain imaging, has an intrinsic isotropic spatial resolution of about 2.5 mm and a sensitivity of about 5.5%–6.5% (23); hence, dynamic scans are strongly affected by noise. For noise reduction, a principal-component analysis was applied (Pixies software, http://www.apteryx.fr/) in which the largest signals in the image described by the first 3 principal components were conserved and the rest were discarded as noise (24,25). Supplemental Figure 1 (supplemental materials are available at http://jnm.snmjournals.org) shows the curves taken from a large region (high-count data with little noise) and a small region before and after noise reduction, showing the impact of the process. A simulation study (results not shown) has also indicated that this noise reduction does not induce a bias in the dynamic scan in regions of high or low noise. The time–activity curve extraction and kinetic modeling were done for the original images and the images with noise reduction.
Kinetic Modeling
Our previous study (8) showed that the 2TC model was more appropriate than a 1TC model; in the current study, therefore, only the 2TC model (Fig. 1A) was compared with the 2TC-1K model (Fig. 1B). A nonlinear least-squares model fitting was applied using the PMOD software implementation. The microparameters estimated were the rate constants between the compartments: K1 (mL/cm3/min), k2, k3, and k4 (min−1). The Kb (min−1) parameter, which describes the rate of binding to the TSPO in the endothelium, and the vascular fraction (vB in Supplemental Tables 2–7) were also estimated. The macroparameters estimated were total volume of distribution (VT) (mL/cm3), VND (nondisplaceable volume of distribution [mL/cm3]), and BPND as k3/k4 (unitless).
Correlation of PET Parameter Estimates with mRNA Expression
The mRNA expression data can be extracted from the freely available AHB atlas and used for comparison with protein or receptor concentration maps acquired with PET (26). The comparison is made under the assumption that mRNA expression can predict in vivo protein distribution. A correlation has already been demonstrated between TSPO mRNA and protein expression (27). In the AHB atlas, the expressed mRNA was measured using a large range of genetic probes, including 3 different probes for the TSPO gene (Supplemental Table 1) and many probes for genes specifically expressed within endothelial cells. In this study, the kinetic parameter estimates from the PET scans were compared with mRNA TSPO expression. The mRNA data were extracted at the regional level and correlated with the regional macroparameters in both models for the same regions when available.
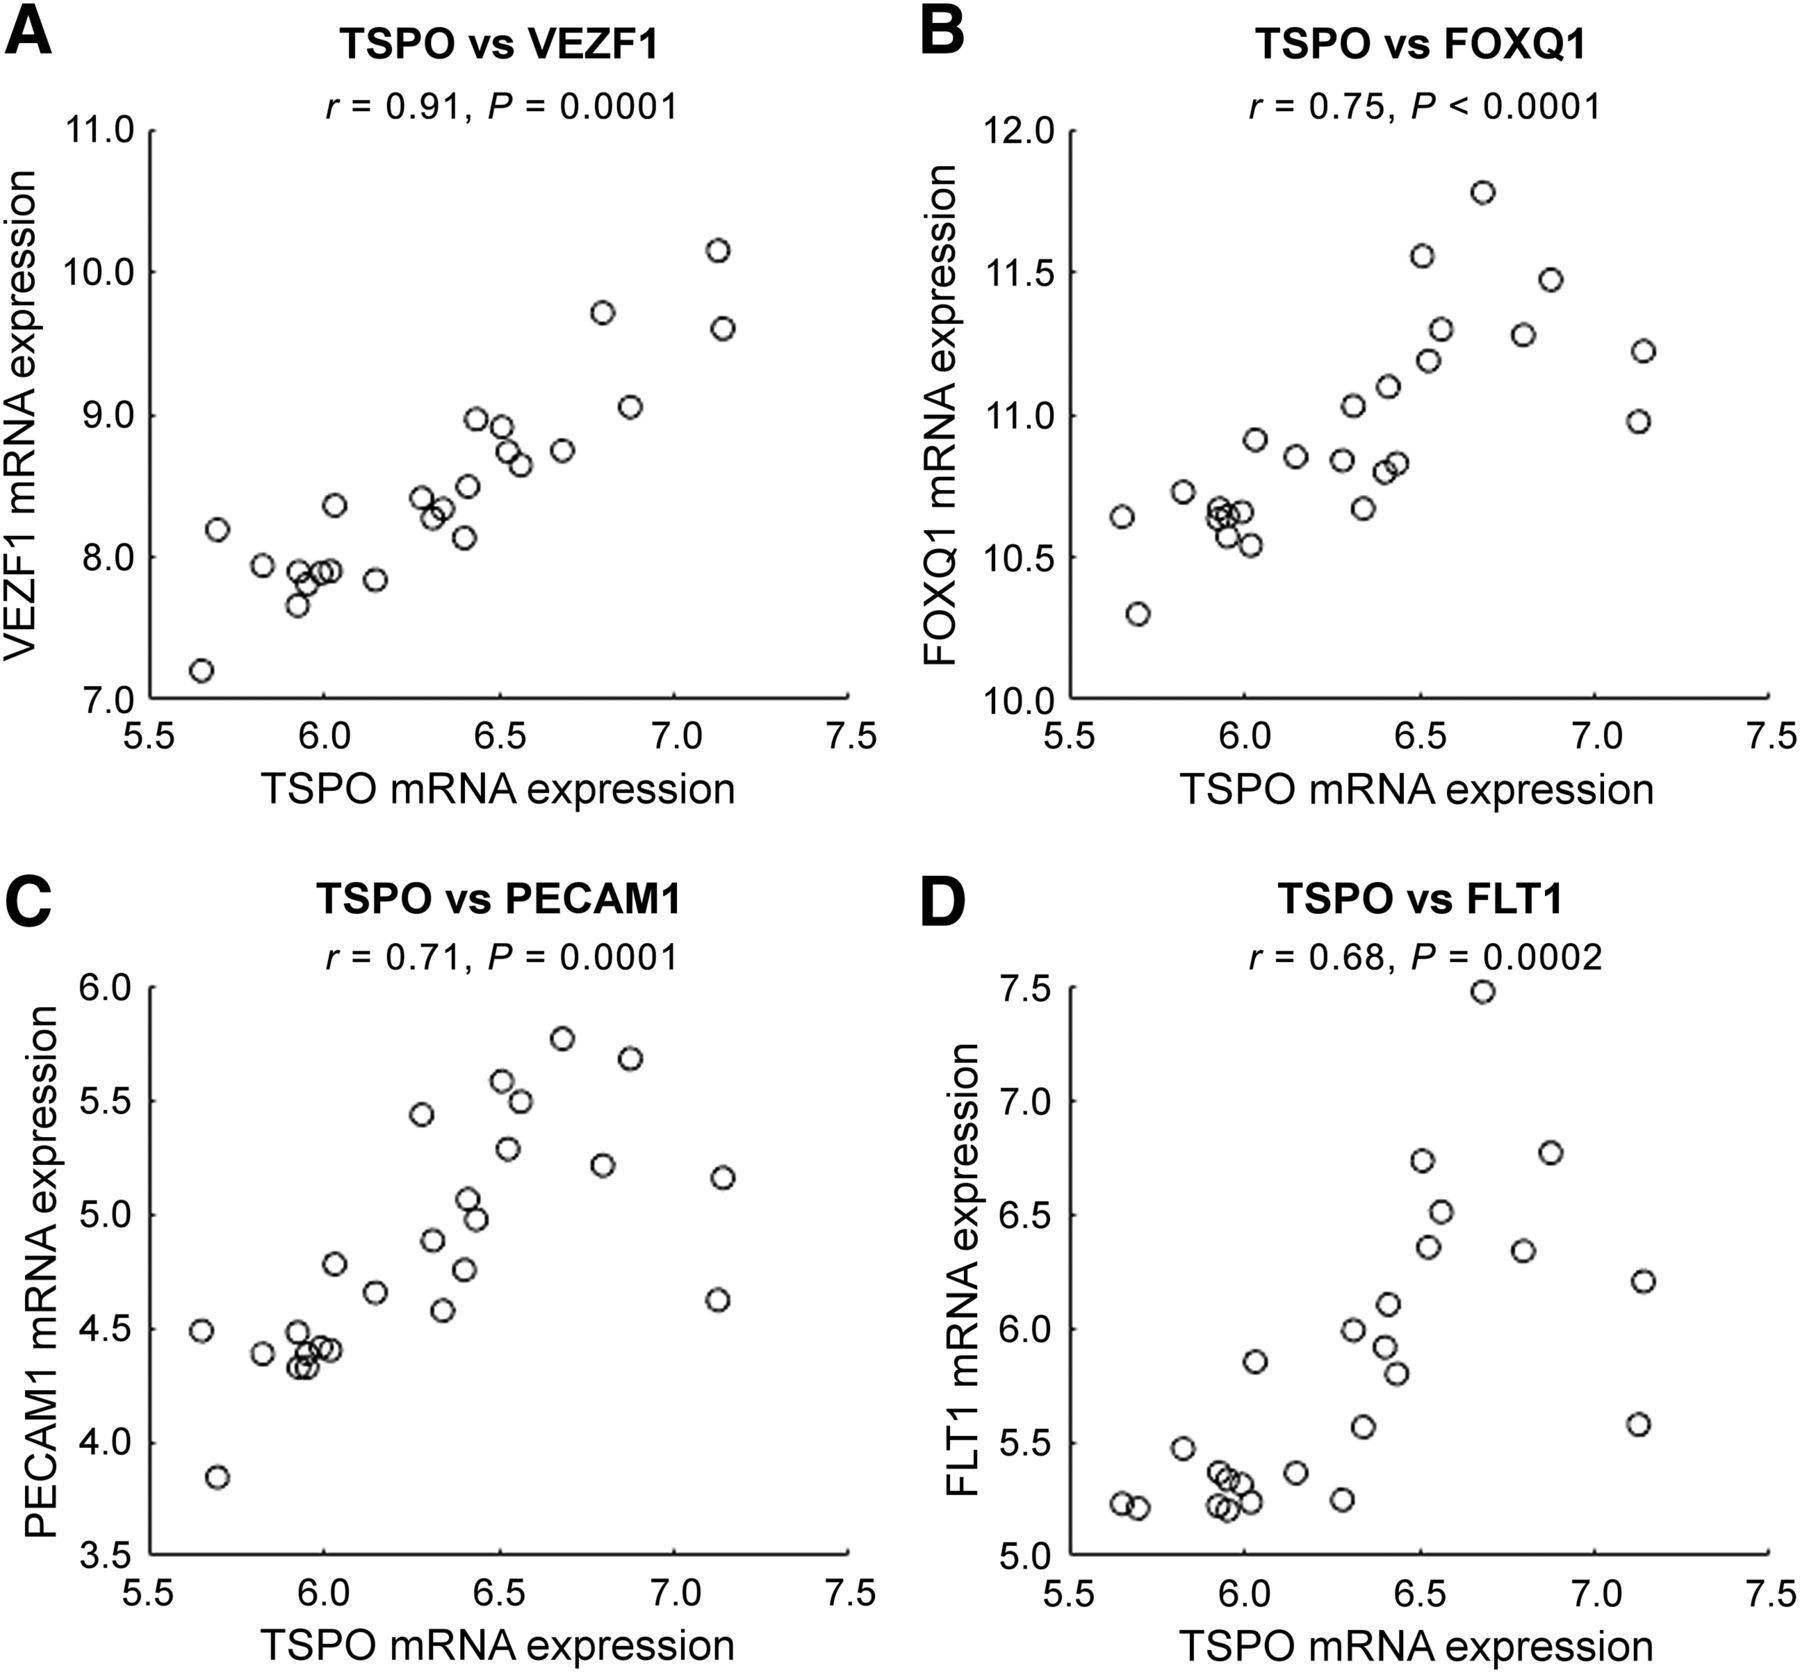
The connection between TSPO and endothelial markers was investigated by correlating the TSPO mRNA with mRNA data extracted for 4 genes known to be specific within endothelial cells (vascular endothelial zinc finger 1, FMS-related tyrosine kinase 1, forkhead box Q1, and platelet/endothelial cell adhesion molecule 1; Supplemental Table 1) (28). The correlations were done at a region level and averaged over the different probes for each endothelial gene.
Statistical Analysis
The compartmental models were compared using the model-fitting criterion (PMOD software). The model selection comparison used the Akaike information criterion (AIC) corrected for a small sample size and the Bayesian information and model selection criteria (MicroMath). Kinetic parameter estimates are presented as mean ± SD, and subjects were grouped by genetic affinity. The SE of each parameter estimate, showing the precision of the estimate, is expressed as a percentage of the parameter itself and defined as the coefficient of variation. The regional parameter estimates between high- and mixed-affinity binders were compared using a 1-way ANOVA. Parameter differences between the 2 models were compared using the Mann–Whitney U test. Pearson correlation coefficients (r) were calculated to evaluate the correlation between estimated parameters and mRNA expression. Significance was set at a P value of less than 0.05.
RESULTS
Model Assessment and Noise Reduction
The AIC values from the original images showed a similar percentage of time–activity curves that fit better for both models (Fig. 2). It was not possible to distinguish which of the 2 models provided the best fit (average AIC, −3 ± 14 for the 2TC and −7 ± 16 for the 2TC-1K over all regions). After noise reduction, the 2TC-1K yielded a better fit than the 2TC for 81% of all time–activity curves (Fig. 2) according to the AIC. The mean AIC values improved (−38 ± 24 for the 2TC and −50 ± 29 for the 2TC-1K, all regions), and the difference in the AIC between the 2 models was significant for 12 of the 15 subjects.
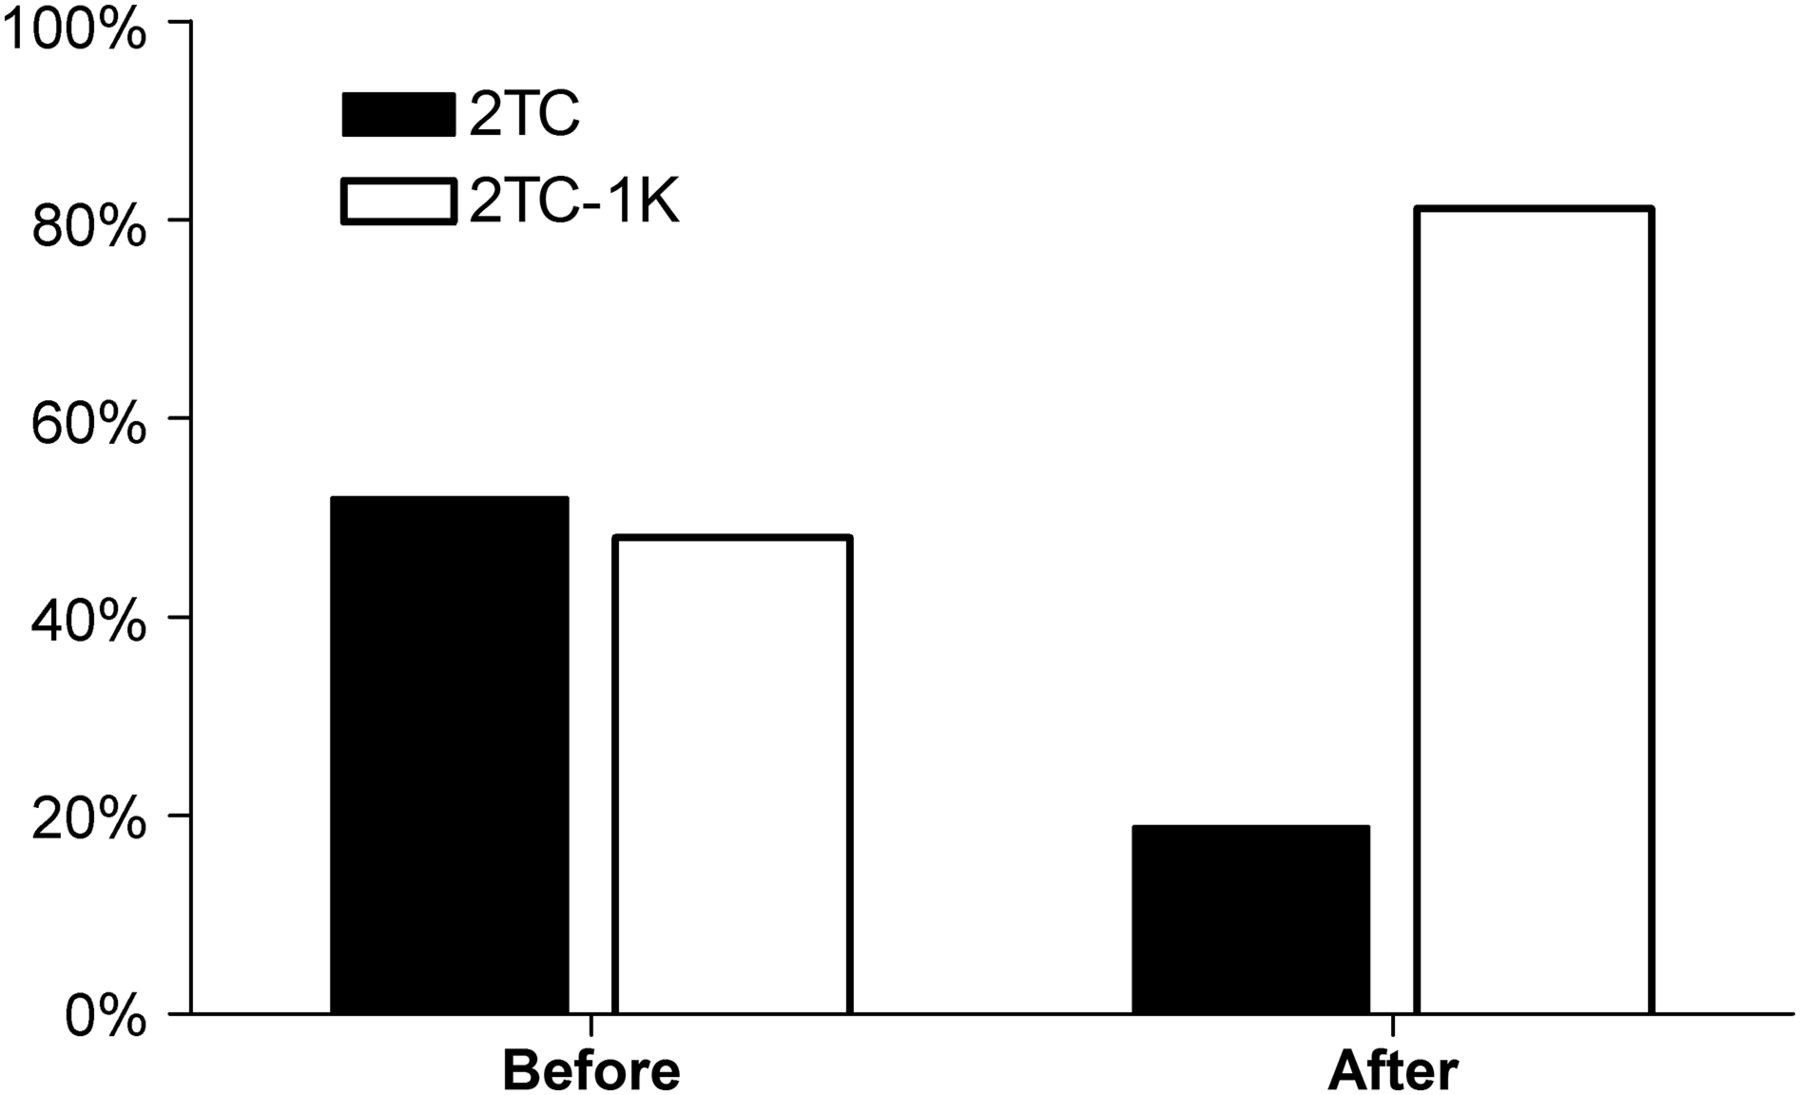
Percentage of 2TC and 2TC-1K time–activity curves preferred by AIC for each of the 2 models before and after noise reduction.
A thorough analysis was undertaken to assess whether noise removal induced a bias in the time–activity curves and model fitting. Details on changes in the AIC in a large and small region are described in Supplemental Figure 1. In large regions with little to no noise, the time–activity curve values, shape, and AIC stayed the same, leading to the inference that no bias was induced. All subsequent results were thus obtained from the images after noise reduction.
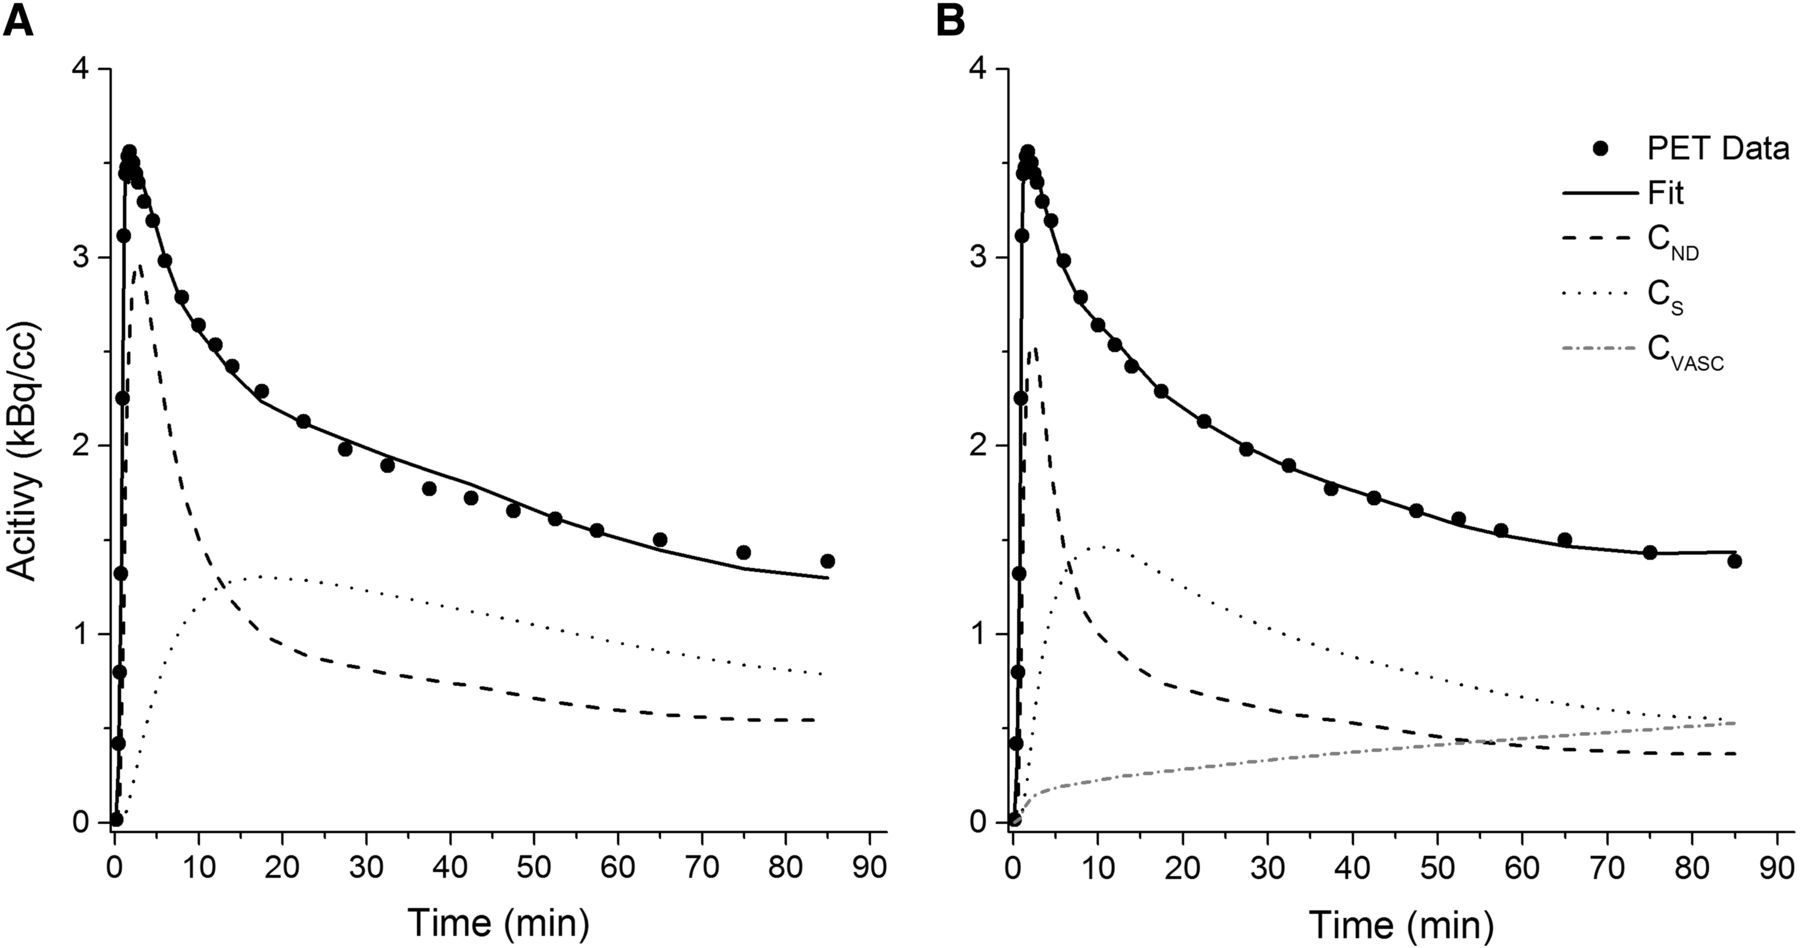
The model fits of the 2TC and 2TC-1K are shown in Figure 3 for a representative whole-brain time–activity curve. The fit using the 2TC-1K model followed the measured data more closely, especially at the middle and end of the time–activity curve, as was reflected in the improved AIC (Fig. 2).

Model fits for 1 representative time–activity curve with 2TC (A) and 2TC-1K (B) models. CND = nondisplaceable concentration, CS = concentration specifically bound within brain tissue, CVASC = concentration within vascular compartment.
The other model-fitting criteria that we tested were more favorable for the 2TC-1K than for the 2TC: the Bayesian information criterion identified a better fit for the 2TC-1K than for the 2TC for 84% of the curves, and the model selection criterion identified a better fit for the 2TC-1K than for the 2TC for 91% of the curves.
Kinetic Parameters
The parameter estimates for both models are shown in Figure 4 for representative regions. The average estimates for vascular fraction, VT, VND, BPND, and Kb are shown in Supplemental Tables 2–7. The 1-way ANOVA showed a significant effect of the affinity of the subjects (high- or mixed-affinity binders) for the macroparameters estimated (VT, VND, BPND, and Kb) for both models (F statistic between 12 and 53, P < 0.05).

Mean parameter estimates for 2TC and 2TC-1K models in some brain regions of high-affinity-binders. Parameters shown are VT (A), VND (B), and BPND (C).
The 2TC-1K model produced VT and VND values significantly lower than those from the 2TC model in all regions (average reduction, 21% ± 12%). The BPND showed higher estimates using the 2TC-1K for all regions; however, differences between the models were not significant in any region. When the 2TC model was used, the thalamus showed the highest VT and the caudate showed the lowest. When the 2TC-1K model was used, the thalamus still had the highest VT value, but the lowest was in the white matter. The Kb was quite variable across the brain regions analyzed, as seen in Figure 5, and the average regional Kb correlated strongly between high- and mixed-affinity binders (r = 0.97, P < 0.05).
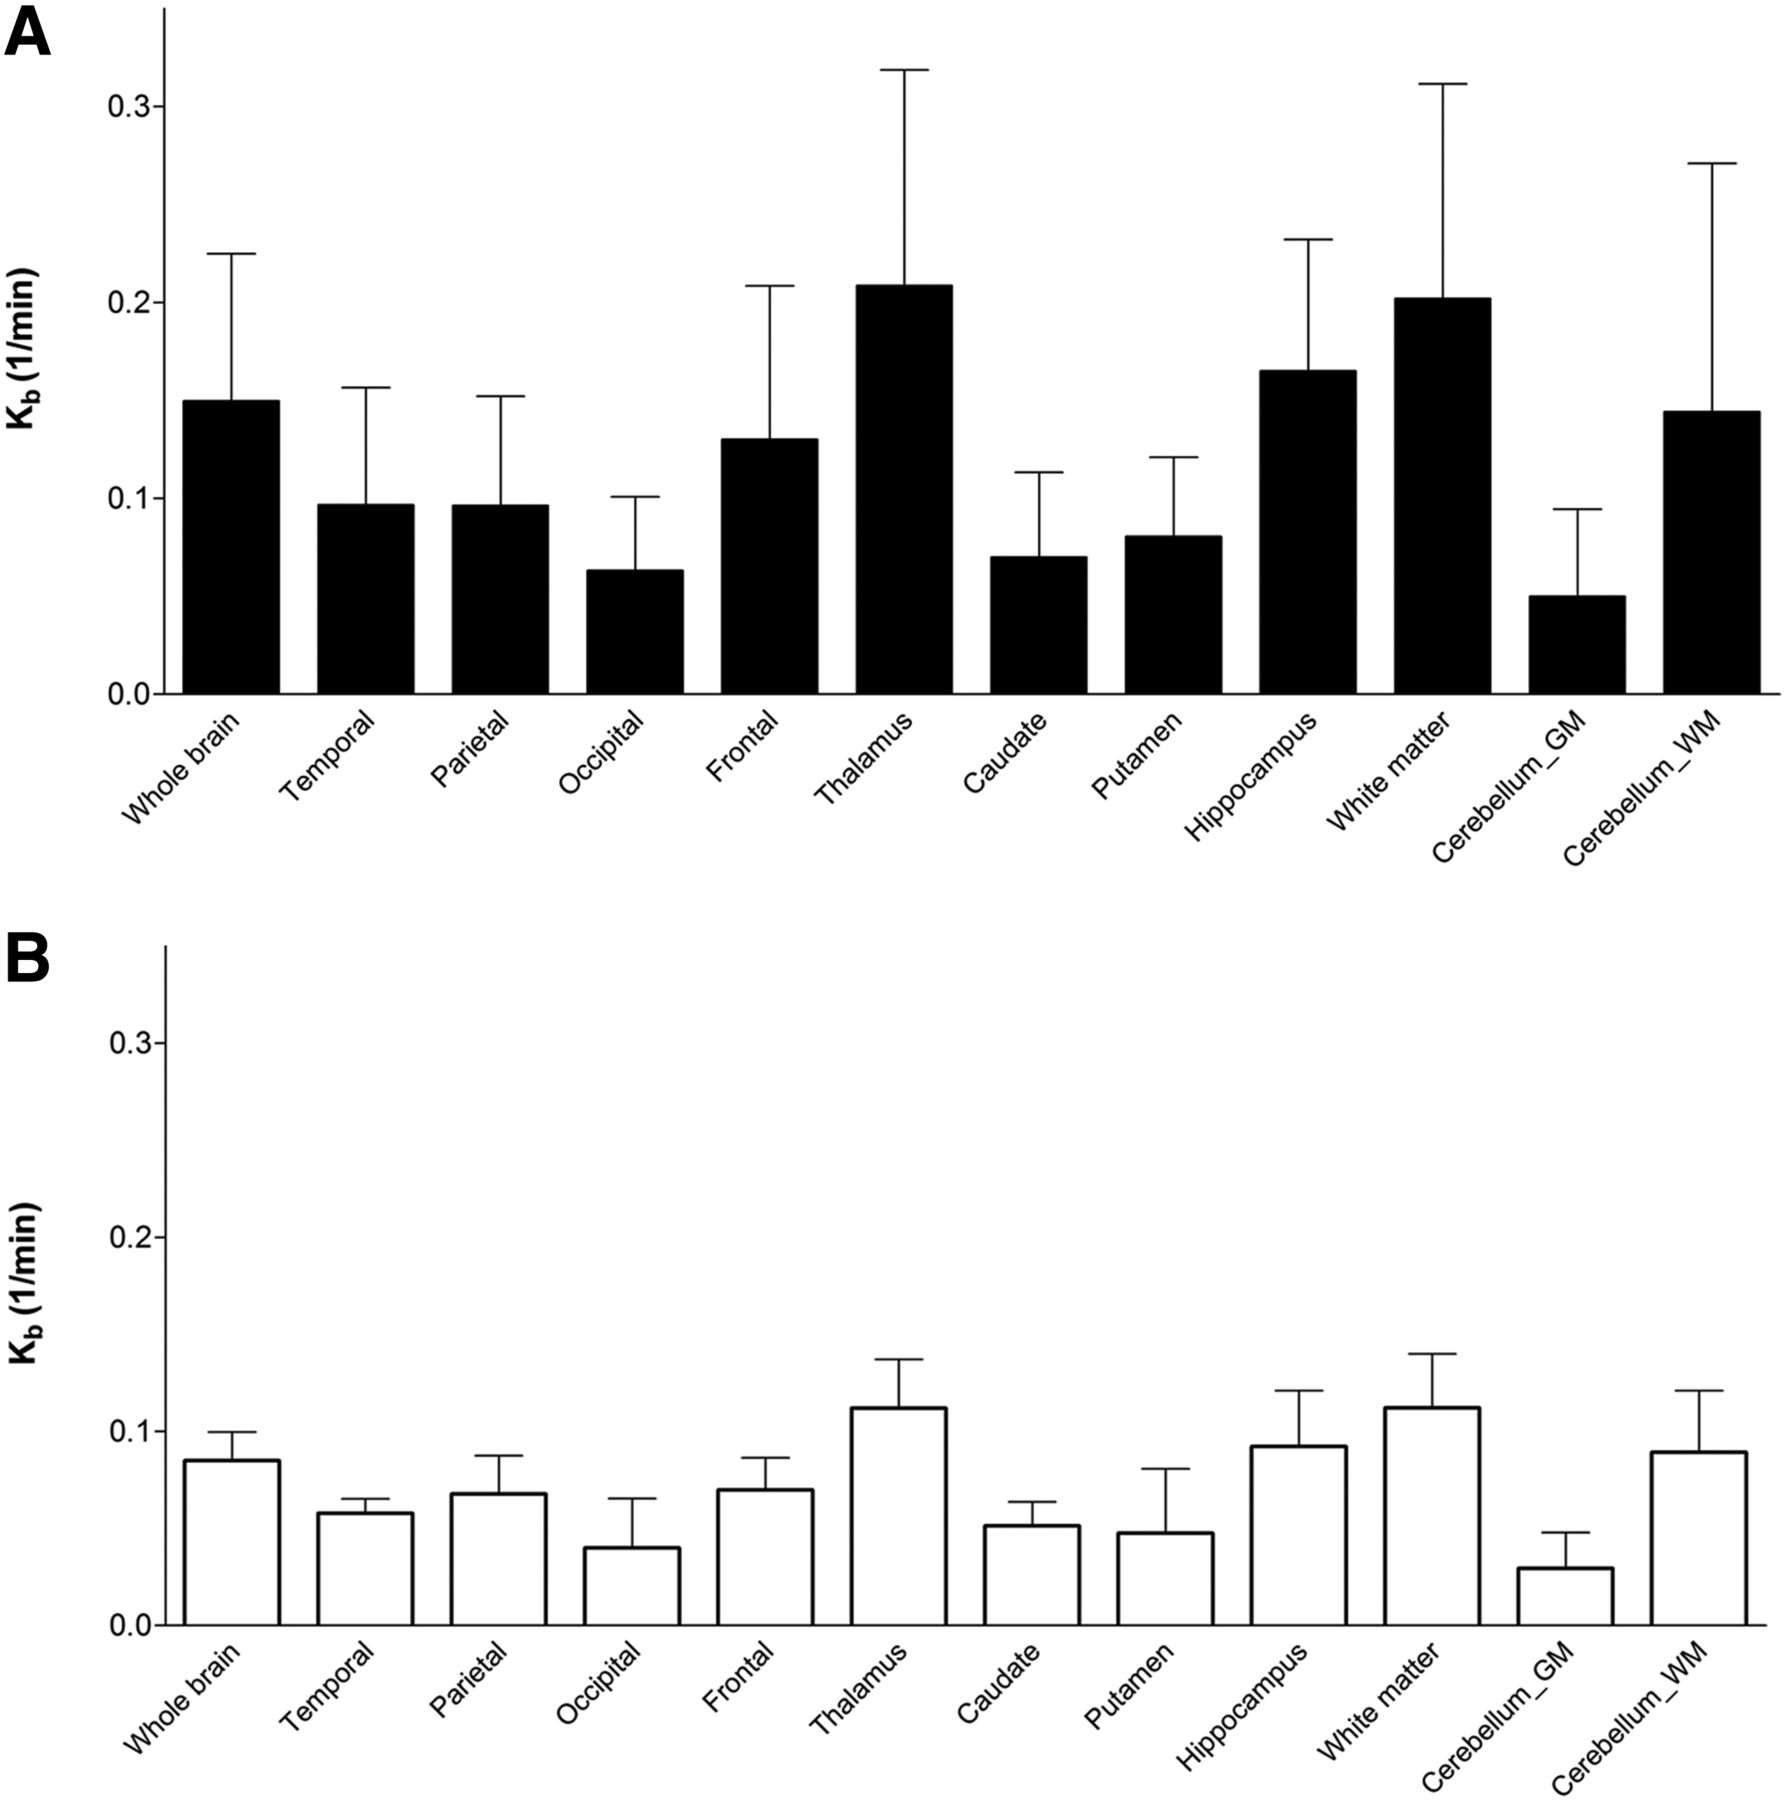
Mean Kb estimates for 2TC-1K model for each brain region for high-affinity (A) and mixed-affinity (B) binders. GM = gray matter; WM = white matter.
The parameters of the 2TC model had an average regional coefficient of variation of 2 ± 2 and 12 ± 5 for VT and BPND, respectively. For the 2TC-1K model, the average regional coefficient of variation was 4 ± 3 and 18 ± 10 for VT and BPND, respectively. The average regional coefficient of variation for Kb was 26 ± 23.
Correlations with mRNA Data
The regional correlations between the TSPO mRNA expression and the estimated PET macroparameters (Fig. 6) were significant for the VT from the 2TC for only TSPO probe 3. Kb from the 2TC-1K strongly and significantly correlated with all 3 TSPO gene probes. The correlations between TSPO and endothelial mRNA expression, as shown in Figure 7, were strong and significant.
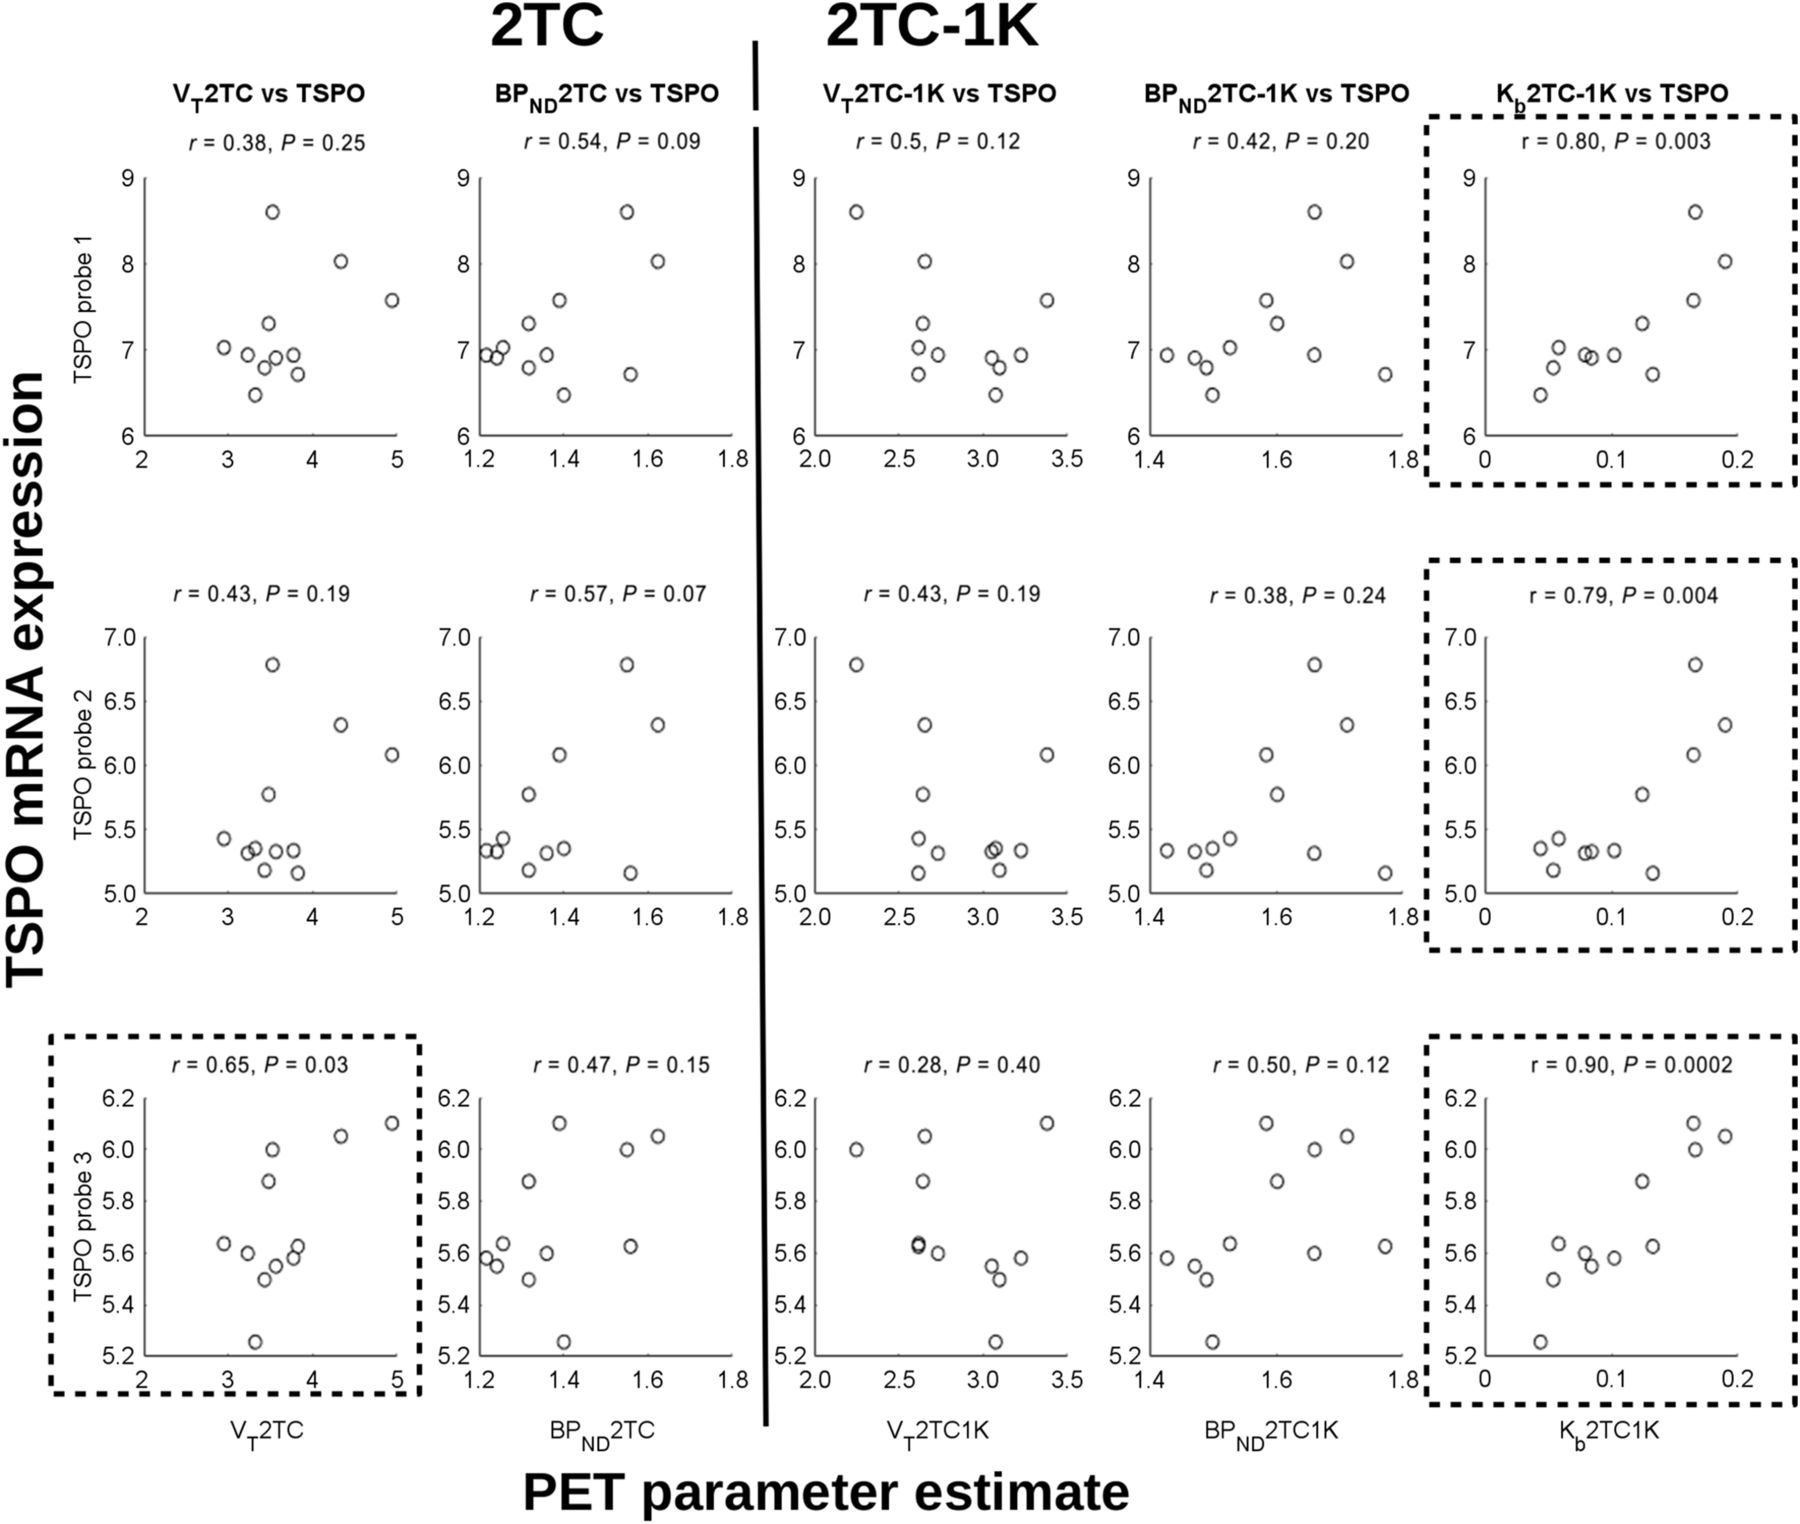
Correlations of kinetic parameter estimates (all subjects) from 18F-DPA-714 PET scans with TSPO mRNA expression from AHB atlas. (Left) VT and BPND from 2TC. (Right) VT, BPND, and Kb from 2TC-1K. Plots surrounded by box show significant correlations.

Regional correlations over 25 different regions from AHB atlas between average TSPO mRNA expression (x-axis) and mRNA expression for 4 different genes specific to endothelial cells (y-axis): vascular endothelial zinc finger 1 (VEZF1) (A), forkhead box Q1 (FOXQ1) (B), platelet/endothelial cell adhesion molecule 1 (PECAM1) (C), and FMS-related tyrosine kinase 1 (FLT1) (D).
DISCUSSION
Recently, there has been increasing evidence that TSPO is present in cells other than microglia and astrocytes, such as endothelial cells, which can affect the quantification and interpretation of PET studies (9,13,16–19). We investigated the impact of adding an extra compartment into the 2TC model to account for 18F-DPA-714 binding to endothelial TSPO in the blood–brain barrier. We showed that the model with this extra compartment fit the PET data much better according to model-fitting criteria; however, this improvement was not clear until the noise in the dynamic scans was reduced. Further, the parameter describing tracer binding to endothelial TSPO (Kb) correlated strongly with TSPO mRNA data extracted from the online AHB atlas, indicating that the 2TC-1K model reveals information about the regional density of TSPO.
A large proportion of noise could be removed, improving the identification of the models in small regions with high noise. The shape of the kinetic time–activity curves remained unchanged in the large regions (with little to no noise) after noise reduction, nor was the AIC changed, suggesting that this process did not introduce bias.
Adding the extra compartment related to the vascular component clearly improved the fitting as demonstrated by the AIC, showing that the 2TC-1K is a more appropriate model for 81% of the time–activity curves. The model used was one originally proposed by Rizzo et al. (19) with irreversible binding within the endothelial compartment. It is possible that the component is actually slowly reversible, but the vascular washout parameter of the endothelial TSPO would be difficult to identify from an experiment with a single-injection tracer dose. The true interaction of the tracer with endothelial TSPO, compared with tissue TSPO, is unknown; therefore, an additional parameter to account for the vascular washout was not introduced and an irreversible compartment was used to estimate the shape of the kinetic of the endothelial binding.
The impact of using the 2TC-1K model can be seen as a reduction in the average VT and VND values in all regions for all subjects. Interestingly, the regional reduction of both VT and VND correlated strongly with the added Kb parameter (r = 0.96, P < 0.05). BPND increased slightly with the 2TC-1K, but the increase was not significant and the regional trend was similar to the regional BPND estimated by the 2TC and not strongly variable between brain regions. Because the VT from the 2TC model consists partly of endothelial binding, use of the 2TC-1K removes this constitutive binding, suggesting that the binding parameters obtained using the 2TC-1K may be more relevant to the microglial or astrocytic TSPO expression involved with neuroinflammatory processes than those estimated by the 2TC. For accurate interpretation of the data, it is especially important to separate these sources of TSPO when there is a pathology involving the endothelium, such as vascular system degradation as demonstrated in Alzheimer disease (14) or vascular enhancement as demonstrated in some gliomas or endothelial inflammation (17).
A significant correlation was found between 1 of the 3 TSPO mRNA probes and the VT value estimated using the 2TC. Strong and significant correlations were found between the estimated Kb of the 2TC-1K and all 3 TSPO probes, but no correlation was found between the 2TC-1K VT or BPND and these probes. These strong correlations demonstrate that the 2TC-1K model reveals more information about the regional variation in TSPO than the 2TC and that the Kb describes the main TSPO variation between brain regions in healthy subjects. The correlation between the regional Kb estimates and the TSPO mRNA is consistent with the fact that little to no activated microglia are present in healthy brain tissue. The main TSPO signal may therefore come from other sources, such as the endothelial cells.
To further investigate the relationship between Kb and endothelial TSPO concentration, we extracted the mRNA data related to TSPO, as well as the mRNA data for 4 genes specifically expressed within endothelial cells. The high regional correlation that could be seen between these 2 targets (Fig. 7) supports the hypothesis that the variation in TSPO expression in healthy subjects is related to endothelial TSPO. There were several genes specific to endothelial cells in the AHB atlas (28), but some of them showed no significant correlation with TSPO mRNA. This finding could be because the presence of mRNA expression does not provide a direct estimation of the protein present in the tissue but can support the presence of the protein if there is a correlation (26).
The evidence for TSPO within the endothelium is further supported by a recent blocking study of 11C-PBR-28 PET showing that the 2TC-1K model was more appropriate than the 2TC model. In this study, immunohistochemistry showed that TSPO was present in all vessels and accounted for 30% of the vascular network and that this variation in TSPO was dependent on tissue type (29).
The regional correlations between parameter estimates and TSPO mRNA expression are in line with previous data (19) showing that Kb correlated well with TSPO mRNA expression, although less strongly than with 18F-DPA-714. Unlike what was seen for 18F-DPA-714, a correlation was present between the TSPO mRNA and the VT of the 2TC-1K for 11C-PBR-28. This correlation could be due to the different affinity of the tracer, making it challenging to separate the different signals with a single tracer dose.
To the best of our knowledge, there have been only 2 other studies using TSPO tracers that tested the 2TC-1K model (30,31). Fan et al. (30) showed that 18F-GE180, in healthy subjects, fit better with the 2TC than with the 2TC-1K. However, the behavior and kinetics of this tracer are quite different from those of 18F-DPA-714, having comparatively low VT values, and therefore a different model choice and estimates can be expected. Bloomfield et al. (31), using 11C-PBR-28 in a cohort of schizophrenic patients, reported that the 2TC-1K fit better for 99.4% of time–activity curves based on the AIC.
On the basis of our findings, 18F-DPA-714 PET kinetic parameters derived without accounting for endothelial binding should be interpreted with caution, especially in neurologic diseases that include a component of vascular degeneration, angiogenesis, or inflammation (14,17). Quantification using reference region methods and not accounting for the regionally variable Kb could under- or overestimate BPND. Finally, separation of tracer binding to endothelial TSPO from tissue TSPO binding may increase the sensitivity with which small changes in TSPO expression due to neuroinflammatory processes are detected.
CONCLUSION
Kinetic modeling of 18F-DPA-714 in the healthy human revealed that an extra compartment is required to account for the nonnegligible binding to the TSPO present in the endothelial cells of the blood–brain barrier. The best model could be identified only after noise was reduced, highlighting the need to have low-noise data for accurate kinetic modeling. The model choice was supported by evidence from the literature showing TSPO within the endothelium and the strong correlation of the endothelial binding parameter, Kb, with TSPO mRNA. The regional variation in Kb explained by endothelial TSPO was consistent with correlations between TSPO mRNA and the mRNA specific to endothelial cells. These results should affect the interpretation of binding parameter estimates from 18F-DPA-714 PET in diseases that include a component of vascular change.
DISCLOSURE
The work was performed at the SHFJ imaging facility supported by France Life Imaging under grant agreement ANR-11-INSB-006. This work was supported by France Parkinson (NCT02319382), ANR-08-MNPS-016-02 and ANR-10-IAIHU-06 (NCT02305264), and “Investissement d’Avenir-ANR-11-INBS-0011”-NeurATRIS, CEA. Catriona Wimberley was supported by Eurotalents postdoctoral grant 600382. This study was partially funded by the EU 7th framework programme (FP7/2007-2013) under grant agreement 278850 (INMiND). No other potential conflict of interest relevant to this article was reported.
Acknowledgments
We are grateful to the SHFJ staff: the nurses and the Molecular Probes Team of IMIV, Claude Comtat, Simon Stute, and Philippe Gervais. We thank Lena Guillot, Isabelle Rebeix, Sylvie Forlani, and Luce Dauphinot for the genetic analysis, and we thank Gaia Rizzo, Mattia Veronese, and Carole Escartin for fruitful discussions.
Footnotes
Published online Aug. 3, 2017.
- © 2018 by the Society of Nuclear Medicine and Molecular Imaging.
REFERENCES
- Received for publication May 2, 2017.
- Accepted for publication July 7, 2017.


Jump to section
Related Articles
Cited By...
- Deciphering sources of PET signals in the tumor microenvironment of glioblastoma at cellular resolution
- Brain and systemic inflammation in de novo Parkinsons disease
- Structural and Clinical Correlates of a Periventricular Gradient of Neuroinflammation in Multiple Sclerosis
- Head-to-Head Comparison of 11C-PBR28 and 18F-GE180 for Quantification of the Translocator Protein in the Human Brain
- 18F-PBR111 PET Imaging in Healthy Controls and Schizophrenia: Test-Retest Reproducibility and Quantification of Neuroinflammation