


Abstract
In radiotherapy of head and neck cancer (HNC) and non-small cell lung cancer (NSCLC), hypoxia is known to be an important prognostic factor for long-term survival and local tumor control. The PET tracer 18F-fluoromisonidazole (FMISO) allows noninvasive assessment of tumor hypoxia. This study analyzed whether FMISO PET could predict tumor recurrence after radiotherapy. Methods: Forty patients with advanced HNC (n = 26) or NSCLC (n = 14) were studied before curative radiotherapy. Dynamic (0–15 min) and static PET scans were acquired up to 4 h after injection of 400 MBq of FMISO. Standardized uptake values (SUVs) and ratios to reference tissues (mediastinum or muscle) were calculated. In addition, time–activity curves up to 14 min after injection were classified visually. PET data were correlated with clinical follow-up data (presence or absence of local recurrence within 1 y), which were available for 21 patients. Results: For HNC, patients with local recurrence could be separated from disease-free patients by SUV 4 h after injection (all recurrences had an SUV > 2). For NSCLC, no such correlation was observed. The tumor-to-muscle ratios (T/Mu) and tumor-to-mediastinum ratios (T/Me) at 4 h after injection correlated with the risk of relapse in both tumor entities: All patients with a T/Me greater than 2.0 (NSCLC, n = 5) or with a T/Mu greater than 1.6 (HNC, n = 5) presented with tumor recurrence, whereas only 3 of the remaining 11 patients experienced recurrence (27%). Qualitative analysis of time–activity curves for 37 patients revealed 3 curve types (rapid washout, n = 9; intermediate [delayed washout], n = 12; and accumulation, n = 16). Eighteen patients categorized by curve type could be followed up: In 5 of 6 patients with an accumulation curve, disease recurred locally within 1 y, compared with 5 of 8 patients with a delayed-washout curve and 0 of 4 with a rapid-washout curve. Conclusion: Our results indicate that outcome after radiotherapy can be predicted on the basis of kinetic behavior of FMISO in tumor tissue. An accumulation-type curve, high SUV, and high T/Mu and T/Me at 4 h after injection are highly suggestive of an incomplete response to treatment and might be used to select patients for intensified therapy protocols.
Tumor hypoxia is considered to be an independent predictor of poor prognosis in several types of cancer (1,2). In vitro and in vivo studies have shown that tumor hypoxia is associated with an increased likelihood of local recurrence and distant metastasis, as well as resistance to radiation therapy and various types of chemotherapy (3). That is the reason for a variety of efforts to develop methods for measuring oxygen levels in tumor tissue (4–6). At present, the only method for direct determination of oxygen tension in human tumors is a commercially available oxygen electrode, commonly referred to as Eppendorf electrode. Results obtained with this electrode correlated well with clinical outcome in several trials (1,2). Therefore, this technique is a gold standard for any technique assessing oxygen concentration directly in vivo.
However, the oxygen electrode method exhibits quite a few problems. First, it is technically demanding, requires considerable operator skill, and thus is prone to sampling errors. Second, it is useful only for studying accessible (i.e., superficial) tumors. Therefore, and because of its invasive character, the oxygen electrode has not become a general clinical tool for measuring tumor hypoxia. The most promising approach to visualizing hypoxia appears to be imaging by PET, provided a tracer that is a true hypoxia marker is applied. Ken Krohn and his group in Seattle were the first to successfully demonstrate the potential of PET using fluoromisonidazole (FMISO) as the tracer (7–11). Moreover, the value of PET and FMISO was illustrated by further clinical studies (12–14). The tracer most extensively studied both in humans and in animals is 18F-FMISO (15–18). Other tracers such as 18F-FAZA and 60Cu-ATSM are also under evaluation (19–24).
Previous results for FMISO suggest that it is feasible for imaging hypoxia and shows the regional distribution of tumor hypoxia, usually expressed as fractional hypoxic volume. This information may become more relevant when intensity-modulated radiation therapy (25) is applied (26). Thus, integration of hypoxia data obtained by FMISO PET into the radiation-planning process appears desirable. However, the prognostic value of FMISO has not been validated in clinical studies. Therefore, the aim of our study was to analyze uptake of FMISO in 2 tumor entities that are usually treated by radiation—advanced-stage non-small cell lung cancer (NSCLC) and head and neck cancer (HNC)—and to compare uptake with clinical outcome after treatment.
MATERIALS AND METHODS
Patients
From November 2001 to March 2004, we prospectively studied 40 patients (34 male and 6 female; mean age, 60.1 y; median, 60.7 y) with NSCLC (n = 14) or HNC (n = 26) before radiotherapy. The study protocol was approved by the ethical committee of the University of Tuebingen. All patients gave written informed consent before entering the study. Patients were excluded if they had a second malignancy or distant metastases, previous radiotherapy, severe complications, or severe concomitant diseases (diabetes, liver failure, or renal failure).
FMISO PET Scanning and Image Reconstruction
PET investigations were performed with a whole-body PET scanner (Advance; General Electric Medical Systems). We administered 350–450 MBq of 18F-FMISO intravenously with an automated bolus injection technique (12 s). In all but 3 patients, dynamic scans were obtained for 14 min (12 frames of 10 s, 8 frames of 15 s, and 10 frames of 1 min). Two and 4 h after injection, static emission scans were obtained. PET scans were processed using iterative reconstruction and measured attenuation correction. Whenever logistically possible, we performed additional fusion imaging with a dual-head coincidence γ-camera equipped with an integrated x-ray tube and dedicated fusion software (Millennium VG; General Electric Medical Systems) 3 h after injection of FMISO.
Other Imaging Procedures
All patients underwent CT as part of the pretreatment diagnostic work-up and for radiotherapy planning.
18F-FDG PET was performed on 32 of the 40 patients (13/21 patients with proven outcome). It was not performed on the first 8 patients because it was not part of the original study protocol, but preliminary analysis of the first patients showed that despite image fusion, the tumor delineation was not accurate in all cases because of the limited quality of low-dose CT.
Region-of-Interest (ROI) Analysis and Quantification
Definition of ROI.
Tumor ROIs were drawn manually on late images within the slice with the highest tumor uptake, applying a 50% isocontour technique (50% between maximum and background). When the tumor could not be delineated because of low FMISO uptake, ROIs were drawn using fused low-dose CT or 18F-FDG images.
Reference Tissues.
In HNC, the neck muscle was chosen for reference, and in NSCLC, a tumor-free area in the mediastinum was chosen. Other regions (vertebrae, cerebellum, lung, left ventricle, myocardium) were also assessed exploratively but not used as reference tissue because of much higher interindividual variability. The ROI size was 5 × 3.5 mm (oval) in the neck muscle; for mediastinum, we drew circular ROIs with a diameter of 5 mm.
Quantification.
FMISO uptake 2 and 4 h after injection was quantified by calculation of standardized uptake values (SUV = 1 g/mL × measured radioactivity × body weight/injected radioactivity) and tumor–to–reference tissue ratios (T/Rs). In the following, T/Mu denotes the tumor-to-muscle ratio (HNC) and T/Me denotes the tumor-to-mediastinum ratio (NSCLC).
Additionally, early FMISO uptake was assessed by SUV 0–2 min after injection and 5–14 min after injection. In the following, SUV at 1–2 min is also referred to as perfusion index, and SUV at 5–14 min, as nonspecific distribution volume.
Time–Activity Curves 0–14 min After Injection.
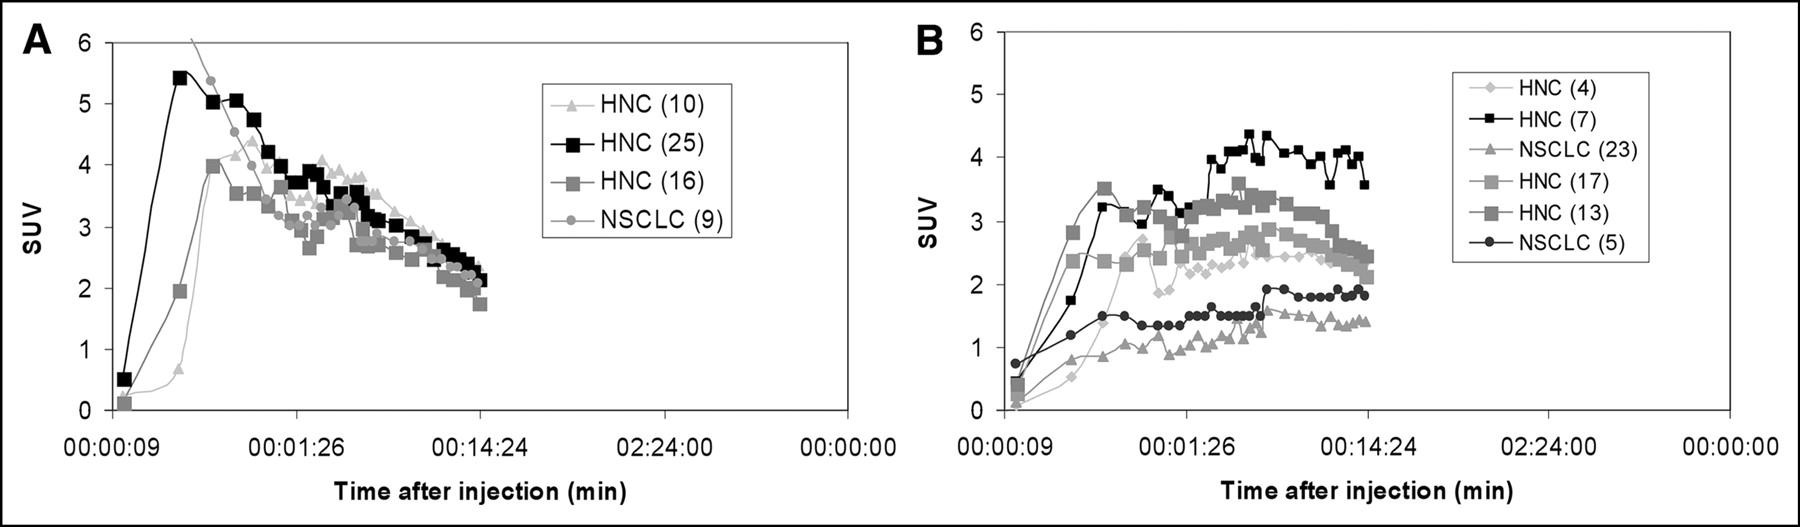
Time–activity curves were visually classified according to shape as rapid washout type (type 1), intermediate type (type 2), or accumulation type (type 3). Typical examples are shown in Figure 1.
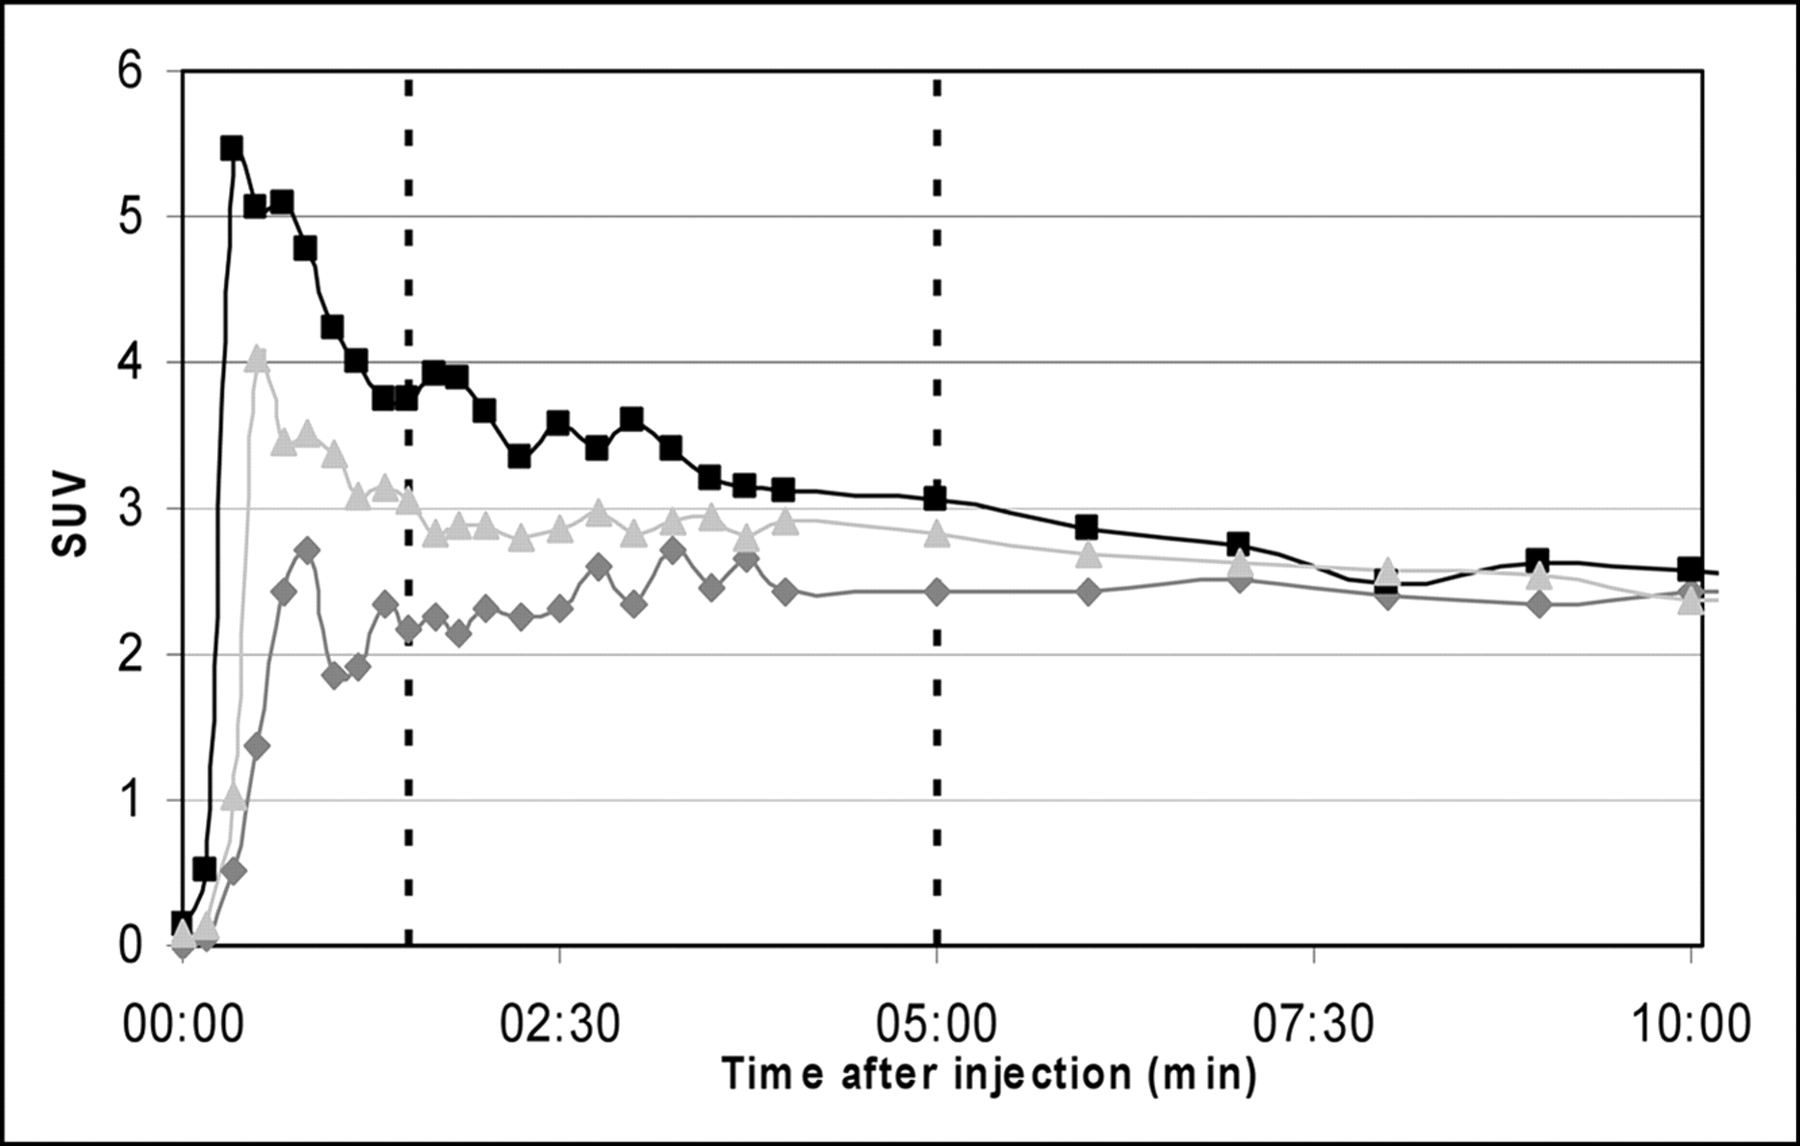
FMISO time–activity curves: typical examples of types 1 (rapid washout), 2 (intermediate), and 3 (accumulation).
Radiochemistry
18F-FMISO was synthesized as described previously (27). Briefly, in an automated synthesizer (TRACERlab FXF-N; General Electric Medical Systems), 5 mg of the precursor 1-(2′-nitro-1′-imidazolyl)-2-O-tetrahydropyranyl-3-O-toluenesulfonylpropanediol (NITTP; ABX) in 1 mL of dimethylsulfoxide were reacted with a mixture of azeotropically dried 18F-fluoride, 15 mg of Kryptofix 2.2.2. (Merck), and 3.5 mg of K2CO3 at 100°C for 10 min. After hydrolysis with 1 mL of 1N HCl (100°C, 5 min), 0.5 mL of 30% sodium acetate was added for neutralization. The product was purified with HPLC chromatography (LUNA C8; Phenomenex), using 3:97 ethanol:H2O, a 5 mL/min flow rate, 220-nm UV detection, and NaI(Tl). The product was obtained in radiochemical yields of 60% ± 14%. After irradiations of 35 μA for 15 min, 9.2 ± 1.3 GBq (n = 30) of 18F-FMISO were isolated.
Analysis of Outcome
For 21 patients, sufficient data about the clinical outcome of radiotherapy were available. They were categorized as responders or nonresponders. Responders (n = 8) had complete remission or near-total remission of the tumor, with steady state (as confirmed by repeated CT) for at least 1 y after treatment. The longest observed interval was 28 mo. Nonresponders (n = 13) had progressive disease, or only partial remission after completion of radiotherapy, or local recurrence within a follow-up period of 1 y. For statistical reasons, we did not separate patients with progressive disease from those with local recurrence.
Statistical Analysis
We tested the hypothesis that SUV at 4 h predicts the response to radiotherapy. Analysis of the other parameters focused on the following questions: Do T/Rs provide information additional to that provided by SUV? Do time–activity curves provide relevant prognostic information? For how long do we have to study FMISO distribution to obtain optimal results?
To confirm that FMISO uptake has prognostic value (SUV, T/R), we tested the significance of group differences (responders vs. nonresponders) using the Student t test with unequal variances and selected optimal cutoff values for separating responders from nonresponders.
RESULTS
FMISO uptake varied widely between individuals and differed considerably between different parts of tumors. Figure 2 shows the FMISO distribution, compared with the 18F-FDG distribution, 4 h after injection in a patient with HNC: Although 1 lymph node metastasis showed focally enhanced FMISO uptake, the primary tumor and the other lymph node metastasis did not. In general, FMISO uptake did not correlate with 18F-FDG uptake (R2 = 0.015), as agrees with the different uptake mechanisms of the 2 tracers. Figure 3 shows a typical large tumor with high FMISO uptake and heterogeneous distribution. The highest FMISO uptake was found in the rim of an extensive necrosis (as assessed by 18F-FDG PET). In this area, analysis of time–activity curves revealed steady accumulation throughout the first 2 h up to an SUV of 3.05. In the middle of the necrosis, FMISO accumulated steadily too, although on a much lower level (up to an SUV of 1.5 at 4 h). In contrast, rapid FMISO washout was observed in tumor areas neighboring large vessels.
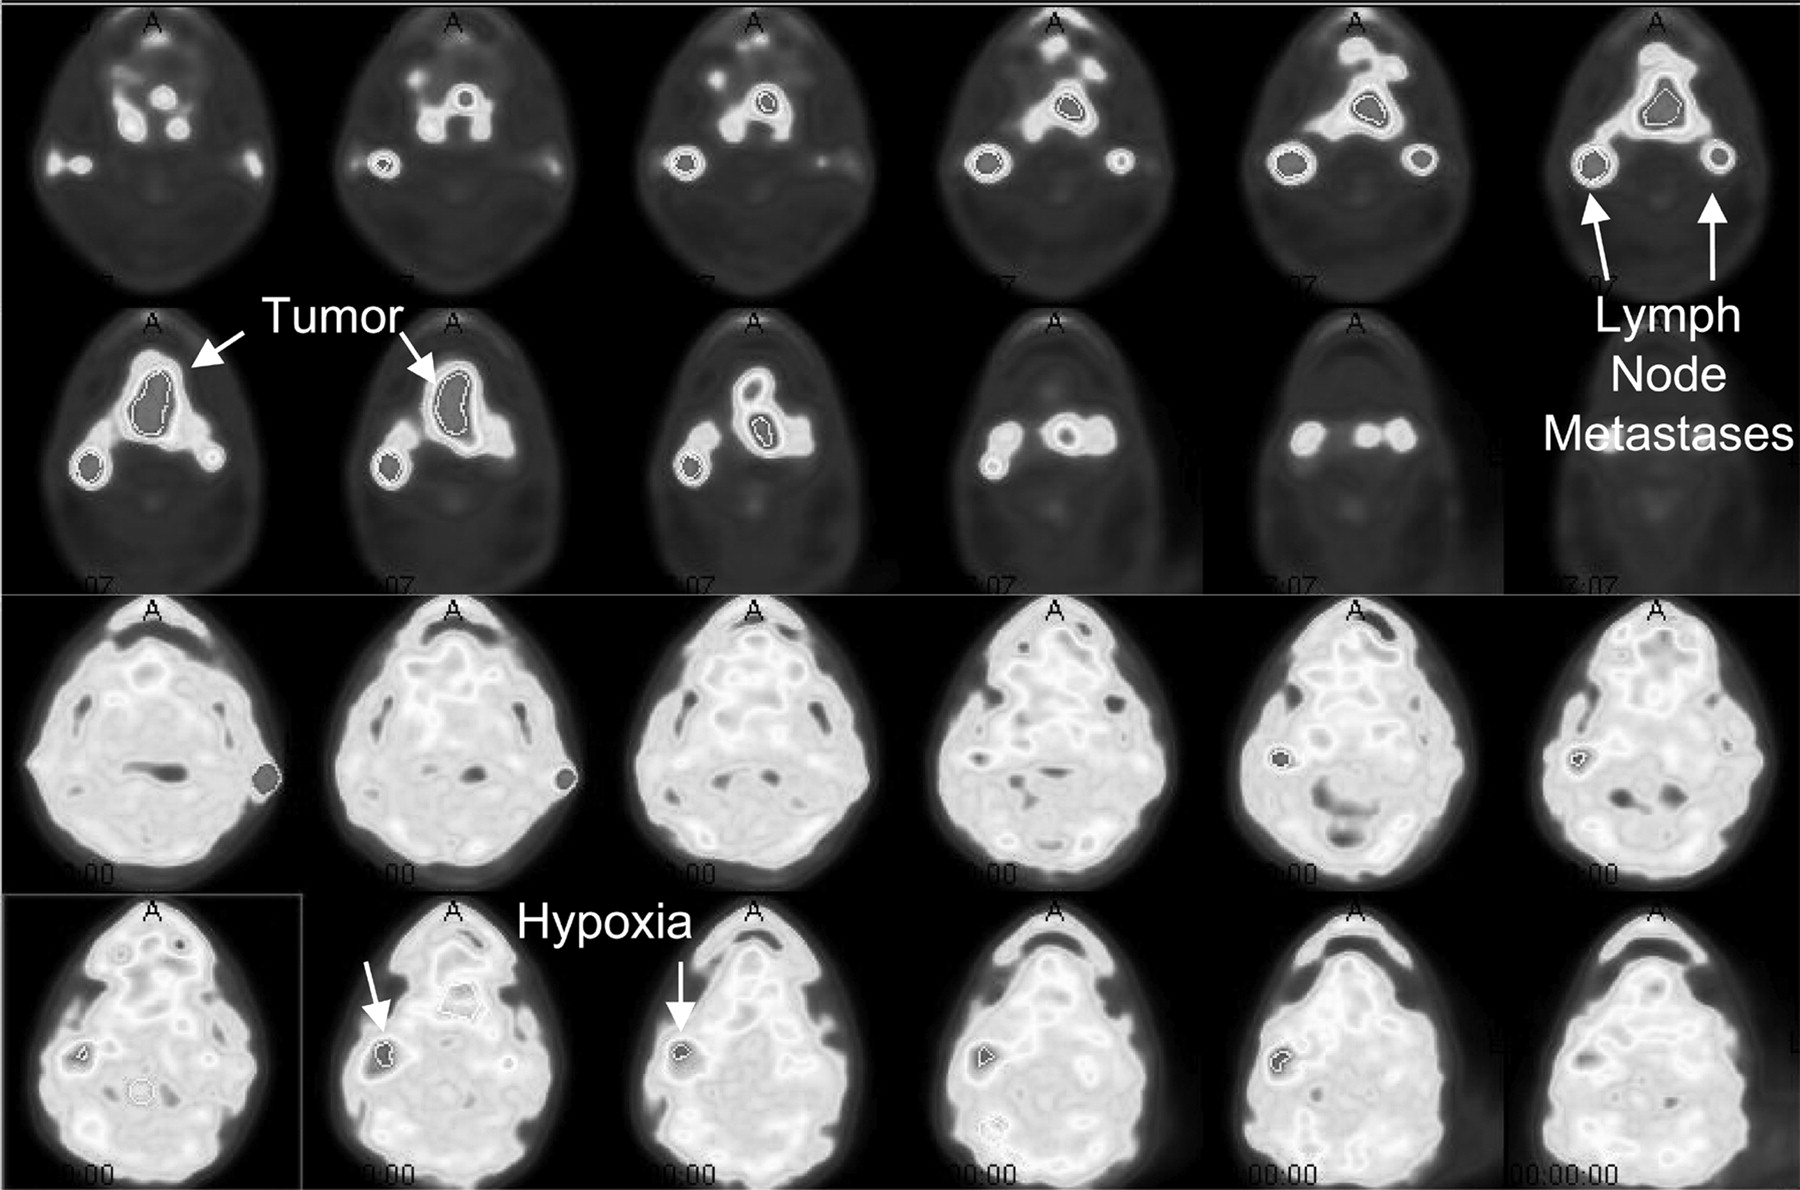
Findings of 18F-FDG (top 2 rows) and FMISO PET (bottom 2 rows) for patient 24. 18F-FDG data are used to demonstrate viable tumor tissue. Lymph node metastasis shows high FMISO uptake, whereas large primary tumor and other lymph node metastasis reveal only moderate uptake. External marker is behind left ear.
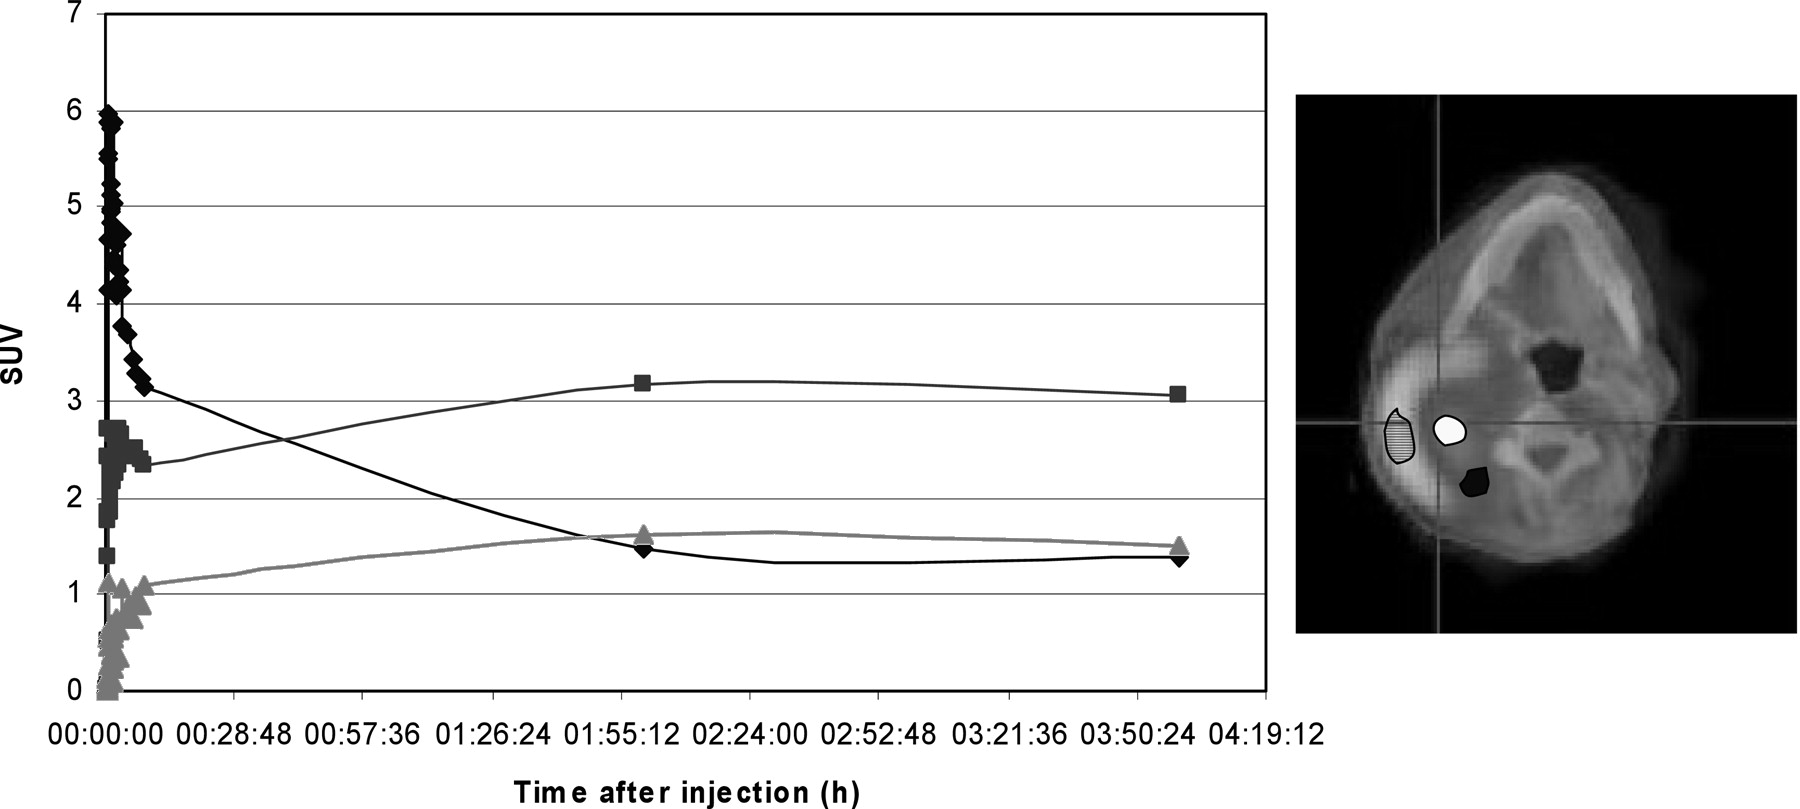
FMISO curves of different areas of large HNC tumor (fused image is at right). Necrosis (▴) shows poor perfusion (missing peak) and increasing FMISO accumulation, presumably reflecting hypoxia. Viable tumor (♦) shows high perfusion and subsequent rapid washout, reflecting good oxygenation. Tumor tissue surrounding necrosis (▪) shows impaired perfusion (low peak) followed by accumulation, reflecting hypoxia.
FMISO Time–Activity Curves.
In more than 50% of all patients, 2 typical shapes were revealed for FMISO time–activity curves: the rapid washout type and the accumulation type. In the remaining patients, a variety of intermediate variants were seen. We visually classified the individual time–activity curves accordingly, applying the following criteria (Fig. 3). The rapid washout type (type 1) was a curve with a high perfusion peak followed by rapid washout (n = 8). The intermediate type (type 2) was a curve not meeting the criteria of types 1 or 3. Most exhibited a perfusion peak lower than in type 1, followed by an approximately horizontal or slightly decreasing course (n = 12). The accumulation type (type 3) was a curve with a missing or delayed lower perfusion peak, followed by a horizontal or ascending course (n = 17). For 3 patients, curve classification was not possible because of incorrect data acquisition.
FMISO SUV and T/R.
The SUVs 2 and 4 h after injection (Table 1) in the tumor ranged from 1.1 to 4.3 (maximum in ROI) in HNC. In NSCLC, the SUVs were slightly lower, ranging from 1.2 to 2.7 (SUV at 2 h) and from 1.0 to 3.7 (SUV at 4 h). In HNC, the SUV at 4 h closely correlated with the SUV at 2 h (R2 = 0.93), whereas in NSCLC the correlation was weaker (R2 = 0.63). T/Me (NSCLC) was significantly higher than T/Mu (HNC) (P = 0.002 in T/R at 4 h) (Table 1), as can be attributed to significantly lower SUV in mediastinum (P < 0.001) (SUV at 2 h = 0.85 ± 0.25; SUV at 4 h = 0.77 ± 0.26) than in muscle (SUV at 2 h = 1.19 ± 0.15; SUV at 4 h = 1.07 ± 0.17).
SUV and T/R for HNC and NSCLC
Prognostic Value of FMISO and 18F-FDG
Outcome data were available for 21 patients. Eight were responders, 13 nonresponders (Table 2).
Outcome Data
FMISO Time–Activity Curves.
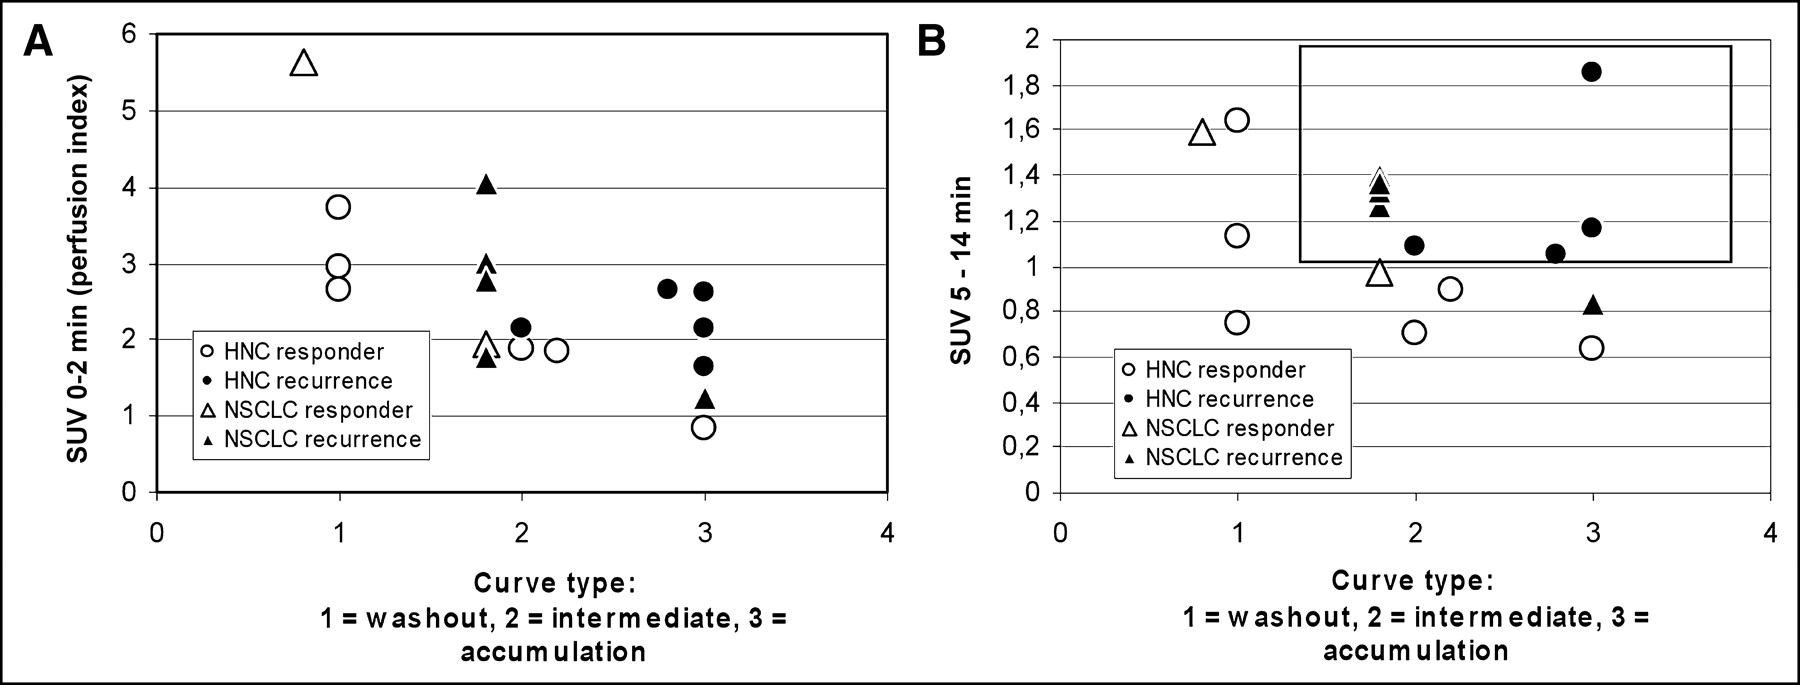
The curve type clearly correlated with outcome: None of 4 patients with a type 1 curve had tumor recurrence (Fig. 4A), but 5 of 8 patients with type 2 and 5 of 6 patients with type 3 (Fig. 4B) had tumor recurrence. In an exploratory analysis, we found that tumor recurrence in patients with curves of type 2 or 3 correlated strongly with SUV at 0–2 h (Fig. 5A) and at 5–14 min (Fig. 5B). If we had applied a cutoff of >1.0 for SUV at 5–14 min, 9 of 10 patients with tumor recurrence and type 2 or 3 curves would have been identified correctly.

Outcome for patients with characteristic curve types: patients with type 1 (washout type; no disease recurrence) (A) and patients with type 3 (accumulation type; recurrence in 5 of 6 patients) (B).

Outcome vs. curve type and early FMISO uptake: All patients with type 1 were responders. Patients with type 2 or 3 could further be discriminated by analyzing SUV 0–2 min after injection (A) and 5–14 min after injection (B). Area enclosed by rectangle represents area of high risk: All patients with data within this range experienced relapse.
SUV and T/R.
In HNC, the SUV at 4 h after injection correlated significantly with tumor recurrence (Student t test: responder vs. nonresponder, P at 4 h = 0.04 vs. P at 2 h = 0.16), whereas no such correlation was observed for NSCLC (Fig. 6A). In HNC, all patients with an SUV of >2 at 4 h had tumor recurrence. The T/R at 4 h correlated with the outcome for both tumor entities (Fig. 6B). Application of a cutoff T/Me of ≥2 at 4 h (NSCLC) or a cutoff T/Mu of ≥1.6 at 4 h (HNC) allowed prediction of 10 of 13 tumor recurrences and all responders. The T/R at 2 h was less useful than the T/R at 4 h. Although the mean T/R at 2 h in nonresponders was higher than in responders, a clear cutoff could not be defined. For each tumor entity, the T/R at 4 h had a higher predictive value than did SUV. When the selected cutoff values for SUV and T/R were combined, 11 of 13 patients with and 8 of 8 patients without recurrence could correctly be classified.
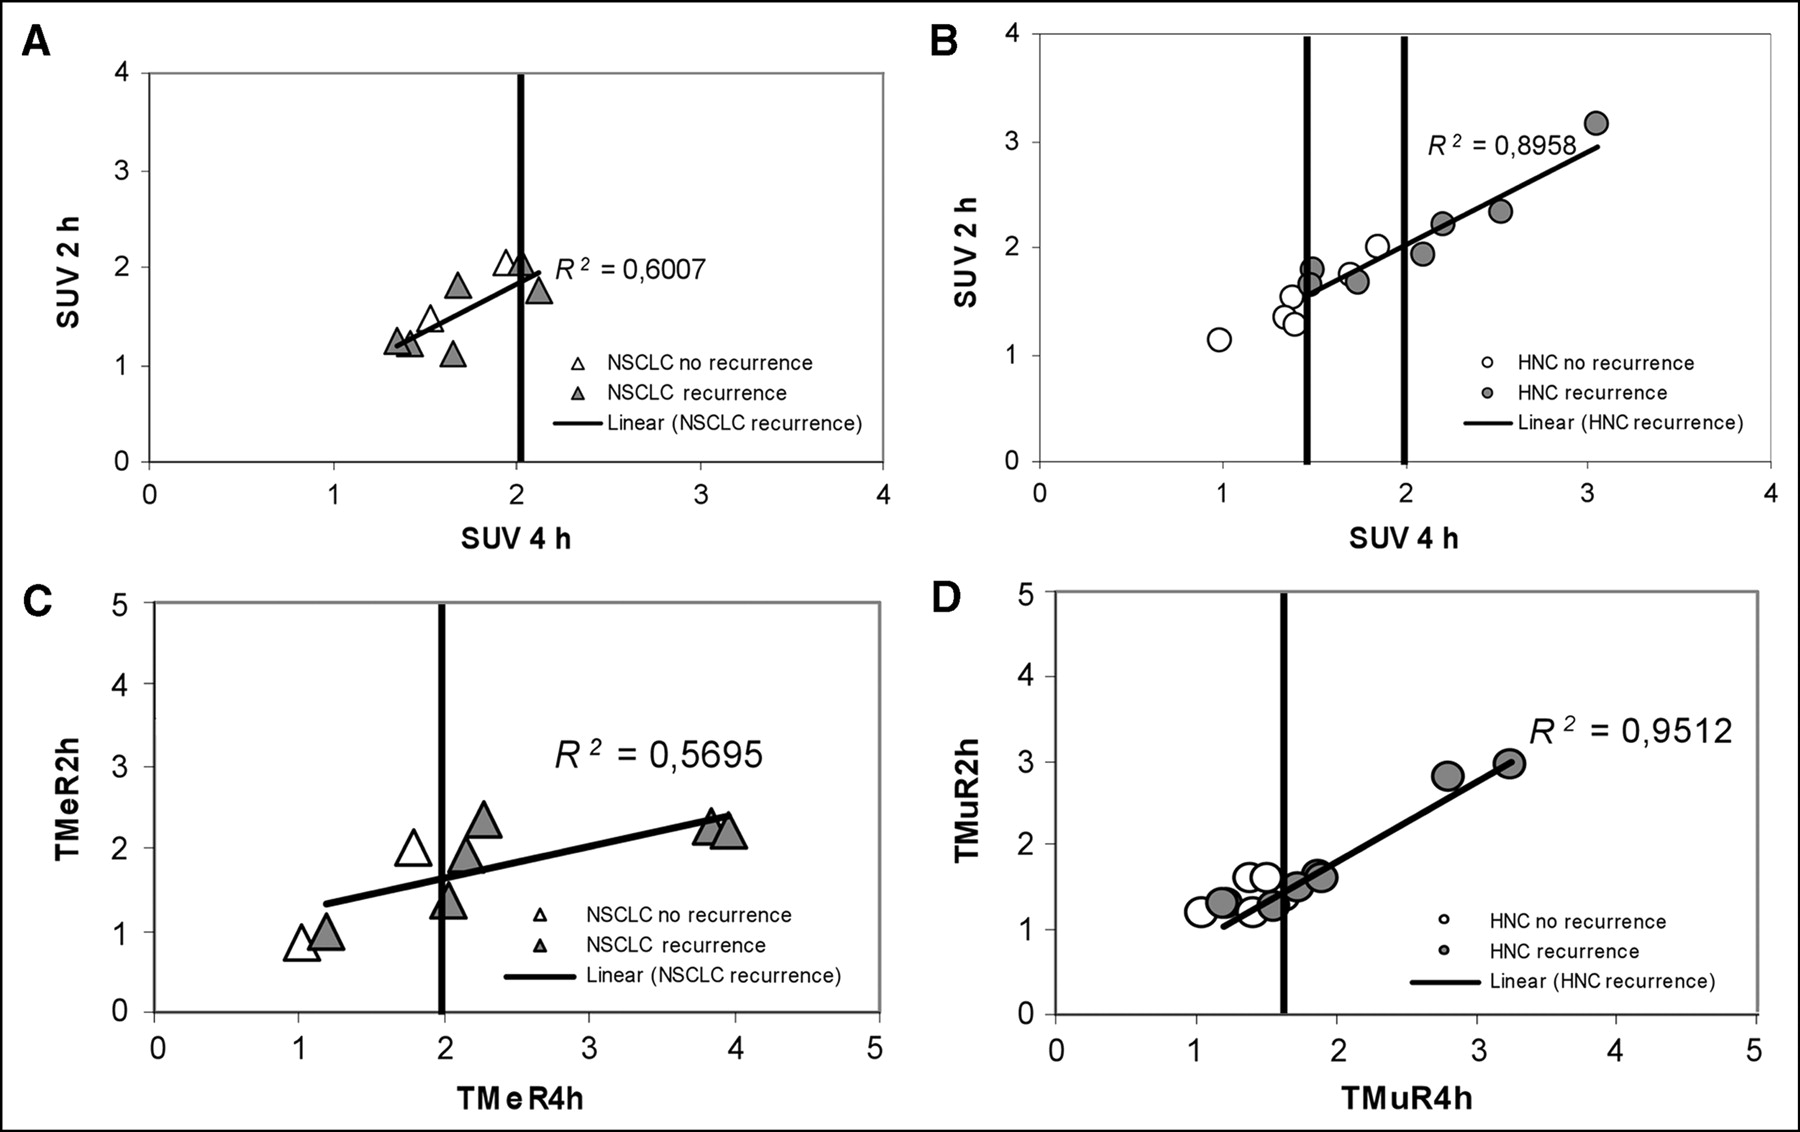
Correlation of FMISO uptake and clinical outcome. (A and B) SUV 2 and 4 h after injection vs. outcome for NSCLC (A) and HNC (B). In HNC, high correlation between 2-h and 4-h SUV is observed. In both tumors, a cutoff SUV of >2.0 separates only patients with tumor recurrence; in HNC, a cutoff of <1.4 separates disease-free patients. (C and D) T/Rs at 2 and 4 h after injection vs. outcome for NSCLC (C) and HNC (D). Using appropriate cut-offs (a T/Me of >2.0 at 4 h [NSCLC]; a T/Mu of >1.6 at 4 h [HNC]), 10 of 13 patients with tumor recurrence can be identified.
18F-FDG.
In those patients with a proven outcome, 18F-FDG SUV ranged from 3.4 to 24.8 (n = 13). No correlation between 18F-FDG uptake and tumor recurrence was observed, as illustrated in Figure 7.

Comparison of 18F-FDG uptake and clinical outcome (available for 5 patients with NSCLC and 8 with HNC).
DISCUSSION
For more than a decade, FMISO has been known as a PET tracer for hypoxia (7), yet few clinical studies have been published. Results from FMISO PET for NSCLC, HNC, and soft-tissue sarcomas before and during ongoing radiotherapy have been reported (7–15,23). To our knowledge, an analysis of response to radiotherapy has not been reported. Although pharmacokinetic models have also been developed (28), most of the clinical studies have relied on more simplified quantification procedures such as the calculation of tumor-to-blood or tumor-to-muscle ratios (29). Instead of ratios for tumor to blood or tumor to muscle, a fractional hypoxic volume was calculated by applying a fixed cutoff value. Following the rationale that more than 99% of normal tissue is below this threshold (10), the hypoxic fraction gives the percentage of the whole tumor volume above this threshold.
In this study, we chose a different approach and assessed various quantitative parameters postulating that both the presence and the magnitude of specific FMISO uptake are of prognostic value. We also visually assessed time–activity curves of the first 14 min after injection of FMISO. This approach has not been reported for FMISO in the literature because the effects of tissue hypoxia are generally assumed to be more pronounced at later times. Being aware that these curves are hard to interpret because of the many unknown kinetic properties of the tumor (e.g., fractional vascular volume, perfusion, extraction, microvessel density (30), and hypoxia-related and hypoxia-independent metabolism of FMISO), we hypothesized that a fast washout is predictive of absence of relevant tumor hypoxia and thus of good radiosensitivity of the tumor.
Predictive Value of SUV and T/R
In accordance with previous studies, we found a correlation between late uptake parameters of FMISO (SUV and T/R) and tumor recurrence, as both are linked to the presence of hypoxia. However, an important finding was that T/R was more predictive than SUV. This finding might be explained by interindividual variances in plasma clearance of FMISO that affect the SUV in tumor and in reference tissues. In our patients, a T/Me greater than 2.0 or a T/Mu greater than 1.6 was highly predictive of later tumor recurrences. The observed different cutoffs roughly correspond to differences in SUV of the reference tissues.
Early Time–Activity Curves
In our study, we classified time–activity curves according to 3 types that were derived after analyzing the scans of the first 10 patients. Correlation with clinical outcome was performed prospectively. Therefore, we are confident that the observed differences (type 1: recurrence in 0/4 patients; type 3: recurrence in 5/6 patients) reflect the prognostic relevance of these curve types. Additional kinetic parameters separating responders from nonresponders in patients with curves of type 2 or 3 were found exploratively (SUV at 0–2 h and at 5–15 h). Because of the small number of patients (4/14 with type 2 or 3) without recurrence, those findings are preliminary and have to be substantiated by a study with a large number of patients.
Suggested Acquisition Protocol
Early animal studies of Rasey et al. (spontaneous osteosarcoma in dogs) indicated that the most useful PET information is obtained during the first 3 h after drug injection. Further extension of imaging did not yield additional information (10). However, no systematic clinical data have been published on acquisition protocols optimal for predicting the outcome of later radiotherapy. In our study group, the T/R at 4 h allowed better outcome prediction than did the T/R at 2 h. Whether this difference reflects actual superiority of imaging has to be confirmed with larger patient cohorts. Because static images 4 h after injection are feasible using an 18F-labeled compound, we suggest extending current protocols. Because our data indicate a relevant correlation between the type of early FMISO time–activity curve and clinical outcome, we suggest obtaining dynamic data for at least 14 min after injection whenever possible. We used the FMISO distribution in late images to define representative tumor ROIs. Thus, we do not suggest reducing FMISO imaging to dynamic scans of 0–15 min instead of sequential scanning for 2–4 h.
Clinical Consequences
Assuming that FMISO PET has prognostic potential with regard to subsequent radiotherapy, we end up with the questions of how the results of FMISO PET can be used for treatment planning and how FMISO data are to be integrated into radiotherapy-planning systems. On the basis of the findings of this pilot study, FMISO PET might be used to identify patients who need intensified treatment. In our study group, tumor recurred in all patients with an SUV greater than 2.0 and in all patients with a tumor-to-tissue ratio above the threshold of 2.0 (NSCLC) or 1.6 (HNC). Combining these 2 simple criteria would lead to correct prediction of tumor recurrence in 11 of 13 patients. Results become even better if curve-type analysis is considered. Using type 1 as an indicator of good treatment response, and type 3 combined with SUV and T/R above the cutoff as an indicator of poor response, would lead to appropriate classification of 19 of 21 patients with proven clinical outcome (>90%). Assessment of early FMISO uptake (0–14 min after injection) combined with curve-type analysis was most accurate for discriminating patients with a favorable response from those with a poor response: Nearly all patients (5/6) with type 3 curves and most patients (5/8) with type 2 curves were not treated successfully. Additional analysis of early uptake (0–14 min after injection) allowed the individual risk of recurrence to be defined in more than 90% of all patients (17/18).
For radiotherapy planning, valid information about the precise location of hypoxic areas is mandatory. Using ROI data as described in this paper may lead to problems because of heterogeneous regional tissue properties. Comparing FMISO distribution 2 and 4 h after injection, we found that the areas of highest FMISO uptake were not constant over time. As a consequence, tumor regions defined as hypoxic on the basis of cutoff values (SUV or T/R) shifted. Regional curve analysis revealed that different curve types often were present in the same tumor. Thus, a regional (voxel-by-voxel) kinetic analysis that takes into account early as well as late FMISO data and that can easily be integrated into radiation-planning systems is needed.
CONCLUSION
Our data indicate that FMISO PET has the potential to predict response to subsequent radiotherapy. This finding corroborates the results of previous studies showing that hypoxia imaging with FMISO is feasible and that enhanced FMISO uptake indicates tissue hypoxia. In our study, an SUV T/Me greater than 2.0 (NSCLC) or an SUV T/Mu greater than 1.6 (HNC) proved to be a suitable parameter for predicting tumor recurrence or progression. Curve type and early FMISO uptake allow discrimination between responders and nonresponders. These observations may form the basis for future prospective studies combining FMISO PET and intensified radiotherapy, in particular intensity-modulated radiation therapy.
Acknowledgments
This study was financially supported by the “fortüne” program of the Eberhard-Karls-University of Tuebingen.
Footnotes
Received Jul. 4, 2004; revision accepted Sep. 27, 2004.
For correspondence or reprints contact: Susanne-Martina Eschmann, MD, Department of Nuclear Medicine, University of Tuebingen, Otfried-Mueller-Strasse 14, D-72076 Tuebingen, Germany.
E-mail: susanne-martina.eschmann{at}med.uni-tuebingen.de
REFERENCES
In this issue


Jump to section
Related Articles
Cited By...
- Mitochondrial Inhibitor Atovaquone Increases Tumor Oxygenation and Inhibits Hypoxic Gene Expression in Patients with Non-Small Cell Lung Cancer
- Tumor Hypoxia Detected by 18F-fluoromisonidazole Positron Emission Tomography (FMISO PET) as a Prognostic Indicator of Radiotherapy (RT)
- Learning from Failure; Hypoxia Is an Evil Foe
- Multiparametric Imaging of Tumor Hypoxia and Perfusion with 18F-Fluoromisonidazole Dynamic PET in Head and Neck Cancer
- Pharmacokinetic Analysis of Dynamic 18F-Fluoromisonidazole PET Data in Non-Small Cell Lung Cancer
- Feasibility of 18F-Fluoromisonidazole Kinetic Modeling in Head and Neck Cancer Using Shortened Acquisition Times
- Hypoxia drives transient site-specific copy gain and drug-resistant gene expression
- In Vivo Quantification of Hypoxic and Metabolic Status of NSCLC Tumors Using [18F]HX4 and [18F]FDG-PET/CT Imaging
- Parametric Methods for Quantification of 18F-FAZA Kinetics in Non-Small Cell Lung Cancer Patients
- Characterization of Different Osteosarcoma Phenotypes by PET Imaging in Preclinical Animal Models
- 18F-Fluoromisonidazole PET/CT: A Potential Tool for Predicting Primary Endocrine Therapy Resistance in Breast Cancer
- High Reproducibility of Tumor Hypoxia Evaluated by 18F-Fluoromisonidazole PET for Head and Neck Cancer
- Biologic Imaging of Head and Neck Cancer: The Present and the Future
- New Strategies in Non-Small Cell Lung Cancer: Improving Outcomes in Chemoradiotherapy for Locally Advanced Disease
- Metastatic Renal Cell Carcinoma: Relationship Between Initial Metastasis Hypoxia, Change After 1 Month's Sunitinib, and Therapeutic Response: An 18F-Fluoromisonidazole PET/CT Study
- Hypoxia in Models of Lung Cancer: Implications for Targeted Therapeutics
- Innovations in Radiotherapy Planning of Head and Neck Cancers: Role of PET
- Dose Painting in Radiotherapy for Head and Neck Squamous Cell Carcinoma: Value of Repeated Functional Imaging with 18F-FDG PET, 18F-Fluoromisonidazole PET, Diffusion-Weighted MRI, and Dynamic Contrast-Enhanced MRI
- The Translational Research Working Group Developmental Pathway for Image-Based Assessment Modalities
- Molecular Imaging of Hypoxia
- Correlative Imaging of Hypoxia and Angiogenesis in Oncology
- Assessing Tumor Hypoxia in Cervical Cancer by PET with 60Cu-Labeled Diacetyl-Bis(N4-Methylthiosemicarbazone)
- Application of PET/CT in the Development of Novel Anticancer Drugs
- Pretreatment 18F-FAZA PET Predicts Success of Hypoxia-Directed Radiochemotherapy Using Tirapazamine
- Lack of Correlation of Hypoxic Cell Fraction and Angiogenesis with Glucose Metabolic Rate in Non-Small Cell Lung Cancer Assessed by 18F-Fluoromisonidazole and 18F-FDG PET
- Hypoxia in head and neck cancer
- Concurrent Chemoradiotherapy for Locally Advanced, Nonmetastatic, Squamous Carcinoma of the Head and Neck: Consensus, Controversy, and Conundrum
- Computer-assisted analysis of biopsy specimen microvessels predicts the outcome of esophageal cancers treated with chemoradiotherapy.
- An Evaluation of Tumor Oxygenation and Gene Expression in Patients with Early Stage Non-Small Cell Lung Cancers
- Correlation of Hypoxic Cell Fraction and Angiogenesis with Glucose Metabolic Rate in Gliomas Using 18F-Fluoromisonidazole, 18F-FDG PET, and Immunohistochemical Studies
- The potential of PET to increase understanding of the biological basis of tumour and normal tissue response to radiotherapy