


Abstract
PET offers a noninvasive means to assess neoplasms, in view of its sensitivity and accuracy in staging tumors and potentially in monitoring treatment response. The aim of this study was to evaluate newly diagnosed primary brain tumors for the presence of hypoxia, as indicated by the uptake of 18F-fluoromisonidazole (18F-FMISO) and to examine the relationship of hypoxia to the uptake of 18F-FDG and molecular markers of hypoxia. Methods: Seventeen patients with suspected primary glioma were enrolled prospectively in this study. Sixteen patients had histology, with 2 having metastatic disease. All patients had PET studies with 18F-FMISO and 18F-FDG and MRI studies. Immunohistochemistry was undertaken with tumor markers of angiogenesis and hypoxia. Patients were monitored for disease progression and statistical analysis of data was performed. Results: Of the 14 patients with histology, 8 died with a median time of 16 mo (range, 2−30 mo) until death. Of those who died, 7 had positive and 1 had negative 18F-FMISO uptake. 18F-FMISO uptake was observed in all high-grade gliomas but not in low-grade gliomas. A significant relationship was found between 18F-FDG or 18F-FMISO uptake and expression of VEGF-R1 and Ki67 expression. Other immunohistochemical markers demonstrated a trend toward increased uptake but none was significant. Conclusion: 18F-FMISO PET provides a noninvasive assessment of hypoxia in glioma and was prognostic for treatment outcomes in the majority of patients.18F-FMISO PET may have a role not only in directing patients toward targeted hypoxic therapies but also in monitoring response to such therapies.
PET offers a noninvasive means to assess neoplasms, in view of its sensitivity and accuracy in staging tumors and potentially in monitoring treatment response. 18F-FDG PET is a metabolic imaging modality used to differentiate benign from malignant lesions, for grading, staging, and restaging malignancies, differentiating recurrent disease from therapy-induced changes and monitoring response to therapy, and assessing prognosis (1–6). PET allows not just for improved staging and assessment of response to treatment but also the ability to differentiate individual tumor biology more accurately and modify treatment accordingly. The recent development of PET tracers targeting tissue hypoxia, cellular proliferation, protein and membrane biosynthesis, tumor receptor, and gene product expression provides further tools to evaluate the molecular profile of tumors (7–10).
Malignant tumors have been shown to have increased glucose use, poor perfusion, and areas of low oxygenation (hypoxia) (11–13). Hypoxia in tumors is a pathophysiologic consequence of structurally and functionally disturbed angiogenesis along with deterioration in the inability of oxygen to diffuse through tissues (13). Hypoxia in tumors is associated with propagation and progression, as well as resistance to radiotherapy (RT) and some forms of chemotherapy (14–16). Therefore, patients with tumors having significant hypoxia have poorer disease-free and overall survival probabilities compared with those with better-oxygenated tumors (17,18). With recent indications that hypoxia may also induce the expression of specific genes and promote more aggressive tumor phenotypes, its diagnosis is even more important in some tumors (13,19).
Radiolabeled nitroimidazoles have emerged as promising developments in the noninvasive assessment of human tumor hypoxia. Nitroimidazoles are metabolized by intracellular nitroreductases and at low oxygen levels serve as competing electron acceptors. They are reduced and form covalent bonds to macromolecules, thus becoming biochemically trapped within these hypoxic yet metabolically active cells (20). The metabolism of nitroimidazoles relies on active electron transport enzymes and, thus, does not occur in necrotic tissues. Nitroimidazoles bind to cells at a rate that is maximal under conditions of severe hypoxia (e.g., <0.05% oxygen) and are inhibited as a function of increasing oxygen concentration (21). One of the most extensively studied bioreductive hypoxic probes is 18F-fluoromisonidazole (18F-FMISO). The uptake of 18F-FMISO in hypoxic tissues has correlated favorably with the “gold standard” of tissue measurement using invasive polarographic oxygen electrodes in several studies (20,22–24). PET of hypoxia using 18F-FMISO is a technique that has the ability to directly image the hypoxic cell fraction of tissue (25,26).
In our institution, 18F-FMISO has been used to demonstrate hypoxic regions of brain in stroke patients (26–28), whereas other groups have investigated anaerobic infections (11,29) and myocardial ischemia (30). In tumors, 18F-FMISO PET studies have demonstrated hypoxia in nasopharyngeal (31) and other head and neck tumors (20,32–34) as well as in non–small cell lung tumors (33–35), soft-tissue tumors (18,36), and gliomas (12,37). Importantly, serial PET scans have been used in several studies that have demonstrated a correlation between patients responding to treatment and those whose tumors (head and neck cancers, lung tumors, and sarcomas) showed a reduction in hypoxic fractions by the end of treatment (18,32,34,35).
The application of 18F-FMISO to imaging cerebral tumors is yet to be completely defined. To our knowledge, there have only been 2 studies to date that have measured the uptake of 18F-FMISO in patients with high-grade gliomas (12,37). However, the relationship of hypoxia to metabolic parameters such as glucose uptake, tumor grade, and markers of hypoxia such as hypoxia-inducible factor 1-α (HIF-1α) has not been established. The ability to detect and quantify hypoxia has immediate clinical relevance in glioma, because the hypoxic fraction of the tumor at the time of diagnosis may have a significant impact on treatment outcome and ultimate prognosis. The aim of this study was to evaluate the uptake of 18F-FMISO within newly diagnosed primary brain tumors, its pattern of distribution, and the relationship to the uptake of 18F-FDG. A further objective was to correlate immunohistochemistry with regard to hypoxia and angiogenesis markers that are overexpressed in tumors (e.g., HIF-1α) with hypoxia and to establish the relationship between PET, in vivo imaging of hypoxia in tumor, and immunohistochemistry findings.
MATERIALS AND METHODS
Seventeen patients with suspected primary glioma on imaging and suitable for surgery were enrolled prospectively in this study. This protocol was approved by the Austin Hospital Ethics Committee.
PET
18F-FDG and 18F-FMISO were synthesized using 18F produced by an in-house 10-MeV cyclotron (Ion Beam Applications s.a.) as described in previous studies (26,27,38). Samples of 18F-FDG and 18F-FMISO underwent quality control assessment before clinical studies. 18F-FDG and 18F-FMISO studies were performed on different days, 24−48 h apart. 18F-FMISO scanning was conducted 2 h after the administration of 18.5 MBq/kg (0.05 mCi/kg) of 18F-FMISO to allow for tracer equilibrium. 18F-FDG PET images were acquired after a minimum of 6 h of fasting, in 2-dimensional mode and with measured attenuation corrections. All PET images were acquired on a Siemens ECAT 951/31R PET scanner (CTI PET Systems). The high-sensitivity 3-dimensional (3D) acquisition mode was used for the 18F-FMISO studies. Measured attenuation correction was performed with the 3D PET datasets reconstructed using a standard algorithm (39).
PET Data Analysis
Accurate registration of PET and MRI data was obtained using a register program (McConnell Brain Imaging Centre, Montreal Neurologic Institute, McGill University, Montreal, Canada). This enabled fusion of both datasets for analysis ensuring accurate spatial comparison of both in vivo imaging modalities. The 18F-FMISO images were normalized by dividing each voxel by the mean value of all intracerebral voxels. A gaussian kernel 6 × 6 × 6 mm (full width half maximum in the x-, y-, and z-planes, respectively) was then applied to remove high-frequency noise from the images. Data from 18F-FMISO PET scans acquired in 15 healthy subjects was available to allow comparison and images were globally normalized to the intracerebral mean (40). A population comparison test was then performed using statistical parametric mapping (SPM) 99 software (Wellcome Department of Imaging Neuroscience, U.K.) between each individual 18F-FMISO tumor study and the healthy subjects. The standard SPM99 maximum-intensity-projection plots were generated using a threshold of P uncorrected = 0.001 and a voxel extent threshold = 27.
SPM was used only to illustrate that there is a statistically significant difference between the 2 populations, healthy and glioma. One could use the analysis to then define regions of interest (ROIs) and further test the hypothesis against histology. However, ROIs were determined on the basis of areas of 18F-FDG uptake.
18F-FDG PET axial images underwent attenuation correction and were then analyzed qualitatively and by maximium standardized uptake values (SUVmax) in ROIs for tumor and reference tissue in the contralateral normal hemisphere. The selection of respective ROIs was based on identifying the pixel with maximal uptake in the region.
MRI Scanning
Scanning on all patients was performed on a single MRI machine using T1 and T2 imaging and gadolinium contrast enhancement (1.5-T Siemens Magnetom SP; Siemens AG). Accurate registration of PET (18F-FDG or 18F-FMISO) and MRI data was obtained as discussed and this was important for identifying the central portion of tumors that were analyzed histologically after resection or where biopsies were obtained from the central most accessible portions of the tumors.
Seven-minute volumetric MRI was performed using the magnetization prepared rapid-acquisition gradient-echo (MPRAGE) protocol (repetition time = 12.5 ms, echo time = 5 ms, flip angle = 10°). This protocol generated images with high gray and white brain matter contrast throughout the brain volume and allowed PET/MRI registration with improved voxel resolution (0.98 × 0.98 × 1.6 mm). Gadolinium enhancement patterns were also assessed alongside tumor morphology. Each subject's MRI was spatially normalized using the same transformation parameters derived from the MRI spatial normalization.
Histopathology
The final outcome for the presence of disease was based on histopathology obtained by stereotactic biopsy or surgical resection, within 2 wk of undergoing the imaging studies. The World Health Organization grading scheme was used for characterization of gliomas. MRI data were used to cross reference points where histology was obtained of the specimen or by biopsy.
Tumor Markers of Hypoxia, Proliferation, and Angiogenesis: Immunohistochemistry
Formalin-fixed, paraffin-embedded tumor tissue from each patient on trial was immunostained by the labeled avidin–biotin method. Negative controls for the immunostaining procedure were prepared by omission of the primary antibody or by using an IgG-matched control antibody. Intensity of staining was described as negative (–), weak (+), moderate (++), and strong (+++).
Positive expression of the glucose transporter protein type 3 (GLUT-3), the nuclear antigen Ki67 (Immunotech), HIF-1α, vascular endothelial growth factor (VEGF), and its receptor (VEGF-R1) markers (Santa Cruz Biotechnology, unless stated otherwise) was determined as follows: Tumor sections were observed in high-power (×400) fields with the aid of a graticule providing an area of 250 μm2 per field. The number of fields observed was dependent on the amount of viable tissue available, and fields were matched for each marker. The number of tumor cells stained divided by the total number of tumor cells was expressed as a percentage.
Microvessel density (MVD) was determined in the same high-power fields for each patient using staining specific for the endothelial cells with von Willebrand factor (VWF; Dako) to identify individual blood vessels. Discrimination between regions of high or low vascularity was arbitrarily determined by the median value. Areas greater than the median value were classified as areas that expressed highest vessel density (hot spots). Any endothelial cell, endothelial cell cluster, or glomeruloid vascular structure, regardless of lumen visibility, was considered a single countable microvessel (41). For statistical comparison with other tumor markers, the raw values of vessels per field were used.
Patient Outcomes
All patients were monitored for clinical outcomes, including progressive or recurrent disease or death. Outcome data were compared with 18F-FMISO PET results.
Statistical Methods
Data were analyzed using S-Plus version 6.1 for Windows (Insightful Corp.). Only data from patients with glioma were analyzed. QQ-plots of the immunohistochemistry proportion data showed these to be nonnormal with heavy asymmetric tails, so univariate analyses were performed with nonparametric methods. No correction for multiple testing was performed. A Kruskal–Wallis rank sum test or Mann–Whitney rank sum test was used to analyze the relationship between the discrete PET variables and the immunohistochemical markers. Spearman rank correlation statistics were used to determine the correlation between grade of tumor and the intrapatient mean of the markers and also to determine any correlation between markers. To apply multivariate analysis techniques, the immunohistochemistry proportion data were transformed using a modified Freeman–Tukey tranformation (42). Principal components analysis was performed on the transformed data and multivariate ANOVA (MANOVA) was used to test for differences across grades.
RESULTS
Patients
Seventeen patients (11 men, 6 women; age range, 23–76 y; mean age, 49 y) with suspected primary glioma were entered into the study. Of these 17 patients, 1 patient did not undergo biopsy, but clinical and MRI findings remained stable and were consistent with low-grade tumor. Two of the 17 patients subsequently found to have metastatic adenocarcinoma were excluded from analysis. The remainder had surgery for glioma.
Localization and Pattern of 18F-FMISO Uptake in Tumor
There was a correlation between 18F-FMISO uptake and glioma grade, with all grade IV tumors demonstrating high uptake and low-grade tumors (I and II) universally having no 18F-FMISO uptake (Table 1; Fig. 1). The uptake within the high-grade tumors had a heterogeneous pattern and was not confined to the tumor rim or other areas of gadolinium enhancement on MRI (Figs. 2 and 3).

Low-grade glioma (grade II): (A) MRI (transaxial, sagittal, and coronal). (B) 18F-FDG PET. (C) 18F-FMISO PET. Cursor shows site of glioma in left superior parietal lobe. No uptake of 18F-FDG or 18F-FMISO in low-grade glioma is evident.

High-grade glioma (grade IV): (A) 18F-FMISO PET. (B) 18F-FDG PET. (C) MRI. 18F-FDG and 18F-FMISO uptake is evident in left posterior parietal glioma, with uptake absent in central necrotic area, although different patterns of maximal glucose metabolic rate and hypoxia are evident.

High-grade glioma (grade IV): (A) MRI (transaxial, sagittal, and coronal). (B) 18F-FDG PET. (C) 18F-FMISO PET. Cursor shows site of glioma with maximal 18F-FMISO uptake. Patient subsequently underwent external beam RT (XRT). (D) MRI (transaxial, coronal) after relapse of disease, which occurred in left parietal lobe at site of maximal 18F-FMISO uptake before XRT.
Patient Characteristics and Imaging Data
Localization and Pattern of 18F-FDG Uptake in Tumor
18F-FDG uptake was observed in all high-grade gliomas but not in low-grade gliomas (Table 1; Figs. 1–3). 18F-FDG uptake was evident throughout high-grade lesions, except where areas of central necrosis were present. 18F-FDG uptake was not completely restricted to areas of gadolinium enhancement on MRI (Figs. 2 and 3).
Relationship Between 18F-FMISO Uptake and 18F-FDG Uptake
Overall there was correlation between 18F-FMISO and 18F-FDG uptake within individual tumor grades (13/15 patients). Hypometabolic tumors, as indicated by 18F-FDG, showed no 18F-FMISO uptake, although the inverse was true (Table 1). The pattern of 18F-FMISO uptake within a tumor, however, did show differences compared with 18F-FDG, with areas of marked 18F-FMISO uptake often corresponding to areas of only slightly increased 18F-FDG uptake (Figs. 2 and 3).
Tumor Markers of Hypoxia, Proliferation, and Angiogenesis
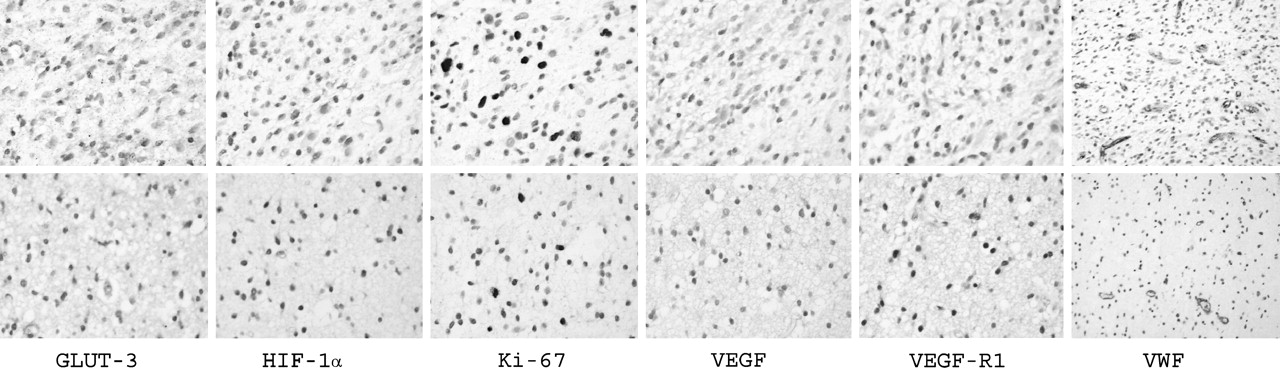
The expression of all of the markers investigated on the 14 evaluable cases is summarized in Table 2. Staining was relatively homogeneous within tumors for all markers studied (Fig. 4). A cytoplasmic staining pattern was observed for GLUT-3, whereas VEGF and VEGF-R1 were expressed predominantly in the cytoplasm with some nuclear staining. Both Ki67 and HIF-1α exhibited nuclear staining.

Immunohistochemistry from 2 representative patients taken at high power (all 400× except VWF, 200×). (Top) High-grade glioma patient (grade IV glioblastoma multiforme; patient 5, Table 1) who demonstrated uptake of 18F-FMISO and 18F on PET studies. (Bottom) Low-grade glioma patient (oligoastrocytoma; patient 11, Table 1) in whom expression is decreased for all tumor markers (except for HIF-1α) on PET studies.
Summary Statistics for Immunohistochemical Markers Compared with Glioma Grade
There was a positive correlation between Ki67 expression and grade of tumor (ρ = 0.85, P = 0.0002). No significant association was found between grade of tumor and any other marker.
HIF-1α protein expression was detected in all patient tumors studied. HIF-1α data were divided into 2 groups using the mean as a basis for the division (Table 3). This allowed for a 2-factor statistical analysis with other markers. Significant differences were found in levels of expression of Ki67, VEGF, VEGF-R1, and MVD between regions where HIF-1α expression was high compared with regions where HIF-1α expression was low. Generally, strong nuclear staining was seen in most of the tumor fields for HIF-1α. This staining pattern was similar to that of Ki67.
HIF-1α Values Compared with Proliferative and Angiogenesis Markers
MVD, as measured by VWF, demonstrated a negative correlation when compared with HIF-1α expression (ρ = −0.69, P = 0.0087). There were no significant differences in levels of expression of GLUT3, Ki67, HIF-1α, VEGF, or VEGF-R1 between regions of high MVD (greater than median VWF expression) and low MVD (less than median VWF expression).
Finally, a positive correlation was found between the markers Ki67 and VEGF-R1 (ρ = 0.61, P = 0.0284) and VEGF and VEGF-R1 (ρ = 0.83, P = 0.0004).
Relationship Between 18F-FMISO or 18F-FDG Uptake and Tumor Markers of Hypoxia
There was a significant relationship between 18F-FMISO or 18F-FDG uptake and expression of VEGF-R1 and Ki67 expression. MVD (as stained by VWF) was constant between tumors with negative or positive 18F-FMISO or 18F-FDG uptake. Other immunohistochemical markers demonstrated a trend toward increased uptake but none was significant. In particular, HIF-1α expression (cells/high-power field) was similar where uptake (mean ± SD) was positive for 18F-FMISO (97 ± 10) or 18F-FDG (97 ± 9) but was not significantly different (P = 0.05) when negative for 18F-FMISO (78 ± 41) or 18F-FDG (78 ± 41).
18F-FMISO uptake was associated with an increase in Ki67 and VEGF-R1 markers in tumor tissue (P ≤ 0.0001 and 0.0014, respectively). 18F-FDG uptake was also associated with an increase in Ki67 and VEGF-R1 markers (P ≤ 0.00001 and 0.0012, respectively). GLUT-3 protein expression was seen across all grades of gliomas. The GLUT-3 expression ranged from 0% to 100% (median, 83%). There was no significant difference between 18F-FDG uptake and GLUT-3 expression (P = 0.0594).
Patient Outcomes
Fourteen patients with histologically proven glioma were monitored (Table 1) until death or, if alive (n = 6), for a median of 68 mo (range, 58–83 mo). Eight patients (57%) died of progressive disease or recurrence with a median time of 16 mo (range, 2−30 mo) until death. For those with recurrent disease (5 patients), the median time to recurrence was 9 mo (range, 3–12 mo).
Of those who died, 7 had positive uptake, 1 was equivocal, and 1 was negative for 18F-FMISO uptake. Of those alive, 18F-FMISO uptake was negative in 5 and equivocal in 1. In 2 patients (patients 1 and 4) with recurrence, 18F-FMISO uptake, not 18F-FDG uptake, was predictive of the site of tumor recurrence.
Multivariate Analysis
The normality of the immunohistochemical data was only slightly improved by the Freeman–Tukey transformation, and the transformed data retained heavier-than-normal, asymmetric tails (not shown). Principal components analysis of the transformed variables showed that 3 principal components were required to explain 93.1% of the variance. MANOVA was performed on the first 3 principal components versus grade and 18F-FMISO uptake separately. No significant differences were found (P = 0.057 and P = 0.27, respectively).
DISCUSSION
Approximately 2% of all cancer deaths in the United States and Australia are due to high-grade gliomas (43,44). However, because of their lethality and the wide age range of patients involved, these tumors become more important when considering person years lost. Such gliomas are resistant to most forms of therapy and—despite major advances in neurosurgery, RT, and chemotherapy—the median survival for patients has had only slight improvement (43). Most recently, the use of concurrent temozolomide chemotherapy with RT can improve 2-y survival from 10% to 25% (45). Investigation of tumor biology has identified hypoxia as a major contributor to therapeutic failure for both chemotherapy and RT (46). Hypoxia-mediated clonal selection of neoplastic cells having persistent genomic changes leads to apoptotic insensitivity and increased angiogenic potential, promoting malignant progression in tumors.
Tumor oxygenation appears to be a new, independent prognostic factor influencing overall survival and local control in a variety of tumors (13,15,19). Polarographic oxygen electrodes are the “gold standard” measurement of tumor oxygenation. However, being invasive measurements, they can be used only at the time of surgery if the organ is not easily accessible. PET studies with radiotracers such as 18F-FMISO are noninvasive tools that may provide the same information and are available to monitor response to treatment. In a recent publication, outcome after RT was predicted on the basis of 18F-FMISO uptake in head and neck and non–small cell lung tumors, with increased uptake correlating with an incomplete response (34).
The results reported in this study define the relationship between routinely used structural and functional imaging findings in glioma with intratumoral hypoxia assessed by 18F-FMISO PET. Previously, a pilot study investigating PET studies only reported on 3 patients having glioma, in which only 2 had modest uptake (37). A further study of 11 patients with relapse or recurrent glioma indicated that 18F-FMISO accumulated in both hypo- and hyperperfused tumor regions, suggesting that hypoxia in glioma may develop independent of tumor perfusion (12). Our study demonstrated that 18F-FMISO uptake correlated with tumor grade, with those of high grade (grade IV) having the greatest uptake, often heterogeneously throughout the tumor. This differs from animal studies at our institution and a recent human glioma study in which 18F-FMISO uptake was observed homogeneously throughout viable glioma tissue (12,47). Importantly, 18F-FMISO PET was predictive of prognosis, and also of subsequent site of recurrence in 2 patients after therapy, which may have implications for the use of hypoxic imaging in the management of patients with glioma.
A significant discrepancy between 18F-FDG and 18F-FMISO uptake has been demonstrated when studying soft-tissue sarcomas, indicating that regional hypoxia and glucose metabolism do not always correlate (18). In our study there were overlapping regions of radiotracer uptake within high-grade gliomas, although they could not be matched precisely (Figs. 2 and 3). This may be explained by a dichotomy between aerobic and anaerobic glycolysis observed in laboratory studies (48). To our knowledge, this is the first demonstration of such a physiologic event in human gliomas. On correlating 18F-FMISO uptake with gadolinium enhancement on MRI, 18F-FMISO was not confined to the areas of enhancement and 18F-FMISO uptake was not determined by blood–brain barrier integrity. Therefore, patterns of hypoxia cannot be predicted by MRI appearance alone.
Immunohistochemistry allowed examination of the relationship between imaging studies and hypoxic markers at a subcellular level. Angiogenesis is recognized as an outcome of hypoxia, where signaling of proliferative markers such as VEGF is upregulated (49). The degree of angiogenesis and vascular remodeling of vessels is one of the histologic parameters used to distinguish low-grade from high-grade astrocytomas (50). MVD is widely used as a marker to measure tumor vascularity by immunohistochemical methods (51); however, it does not distinguish new blood vessels from native ones (52). This may explain why in regions of increased HIF-1α expression MVD was not also increased and why a relationship between tumor grade and vascularity was not established. This finding is further supported when one considers that a relationship between diffusion of 18F-FMISO into hypoxic regions and perfusion was not established in a recent study of human gliomas (12).
Brain HIF-1α is localized in cells around necrosis and tumor cells infiltrating the brain at their margin (53,54). HIF-1α immunoreactivity has demonstrated a positive correlation with MVD and tumor grade (53). HIF-1α was increased in gliomas in this study and, apart from MVD as discussed, was associated with increased expression of other markers of angiogenesis (VEGF, VEGF-R1) and cellular proliferation (Ki-67). One must also be mindful that HIF-1α is a difficult assay to perform and an opportunity for HIF-1α expression in the interval between resection to imbedding remains because cells become anoxic (55). However, delays were minimal in our study and it has been demonstrated that HIF-1α expression is maximally expressed after 5 h (56). This supports the idea that our results are not artifact from postresection changes.
The tumor marker Ki67 recognizes a nuclear antigen expressed in proliferating cells and has demonstrated no overall survival correlation in glioma (57,58). However, in those with grade II tumors, an increased cellular proliferation index was associated with a shorter survival (59). Increasing astrocytic malignancy is associated with an increase in cellular proliferation and apoptotic rate (60). Our study confirms a relationship of Ki67 expression with tumor grade that was not demonstrated with other markers studied.
Histologic markers that characterize glioma progression include necrosis, cellular proliferation, and vascular phenotype. VEGF messenger RNA is expressed in relatively low levels in normal brain, upregulated in low-grade astrocytomas, and highly expressed in glioblastomas (61) Although VEGF is a major factor implicated in angiogenesis (62), evidence for VEGF expression in tumors correlating with hypoxia is conflicting. In a study by Parliament et al., VEGF was ubiquitously expressed throughout xenograft tumors regardless of proximity to capillaries or areas of necrosis. In addition, regions of severe hypoxia in human glioma spheroids and xenograft tumors did not correlate with areas of upregulated VEGF expression (63). In previous studies, patients with low-grade astrocytomas or gliomas that expressed VEGF had a significantly shorter mean overall survival compared with those with VEGF-negative tumors. Also, overexpression of VEGF in low-grade astrocytomas was associated with earlier tumor recurrence in patients. This suggests that it may be possible to use VEGF as a prognostic indicator in patients with astrocytic tumors (64). In our study, VEGF-R1 expression correlated with 18F-FDG and 18F-FMISO uptake on PET, but not expression of VEGF.
As functional imaging techniques are developed to locate the bulk of radiation-resistant subpopulations within treatment volumes, deposition of higher doses may be considered to be radioresistant subvolumes (hypoxic zones) and regions of larger tumor burden while minimizing doses to well-oxygenated areas or where there is a smaller tumor burden. Similarly, the use of chemotherapeutic agents such as tirapazamine that target hypoxic tissues may be chosen in tumors where significant hypoxia is present. Alternatively, several strategies focus on reversing tumor hypoxia, such as using RSR-13 with RT or chemotherapy (65). The identification of hypoxic tissue may therefore have a direct clinical benefit in patients with glioma by modifying treatment and leading to improved patient outcome (66). On the basis of our results, 18F-FMISO PET studies have potential in the management of patients with glioma, and future prospective studies in therapy management have commenced in our center.
CONCLUSION
In light of the present data, conclusions may be drawn on several important aspects of the clinical utility of 18F-FMISO PET. It provides a systematic, noninvasive assessment of oxygenation status of various grades of glioma. Our data also demonstrated the relationship between imaging of specific hypoxia markers with routinely used structural and functional parameters. Finally, 18F-FMISO uptake was prognostic for treatment outcomes in the majority of patients.
This study suggests that hypoxia within gliomas is a negative prognostic factor with regard to response to therapy, malignant progression, and survival. At present, new chemotherapeutic agents are being developed that are nontoxic until they reach a hypoxic cellular environment. Ultimately, imaging hypoxia with techniques such as 18F-FMISO PET may have a role not only in directing patients toward targeted hypoxic therapies but also in monitoring response to such therapies.
Acknowledgments
We gratefully acknowledge the support and assistance of all of the PET Centre Staff, the Anatomical Pathology Laboratory, and Operating Theatre Staff at the Austin Hospital who were involved in the undertaking of this study. This study was supported in part by National Health and Medical Research Program grant 280912.
References
- 1.↵
- 2.
- 3.
- 4.
- 5.
- 6.↵
- 7.↵
- 8.
- 9.
- 10.↵
- 11.↵
- 12.↵
- 13.↵
- 14.↵
- 15.↵
- 16.↵
- 17.↵
- 18.↵
- 19.↵
- 20.↵
- 21.↵
- 22.↵
- 23.
- 24.↵
- 25.↵
- 26.↵
- 27.↵
- 28.↵
- 29.↵
- 30.↵
- 31.↵
- 32.↵
- 33.↵
- 34.↵
- 35.↵
- 36.↵
- 37.↵
- 38.↵
- 39.↵
- 40.↵
- 41.↵
- 42.↵
- 43.↵
- 44.↵
- 45.↵
- 46.↵
- 47.↵
- 48.↵
- 49.↵
- 50.↵
- 51.↵
- 52.↵
- 53.↵
- 54.↵
- 55.↵
- 56.↵
- 57.↵
- 58.↵
- 59.↵
- 60.↵
- 61.↵
- 62.↵
- 63.↵
- 64.↵
- 65.↵
- 66.↵
- Received for publication July 4, 2005.
- Accepted for publication November 15, 2005.


Jump to section
Related Articles
Cited By...
- GOT1 primes the cellular response to hypoxia by supporting glycolysis and HIF1{alpha} stabilisation
- In Vivo Relationship Between Hypoxia and Angiogenesis in Human Glioblastoma: A Multimodal Imaging Study
- Hypoxic Viable Tissue in Human Chronic Cerebral Ischemia Because of Unilateral Major Cerebral Artery Steno-Occlusive Disease
- 62Cu-Diacetyl-Bis (N4-Methylthiosemicarbazone) PET in Human Gliomas: Comparative Study with [18F]Fluorodeoxyglucose and L-Methyl-[11C]Methionine PET
- Specific biomarkers of receptors, pathways of inhibition and targeted therapies: clinical applications
- Imaging hypoxia in gliomas
- Multimodality Assessment of Brain Tumors and Tumor Recurrence
- 18F-Fluromisonidazole PET Imaging as a Biomarker for the Response to 5,6-Dimethylxanthenone-4-Acetic Acid in Colorectal Xenograft Tumors
- [18F]FDG PET/CT imaging of colorectal cancer: a pictorial review
- Quantitative Metrics of Net Proliferation and Invasion Link Biological Aggressiveness Assessed by MRI with Hypoxia Assessed by FMISO-PET in Newly Diagnosed Glioblastomas
- Fibronectin Stimulates Endothelial Cell 18F-FDG Uptake Through Focal Adhesion Kinase-Mediated Phosphatidylinositol 3-Kinase/Akt Signaling
- Molecular Imaging of Hypoxia
- Causes and Consequences of Increased Glucose Metabolism of Cancers
- Regional Hypoxia in Glioblastoma Multiforme Quantified with [18F]Fluoromisonidazole Positron Emission Tomography before Radiotherapy: Correlation with Time to Progression and Survival
- Clinical Applications of PET in Brain Tumors
- Lack of Correlation of Hypoxic Cell Fraction and Angiogenesis with Glucose Metabolic Rate in Non-Small Cell Lung Cancer Assessed by 18F-Fluoromisonidazole and 18F-FDG PET