


Abstract
Alterations of serotonin transporters (SERT) are implicated in a large number of psychiatric conditions. 11C-(+)-6β-(4-Methylthiophenyl)-1,2,3,5,6α,10β-hexahydropyrrolo[2,1-a]isoquinoline (11C-McN 5652) was the first PET radiotracer successfully developed as a SERT imaging agent. Recently, 11C-3-amino-4-(2-dimethylaminomethylphenylthio)benzonitrile (11C-DASB) was introduced as an alternative to 11C-McN 5652. Comparative evaluation of 11C-DASB and 11C-McN 5652 in baboons indicates that 11C-DASB is associated with (a) lower nonspecific binding in the brain, (b) higher plasma free fraction, and (c) faster plasma clearance and brain uptake kinetics, enabling measurement of SERT parameters in a shorter scanning time. The purpose of this study was to compare these 2 agents in healthy humans. Methods: Six healthy volunteers underwent 2 PET scans on the same day, one with 11C-DASB and one with 11C-McN 5652, in counterbalanced order. Regional distribution volumes (VT) were derived for 16 brain regions by kinetic analysis using the arterial input function. Results: Both 11C-DASB and 11C-McN 5652 displayed similar patterns of accumulation: highest levels in the midbrain, thalamus and striatum; intermediate in the limbic regions; low in the neocortex; and lowest in the cerebellum. 11C-DASB cerebellar VT (10.1 ± 2.0 mL g−1) was lower than that of 11C-McN 5652 (20.8 ± 3.6 mL g−1), indicating lower nonspecific binding. As a result, regional specific-to-nonspecific equilibrium partition coefficients (V3″) of 11C-DASB were higher compared with those of 11C-McN 5652 (for example, midbrain V3″ of 11C-DASB and 11C-McN 5652 were 2.04 ± 0.44 and 1.20 ± 0.34, respectively). The plasma free fraction was 8.9% ± 1.6% for 11C-DASB and was not measurable for 11C-McN 5652. In contrast to the situation observed in baboons, plasma clearances of both compounds were similar in humans, and the minimal scanning times required to derive time-invariant distribution volumes in all regions were comparable for both tracers (95 min). Conclusion: With the exception of the scanning time, predictions from baboon studies were confirmed in humans. The higher specific-to-nonspecific ratios of 11C-DASB are a critical advantage. This property will be especially important for the measurement of SERT in regions with moderate density, such as the limbic regions, where alterations of serotonin transmission might be associated with anxiety and depression.
- serotonin transporter
- 11C-3-amino-4-(2-dimethylaminomethylphenylthio)benzonitrile
- 11C-(+)-6β-(4-methylthiophenyl)-1,2,3,5,6α,10β-hexahydropyrrolo[2,1-a]isoquinoline
- PET
Alterations of serotonin (5-HT) transmission play a role in a variety of psychiatric conditions including major depression, obsessive compulsive, and other anxiety disorders as well as schizophrenia. The importance of the 5-HT transporter (SERT) in regulating 5-HT function, along with the fact that this receptor is the site of action of most antidepressant medications, has led to significant interest in developing PET radiotracers for this target. In the human brain, SERT is present in high density in the midbrain area, the thalamus, and the striatum; moderate density in the limbic regions such as amygdala, hippocampus, and cingulate cortex; and low density in the neocortical regions (1–3).
11C-(+)-6β-(4-Methylthiophenyl)-1,2,3,5,6α,10β-hexahydropyrrolo[2,1-a]isoquinoline (11C-McN 5652) was the first PET radiotracer successfully developed to image SERT density in humans (4–8). This radiotracer has been used in several clinical studies, including studies of patients with mood disorders (9), obsessive compulsive disorder (10), and ecstasy abuse (11,12). However, 11C-McN 5652 is not without some limitations (7). First, its nonspecific binding is relatively high, thus precluding the reliable quantification of SERT in regions of moderate-to-low SERT density. Second, the plasma free fraction is too low to be measured with accuracy using traditional ultracentrifugation methods, making it difficult to control for this variable in clinical studies. Finally, the brain uptake of this radiotracer is protracted, so that long imaging sessions are required to derive accurate SERT binding parameters.
More recently, Wilson and coworkers introduced 11C-3-amino-4-(2-dimethylaminomethylphenylthio)benzonitrile (11C-DASB) as a new PET radiotracer suitable to image SERT (13–17). Two studies compared the imaging qualities of 11C-McN 5652 and 11C-DASB in baboons and concluded that 11C-DASB provided significant improvement over 11C-McN 5652, for it has higher specific-to-nonspecific binding ratios, higher plasma free fraction, and faster uptake kinetics (18,19).
The aim of this study was to compare 11C-DASB and 11C-McN 5652 as imaging agents for the SERT in healthy humans. This characterization was performed in the same subjects, under standardized conditions, to facilitate an unbiased comparison. Six individuals were studied twice on the same day, once with each radiotracer, administered in a counterbalanced order. The main purpose of this study was to evaluate if the improved properties of 11C-DASB relative to 11C-McN 5652 observed in baboons were confirmed in healthy human subjects.
MATERIALS AND METHODS
Human Subjects
The study was approved by the Institutional Review Boards of the New York State Psychiatric Institute and Columbia Presbyterian Medical Center. Six healthy volunteers participated in this study (4 males, 2 females; age, 27 ± 6 y; range, 18–34 y; these and subsequent values are given as mean ± SD). The absence of pregnancy, medical, neurologic, and psychiatric history (including alcohol and drug abuse) was assessed by history, review of systems, physical examination, and routine blood tests, including pregnancy test, urine toxicology, and electrocardiogram. Subjects provided written informed consent after receiving an explanation of the study.
Radiochemistry
11C-DASB.
The standard DASB and precursor desmethyl DASB were a gift from the University of Toronto. Preparation of 11C-DASB followed the literature procedure, with some modifications (13).
Desmethyl DASB was dissolved in 0.3 mL of N,N-dimethylformamide (DMF) and the solution was cooled to −20°C to −10°C. 11C-Methyl iodide, produced according to the literature procedure (20), was bubbled into the cooled precursor solution. When maximum radioactivity was collected in the reaction vial, the bubbling line was removed from the vial. The reaction mixture was then heated at 80°C for 5 min, mixed with 0.4 mL of H2O, and injected onto a semipreparative high-pressure liquid chromatography (HPLC) column (Prodigy ODS-prep, 10 μm, 250 × 10 mm; Phenomenex; mobile phase, 40% MeCN/60% 0.1 mol/L NH4CH3CO2; flow rate, 10 mL/min; retention time for 11C-DASB, 12 min).
The HPLC fraction containing 11C-DASB was diluted with 100 mL of H2O and passed through a C18 SepPak column (Waters Corp.), preconditioned by washing with 5 mL of EtOH followed by 5 mL of H2O. The SepPak column was rinsed with 10 mL of H2O and the product was eluted off with 1 mL of EtOH. A small sample of the EtOH solution (10–30 mL) was injected onto an analytic HPLC column (Prodigy ODS-3, 5 μm, 250 × 4.6 mm; Phenomenex; mobile phase, 35% MeCN/65% 0.1 mol/L NH4HCO2 solution; flow rate, 2 mL/min; retention time for 11C-DASB, 7.8 min) to determine the radiochemical purity, chemical purity, and specific activity of the product. The remaining EtOH solution was then diluted with 9 mL of saline, filtered through a membrane filter (Millex GV, 0.22 μm, 25 mm; Millipore Corp.), and collected in a sterile vial.
The chemical purity of 11C-DASB was >99%. The radiochemical purity was >90%.
11C-McN 5652.
The standard (+)-McN 5652 was a gift from R.W. Johnson Pharmaceutical Research Institute. The precursor for the production of 11C-(+)-McN 5652, (+)-McN butyryl thioester tartrate, was prepared from (+)-McN 5652 by a modified literature procedure (21).
Briefly, (+)-McN 5652 in anhydrous tetrahydrofuran was reacted with sodium and liquid ammonia at −78°C for 20 min to provide the thiophenol, which was converted to the butyryl thioester by reaction with butyryl chloride at room temperature for 5 min. The crude reaction product was purified by column chromatography on silica gel. The resulting thioester was stabilized and further purified by treatment with tartaric acid to provide the stable (+)-McN butyryl thioester tartrate, which was >96% chemically and >98% optically pure, as indicated by reverse-phase and chiral HPLC analyses using the published analytic procedures (22).
To a reaction vial containing 0.5 mg of the precursor (+)-McN butyryl thioester tartrate was added 0.3 mL of DMF and 10 μL of tetrabutylammonium hydroxide (1.0 mol/L solution in MeOH). 11C-Methyl iodide was bubbled into the precursor solution at room temperature. When maximum radioactivity was collected in the reaction vial, the reaction mixture was heated at 60°C for 2 min. Purification and processing procedures of 11C-(+)-McN 5652 were the same as those for 11C-DASB (Semipreparative HPLC column: Prodigy C18 ODS-prep, 10 μm, 250 × 10 mm; mobile phase, 30% MeCN/70% 0.1 mol/L NH4HCO2 solution; flow rate, 15 mL/min; retention time of 11C-(+)-McN 5652, 16 min. Analytic HPLC column: Prodigy C18 ODS-3, 5 μm, 250 × 4.6 mm; mobile phase, 40% MeCN/60% 0.1 mol/L NH4HCO2 solution; flow rate, 2 mL/min; retention time of 11C-(+)-McN 5652, 8.5 min).
The radiochemical and chemical purity of 11C-(+)-McN 5652 in saline was >95%.
PET Protocol
All subjects were studied with 11C-DASB and 11C-McN 5652 on the same day. The injection order was counterbalanced. Three subjects were scanned with 11C-DASB first, and 3 subjects were scanned with 11C-McN 5652 first. An arterial catheter was inserted in the radial artery after completion of the Allen test and infiltration of the skin with 1% lidocaine. A venous catheter was inserted in a forearm vein on the opposite side. Head movement minimization was achieved with a polyurethane head immobilization system (Soule Medical, FA) (23). PET imaging was performed with the ECAT EXACT HR+ (Siemens/CTI) (63 slices covering an axial field of view [FOV] of 15.5 cm, axial sampling of 3.46 mm, 3-dimensional [3D] mode in plane and axial resolution of 4.4 and 4.1 mm full width at half maximum at the center of the FOV, respectively). A 10-min transmission scan was obtained before radiotracer injection. Radiotracers were injected intravenously over 30 s. Emission data were collected in the 3D mode for 120 min as 21 successive frames of increasing duration (3 × 20 s, 3 × 1 min, 3 × 2 min, 2 × 5 min, 10 × 10 min). Subjects were allowed to rest outside of the camera for 30–45 min between the 2 injections.
Input Function Measurement
After radiotracer injection, arterial samples were collected every 10 s with an automated sampling system for the first 2 min and collected manually thereafter at longer intervals. A total of 32 samples were obtained per scan. After centrifugation (10 min at 1,800g), plasma was collected in 200-μL aliquots and activities were counted in a γ-counter (Wallac 1480 Wizard 3M Automatic γ-Counter).
Seven samples (collected at 2, 16, 30, 50, 70, 90, and 120 min) were further processed by HPLC to measure the fraction of plasma activity representing unmetabolized parent compound. For 11C-DASB, plasma samples (0.5 mL) were added to 1.0 mL of MeOH in a centrifuge tube. After mixing, the samples were centrifuged at 15,000 rpm for 3.5 min. The liquid phase was separated from the precipitate. Activity in 0.1 mL of the liquid phase was counted and the remainder was injected onto the HPLC column. For 11C-McN 5652, 1-mL aliquots of plasma were loaded onto a C18 SepPak column (Waters classic; Waters) preconditioned with 5 mL of MeOH and 10 mL of water. The SepPak was flushed with air, washed with 5 mL of water, and eluted with 1 mL of MeOH.
The HPLC system consisted of a Waters 510 isocratic pump, a Rheodyne injector with a 2-mL sample loop, a Phenomenex C18 ODS column (10-μm particle size, 250 × 4.6 mm), and a γ-detection system (Bioscan Flow Count Unit). The column was eluted with a solvent mixture of acetonitrile/0.1 mol/L aqueous ammonium formate (30:70) at a flow rate of 2.5 mL/min. The HPLC eluate was collected in either 5 (for 11C-McN 5652) or 7 (for 11C-DASB) counting tubes (4.0 mL each). A standard was processed with each sample to determine the retention time of the unmetabolized compound. For each sample, the unmetabolized fraction was estimated by the ratio of activity, decay corrected, in the parent peak to the total activity. A biexponential function was fitted to the 7 measured unmetabolized fractions that was then used to interpolate values between the measurements. The smallest exponential of the unmetabolized fraction curve, λpar, was constrained to the difference between λcer, the terminal rate of washout of cerebellar activity, and λtot, the smallest elimination rate constant of the total plasma activity (24).
The input function was calculated as the product of total counts and interpolated unmetabolized fraction at each time point. The measured input function values (Ca(t), MBq/mL) were fitted to a sum of 3 exponentials from the time of peak plasma activity, and the fitted values were used as the input to the kinetic analysis. The initial distribution volume (Vbol, L) was calculated as the ratio of injected dose to peak plasma parent concentration. The clearance of the parent compound (CL, l/h) was calculated as the ratio of the injected dose to the area under the curve of the input function (25).
For the determination of the plasma free fraction (f1), triplicate 200-μL aliquots of plasma collected before injection were mixed with the radiotracer, pipetted into ultrafiltration units (Amicon Centrifree; Millipore), and centrifuged at room temperature (20 min at 4,000 rpm). At end of centrifugation, the plasma and ultrafiltrate activities were counted, and f1 was calculated as the ratio of activity in the ultrafiltrate to total activity (26). Triplicate aliquots of saline solution mixed with the radiotracer were also processed to determine the filter retention of the free tracer. Plasma f1 was determined only for 11C-DASB, as the high retention (>90%) of free 11C-McN 5652 on the filter impairs the free fraction measurement of 11C-McN 5652 with this method (7).
MRI Acquisition and Segmentation Procedures
MR images were acquired on a General Electric 1.5-T Signa Advantage system. After a sagittal scout (localizer) image, performed to identify the anterior commissure-posterior commissure (AC-PC) plane (1 min), a transaxial T1-weighted sequence with 1.5-mm slice thickness was acquired in a coronal plane orthogonal to the AC-PC plane over the whole brain with the following parameters: 3D spoiled gradient recalled acquisition in the steady state; repetition time, 34 ms; echo time, 5 ms; flip angle, 45°; slice thickness, 1.5 mm and zero gap; 124 slices; FOV, 22 × 16 cm; with 256 × 192 matrix, reformatted to 256 × 256, yielding a voxel size of 1.5 × 0.9 × 0.9 mm; and time of acquisition, 11 min.
MRI segmentation was performed within MEDx (Sensor Systems, Inc.), with original subroutines implemented in MATLAB (The Math Works, Inc.). Steps for MRI segmentation included correction for field inhomogeneities, fitting of the intensity distribution to a sum of 3 gaussian functions, voxel classification, and postfiltering (27).
Image Analysis
Images were reconstructed to a 128 × 128 matrix (pixel size of 2.5 × 2.5 mm2). Reconstruction was performed with attenuation correction using the transmission data and a Shepp 0.5 filter (cutoff, 0.5 cycle per projection ray). Reconstructed image files were then processed with the image analysis software MEDx. If indicated by visual inspection, frames were realigned to a frame of reference, using a least-squares algorithm for within-modality coregistration (automated image registration [AIR]) (28). The results of the frame-to-frame realignment were checked again visually. After frame-to-frame registration, the 21 frames were summed to one dataset, which was coregistered to the MRI dataset using AIR (28). The spatial transformation derived from the summed PET registration procedure was then applied to each individual frame. Thus, each PET frame was resampled in the coronal plane to a voxel volume of 1.5 × 0.9 × 0.9 mm3.
Regions of interest ([ROIs], n = 16) and region of reference (cerebellum) boundaries were drawn on the MR image according to criteria derived from brain atlases (29,30) and published reports (31–34). A segmentation-based method was used for the neocortical regions, and a direct identification method was used for the subcortical regions.
For the neocortical regions, large regions were first drawn to delineate the boundaries of the ROIs. Within these regions, only the voxels classified as gray matter were used to measure the activity distribution. Sampled volumes of the neocortical regions (n = 7) were as follows: dorsolateral prefrontal cortex (DLPFC, 26,027 ± 3,244 mL3), medial prefrontal cortex (MPFC, 6,417 ± 1,206 mL3), orbitofrontal cortex (OFC, 14,472 ± 2,341 mL3), anterior cingulate cortex (ACC, 3,455 ± 1,160 mL3), parietal cortex (PC, 56,728 ± 3,408 mL3), temporal cortex (TC, 50,013 ± 3,785 mL3), and occipital cortex (OC, 36,056 ± 6,386 mL3).
Because of the mixture of gray and white matter in the central gray structures (especially in the thalamus), the segmentation-based approach was not used to define the subcortical ROIs, and the boundaries of these regions were identified by anatomic criteria. The subcortical regions (n = 10) included caudate (CAU, 7,412 ± 1,423 mL3), putamen (PUT, 9,910 ± 1,858 mL3), ventral striatum (VST, 2,653 ± 823 mL3), thalamus (THA, 9,228 ± 1,896 mL3), midbrain (MID, 7,513 ± 1,582 mL3), amygdala (AMY, 4,936 ± 718 mL3), entorhinal cortex (ENT, 2,421 ± 564 mL3), parahippocampal gyrus (PAR, 8,660 ± 1,026 mL3), hippocampus (HIP, 8,514 ± 632 mL3), and cerebellum (CER, 35,062 ± 12,450 mL3).
For bilateral regions, right and left values were averaged. The contribution of plasma total activity to the regional activity was calculated assuming a 5% blood volume in the ROIs (35), and tissue activities were calculated as the total regional activities minus the plasma contribution.
Derivation of Distribution Volumes
Derivation of 11C-DASB and 11C-McN 5652 regional tissue distribution volumes (VT, mL g−1) was performed with kinetic modeling using the arterial input function and a 2-compartment model (i.e., 1-tissue-compartment model [1TC model]). This model has been demonstrated to provide reliable estimates of VT for both 11C-DASB (17) and 11C-McN 5652 (7). VT, which is equal to the ratio of tissue to plasma parent activity at equilibrium, was derived as the K1/k2 ratio, where K1 (mL g−1 min−1) and k2 (min−1) are the unidirectional fractional rate constants for the transfer of the tracer in and out of the brain, respectively (36,37). Kinetic parameters were derived by nonlinear regression using a Levenberg–Marquart least-squares minimization procedure (38) implemented in MATLAB (The Math Works, Inc.), as previously described (36). Given the unequal sampling over time (increasing frame acquisition time from the beginning to the end of the study), the least-squares minimization procedure was weighted by the frame acquisition time.
The minimal scanning time required to achieve time-independent derivation of regional VT was evaluated by fitting the time–activity curves to shorter datasets, representing a total scanning time of 110, 100, 90, 80, 70, 60, 50, 40, and 30 min, respectively. The resulting estimates of VT were normalized to the VT derived with the 120-min dataset. The average and SD of the normalized VT were calculated for each scan duration. Time independence was considered achieved at time t if, for the frame ending at time t and all subsequent frames, the following 2 criteria were fulfilled: (a) the average normalized VT was between 95% and 105% of the reference VT (small bias); and (b) the SD of the normalized VT was <10% (small error). These criteria were similar to the ones previously used in baboons (18).
Derivation of SERT Parameters
Derivation of SERT parameters was based on the following assumptions: (a) because of the negligible density of SERT in the cerebellum (1–3), cerebellum VT was assumed to be representative of equilibrium nonspecific binding; and (b) the nonspecific binding did not vary significantly between regions.
The binding potential ([BP], mL g−1) was derived as the difference between VT in the ROI (VT ROI) and VT in the cerebellum (VT CER), the reference region. The relationship between BP and SERT receptor parameters was given by (39):
 where Bmax is the regional concentration of SERT (nmol/L), and Kd is the in vivo affinity of the tracer for SERT (nmol/L).
The specific-to-nonspecific equilibrium partition coefficient (V3″) was derived as the ratio of BP to VT CER. The relationship between V3″ and SERT receptor parameters is given by (39):
 where f2 is the free fraction of the nonspecific distribution volume in the brain (f2 = f1/VT CER). V3″ provides a measure of the signal-to-noise contrast associated with the detection of specific binding. In contrast to simple tissue activity ratios, V3″ is independent of the time of measurement.
Statistical Analysis
Dependent variables were analyzed using repeated-measures ANOVA (RM ANOVA), with tracer as repeated condition and, when appropriate, regions as cofactors. A 2-tailed probability value of 0.05 was selected as the significance level. This design gives differences due to the radiotracer, after taking into account individual differences. Thus, using this analysis, we determined the significance level of between-tracer differences.
RESULTS
Injected Dose
The injected dose did not differ between 11C-DASB and 11C-McN 5652 (547.6 ± 122.1 MBq vs. 410.7 ± 140.6 MBq, respectively; RM ANOVA, P = 0.09). The injected mass also did not differ between 11C-DASB and 11C-McN 5652 (4.5 ± 1.3 μg vs. 5.2 ± 0.3 μg, respectively; RM ANOVA, P = 0.25). The specific activity of 11C-DASB (3,544 ± 873 GBq/mmol) was significantly higher than that of 11C-McN 5652 (2,298 ± 696 GBq/mmol; RM ANOVA, P = 0.02).
Plasma Analysis
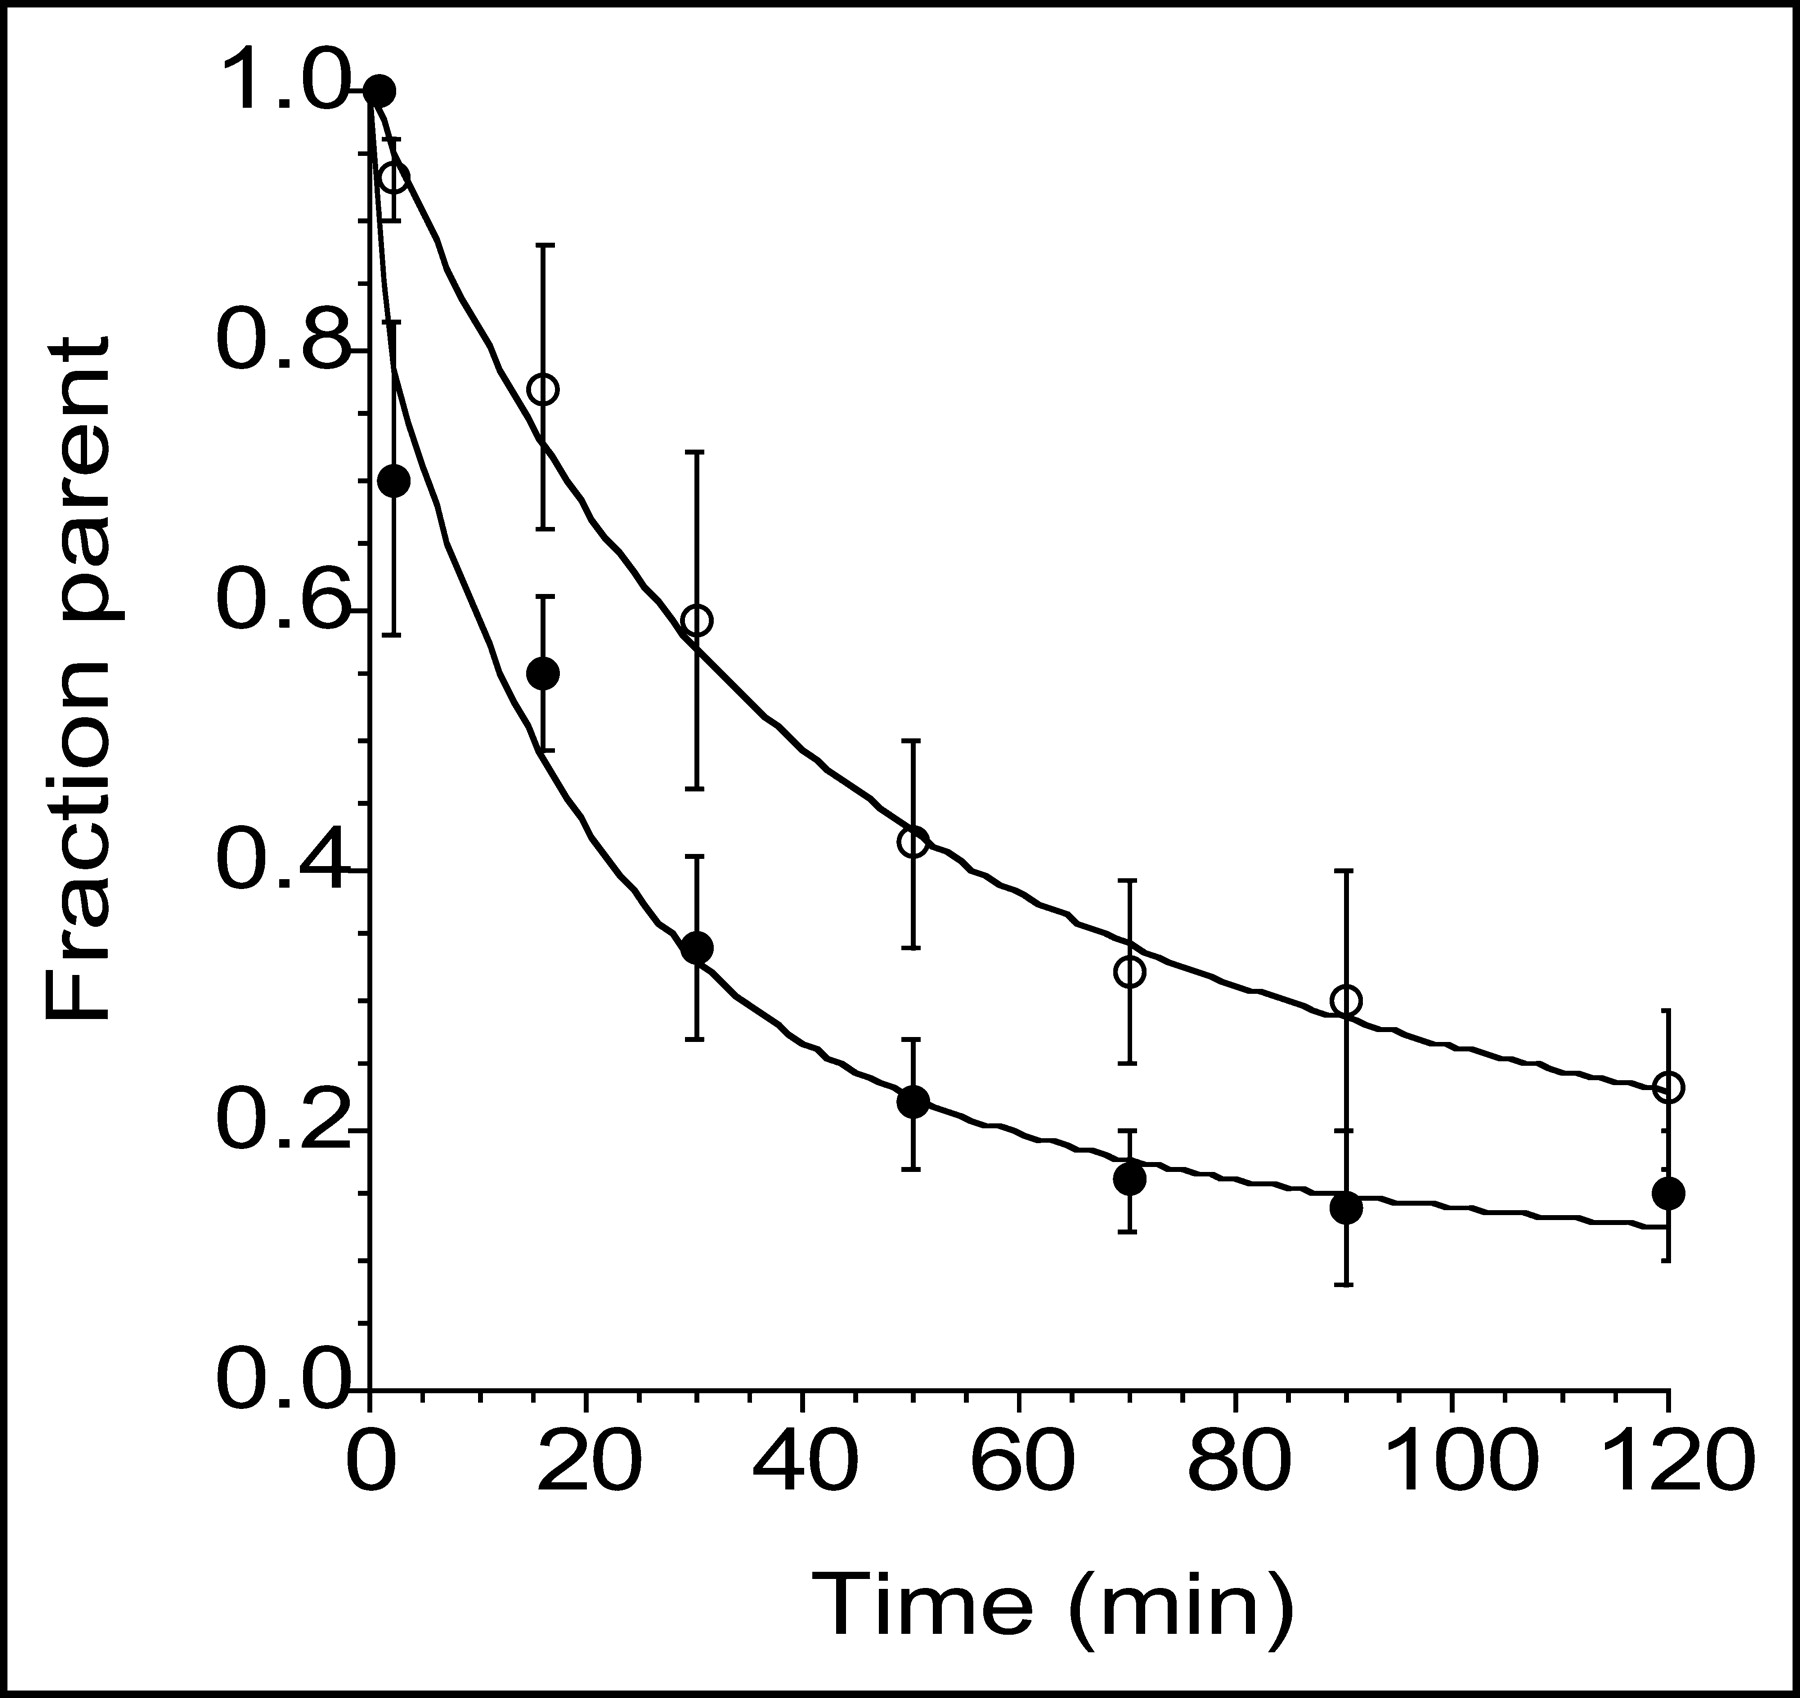
After an initial, rapid distribution phase, plasma activity stabilized at relatively constant levels for both tracers. During this plateau phase, total plasma activity was higher after 11C-DASB injection (Fig. 1). Both radiotracers underwent significant metabolism over the duration of the study (Fig. 2). A significant difference in the rate of metabolism was seen between tracers, with 11C-DASB showing faster metabolism than 11C-McN 5652 (RM ANOVA, P = 0.0008). The initial peak of parent compound was higher for 11C-McN 5652 than for 11C-DASB (Fig. 3, inset). Thus, the initial distribution volume (Vbol) of 11C-DASB (46 ± 9 L) was significantly higher than that of 11C-McN 5652 (16 ± 4 L; RM ANOVA, P = 0.008). After the initial distribution phase, 11C-McN 5652 parent concentration became lower than that of 11C-DASB parent concentration. No significant difference in the parent plasma clearance rate was observed between 11C-DASB (159 ± 34 L h−1) and 11C-McN 5652 (170 ± 53 L h−1; RM ANOVA, P = 0.64) nor was a significant difference observed in the terminal half-life (11C-DASB, 69 ± 42 min; 11C-McN 5652, 88 ± 55 min; RM ANOVA, P = 0.49). The free fraction of 11C-DASB dissolved in saline was 95% ± 4%, indicating negligible retention on the ultracentrifugation filter. The free fraction of 11C-DASB in the plasma was 8.9% ± 1.6%.
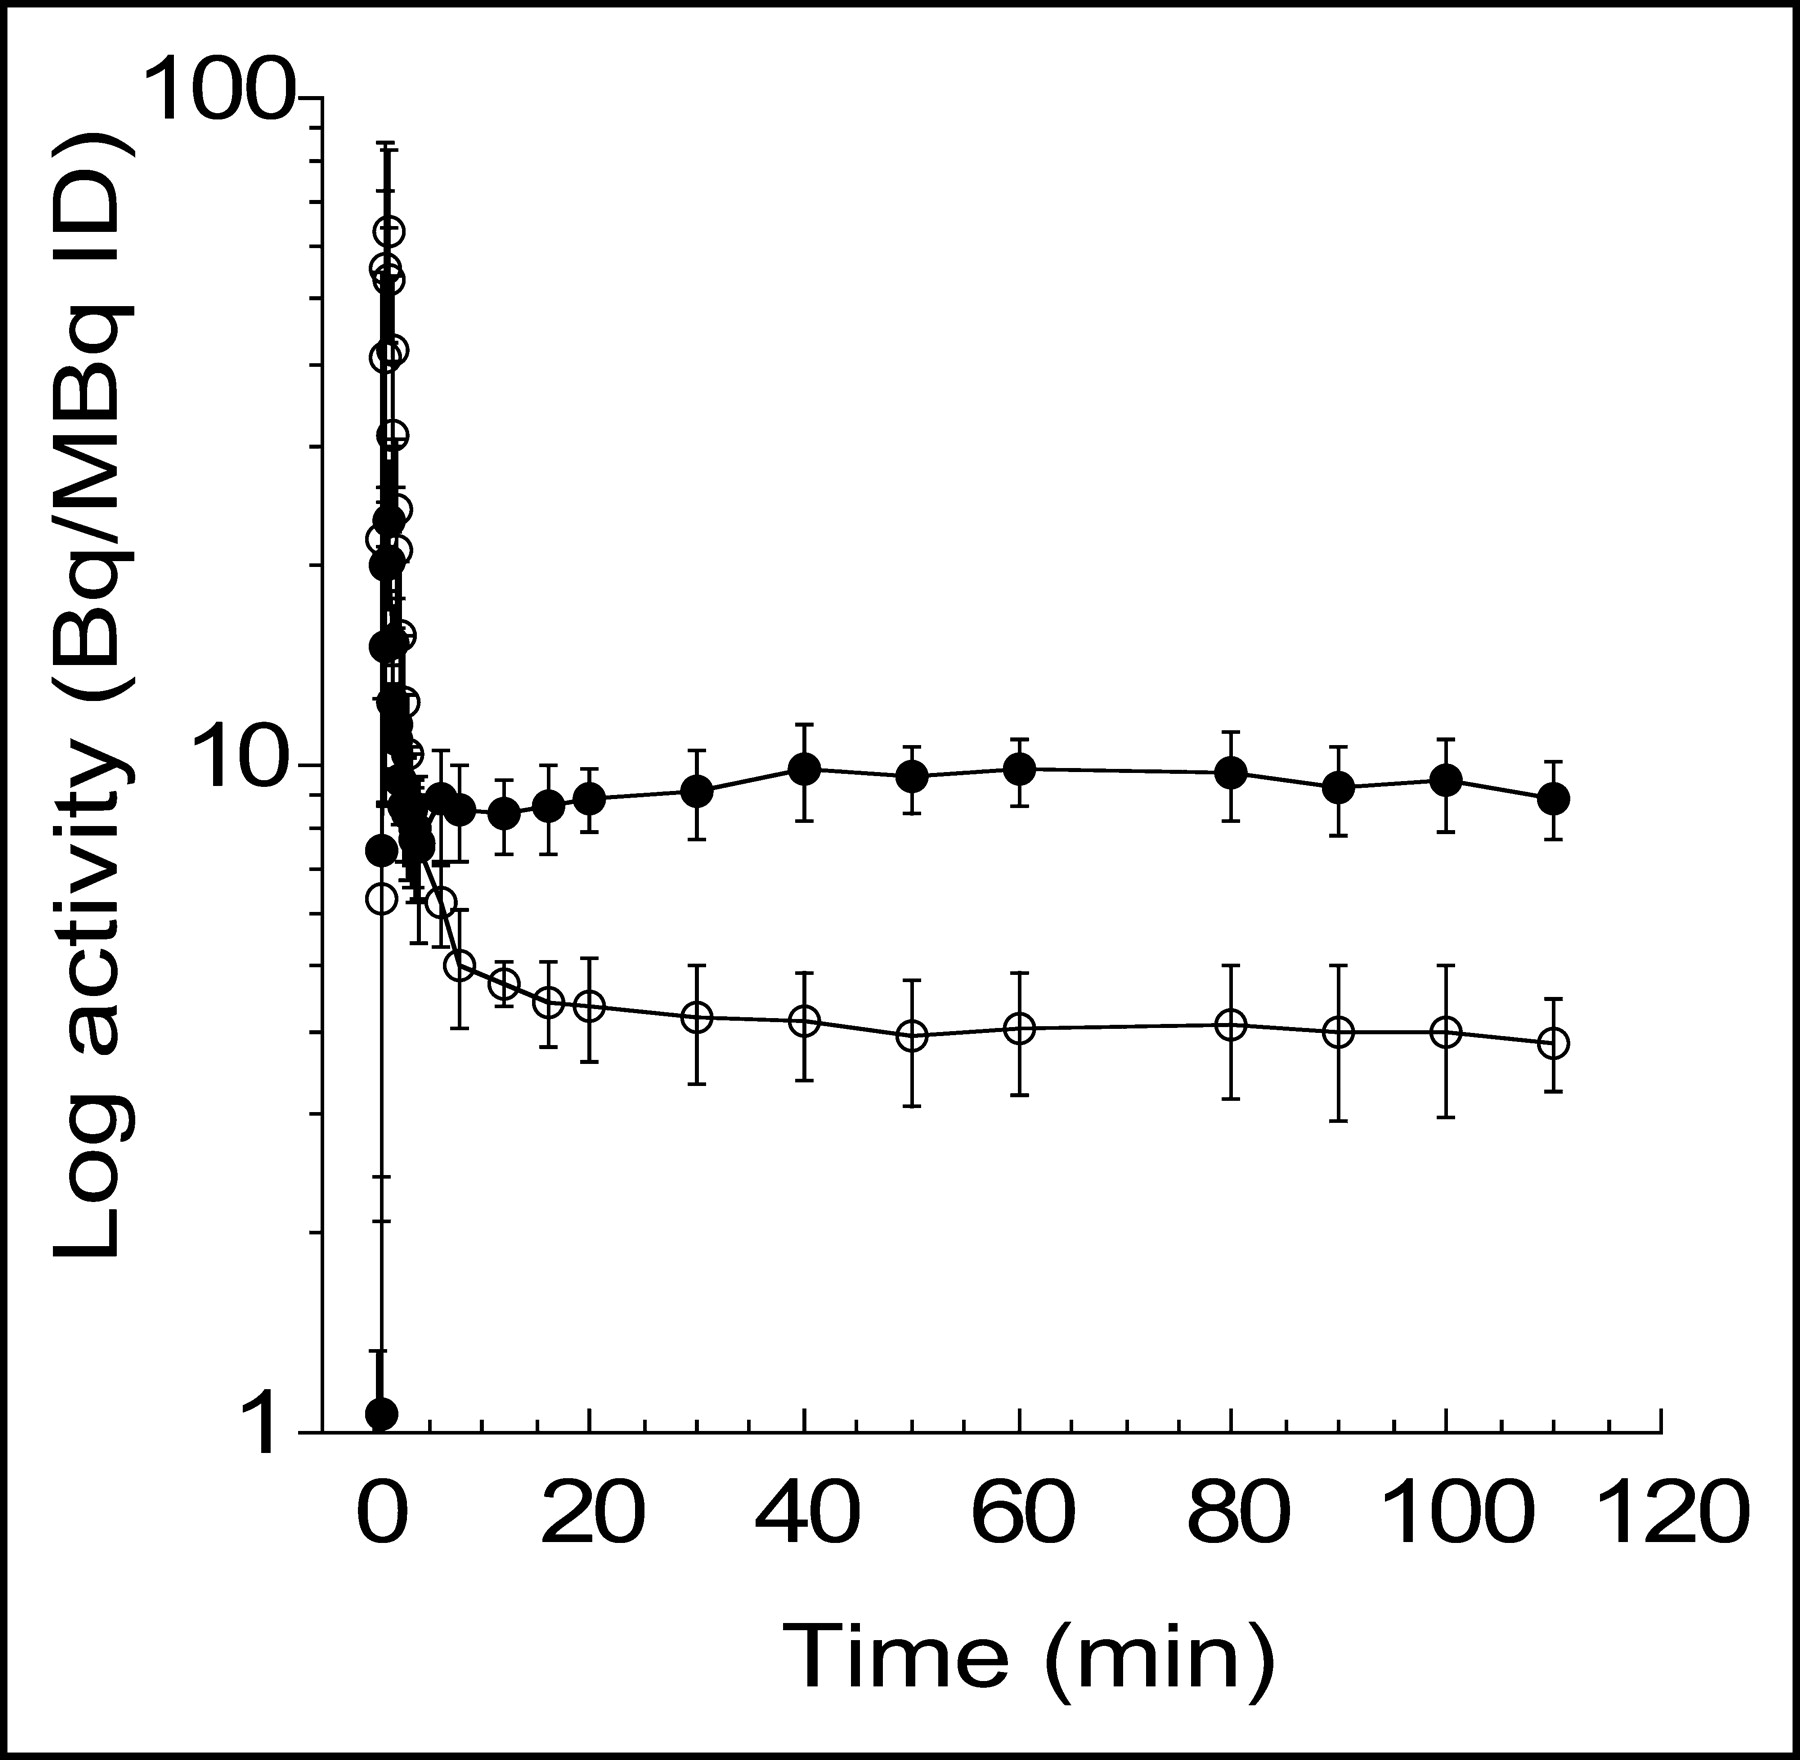
Mean ± SD of total plasma activity normalized to injected dose (ID) after injection of 11C-DASB (•) and 11C-McN 5652 (○). Each point is mean of 6 experiments. After rapid distribution, plasma activity stabilized to relatively constant level for both tracers. During plateau phase, higher activity was observed for 11C-DASB than for 11C-McN 5652.

Mean ± SD of fraction of plasma activity corresponding to parent compound after injection of 11C-DASB (•) and 11C-McN 5652 (○). Values are mean of 6 experiments. Fraction parent of 11C-DASB exhibited significantly faster reduction than that of 11C-McN 5652 (P = 0.001).

Mean plasma activity corresponding to parent compound after injection of 11C-DASB (•) and 11C-McN 5652 (○). Each point is mean of 6 experiments. Initial peak concentration of 11C-McN 5652 was higher than that of 11C-DASB (inset), which may represent greater binding to peripheral receptors for 11C-DASB. After 3 min, concentration of 11C-McN 5652 became lower than that of 11C-DASB. ID = injected dose.
Brain Analysis
Regional Uptake.
The activity of both tracers displayed similar patterns of accumulation (Fig. 4). Activity concentrated in regions with high SERT densities (midbrain, thalamus, and striatum). Intermediate levels of activity were seen in the amygdala, hippocampus, cingulate, and parahippocampal gyrus. Lower levels were observed in the neocortex and cerebellum. Radiotracer accumulation in the central SERT-rich regions was readily noticeable with both tracers. The 11C-DASB image provided improved contrast and finer details. For example, the higher accumulation in the dorsal raphe compared with the other regions of the midbrain is visually appreciable on the 11C-DASB scan but not on the 11C-McN 5652 scan (Fig. 4, bottom row). The amygdalae are also visible on the 11C-DASB image but not on the 11C-McN 5652 image.
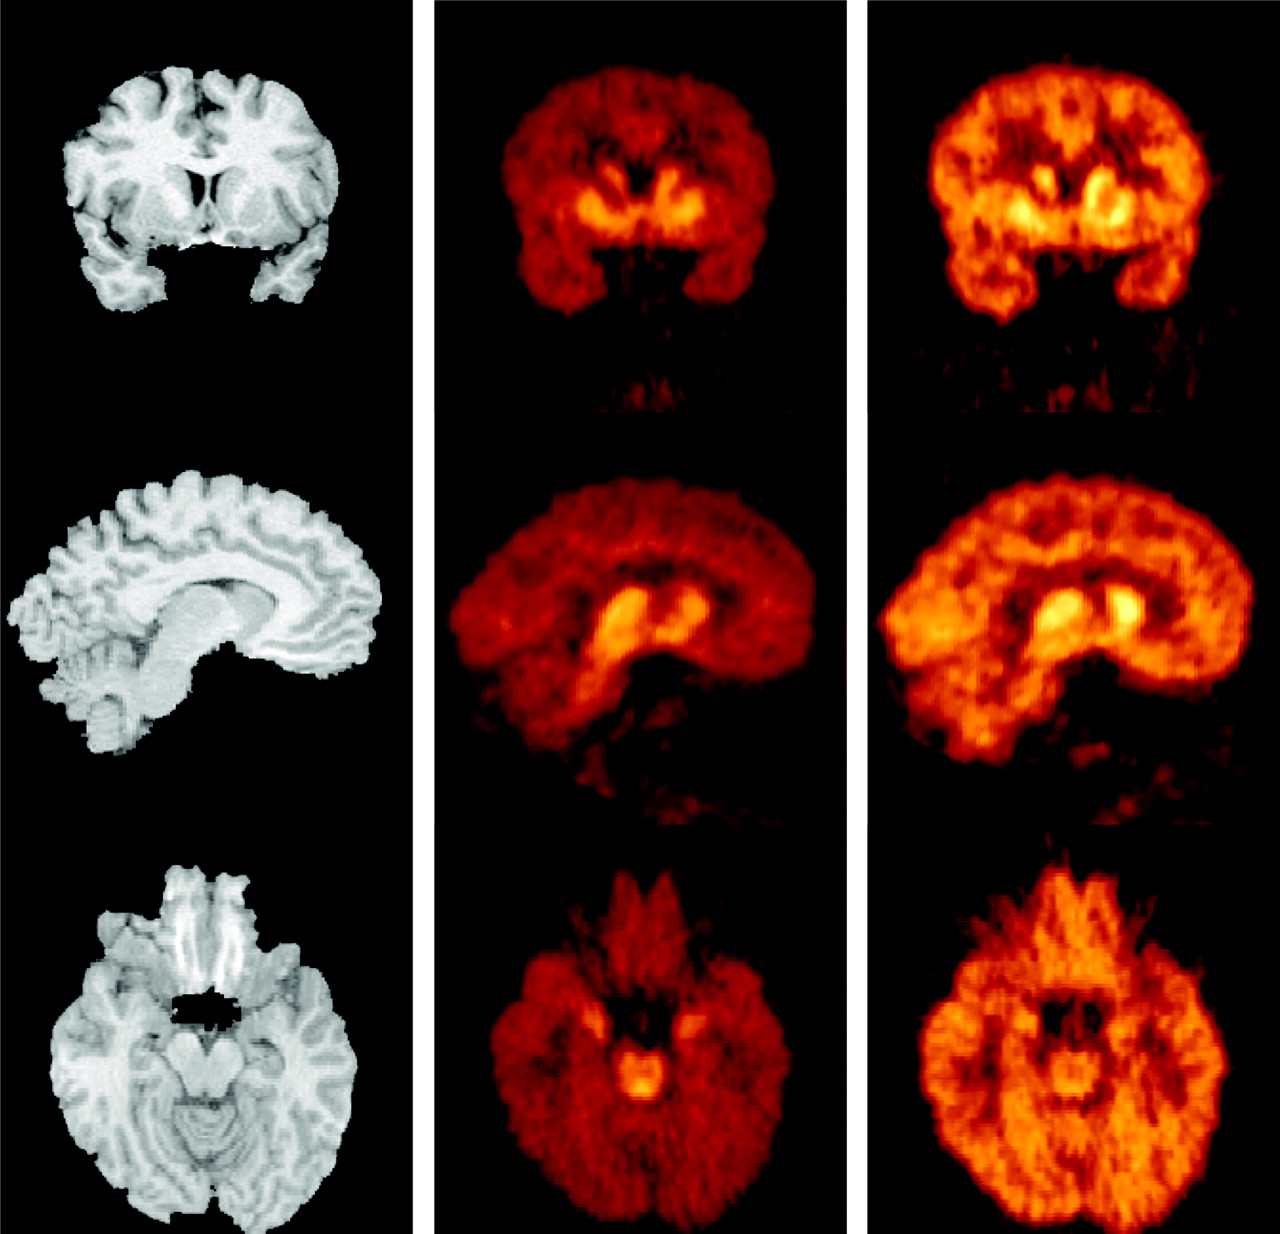
MR images (left) and coregistered PET images acquired from 40 to 90 min after injection of 659 MBq 11C-DASB (center) and 599 MBq 11C-McN 5652 (right) in 33-y-old healthy male volunteer. Activity was normalized to injected dose and color coded using identical scale. (Top row) Coronal plane illustrates ventrodorsal gradient of SERT in striatum. (Middle row) Sagittal plane close to midline shows accumulation of activity in thalamus and caudate. Image also illustrates low level of activity in cerebellum and small difference in uptake between cerebellum and neocortical regions. (Bottom row) Transaxial plane at level of midbrain. Note very high activity concentration in dorsal raphe on 11C-DASB scan, just ventral to fourth ventricle. Concentration of activity in amygdala is also noticeable on 11C-DASB image.
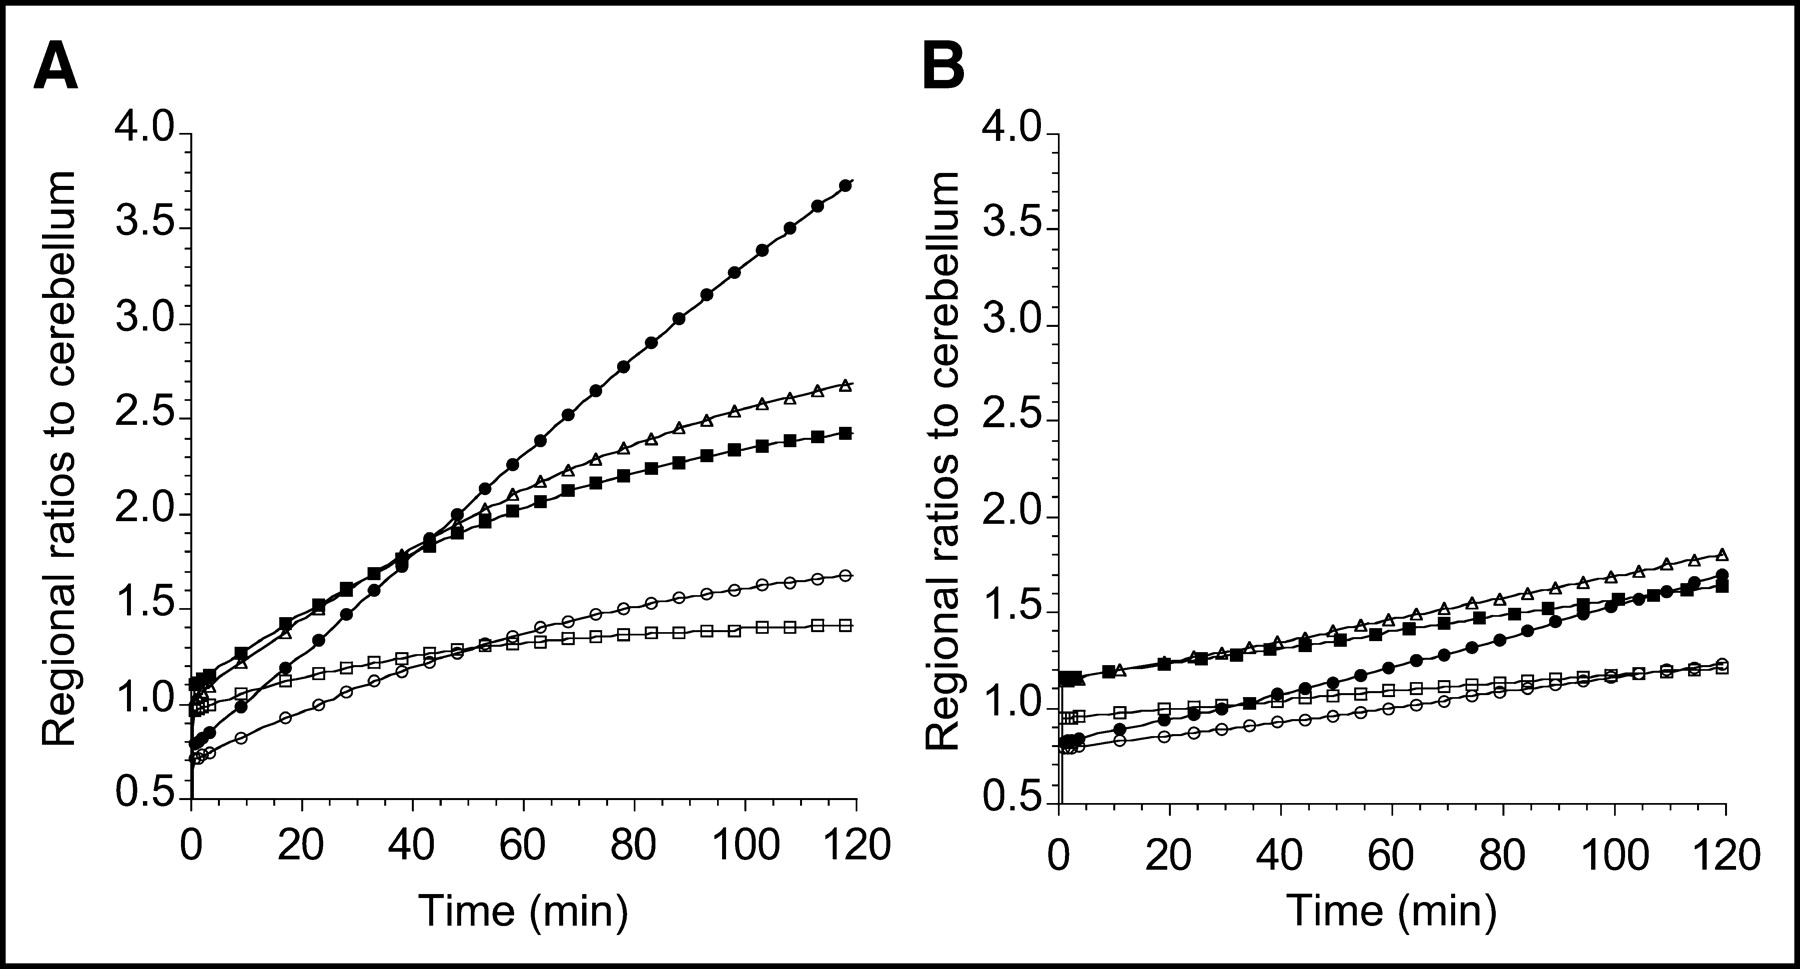
Differences in brain uptake of 11C-DASB and 11C-McN 5652 are illustrated in Figure 5, which presents the time–activity curves for 11C-DASB and 11C-McN 5652 in representative brain regions recorded in the same subject on the same day for 120 min. The 11C-DASB uptake displayed a well-defined peak, followed by rapid washout in all regions, whereas the 11C-McN 5652 uptake was more protracted. Corresponding specific-to-nonspecific ratios are shown in Figure 6 and are notably higher for 11C-DASB than for 11C-McN 5652. Visual inspection of Figure 5 reveals that the fit is not perfect for either 11C-DASB or 11C-McN 5652, with nonrandom distribution of the residuals. For 11C-DASB, the 1TC model-fitted curve tends to fall below the early data points, above the intermediate time points, and below the late time points. A similar pattern is seen with 11C-McN 5652. However, using a higher-order model (e.g., a 2-tissue-compartment model [2TC model]) does not offer significant improvement in the fit over the 1TC for either 11C-DASB (data not shown (17)) or for 11C-McN 5652 (7).
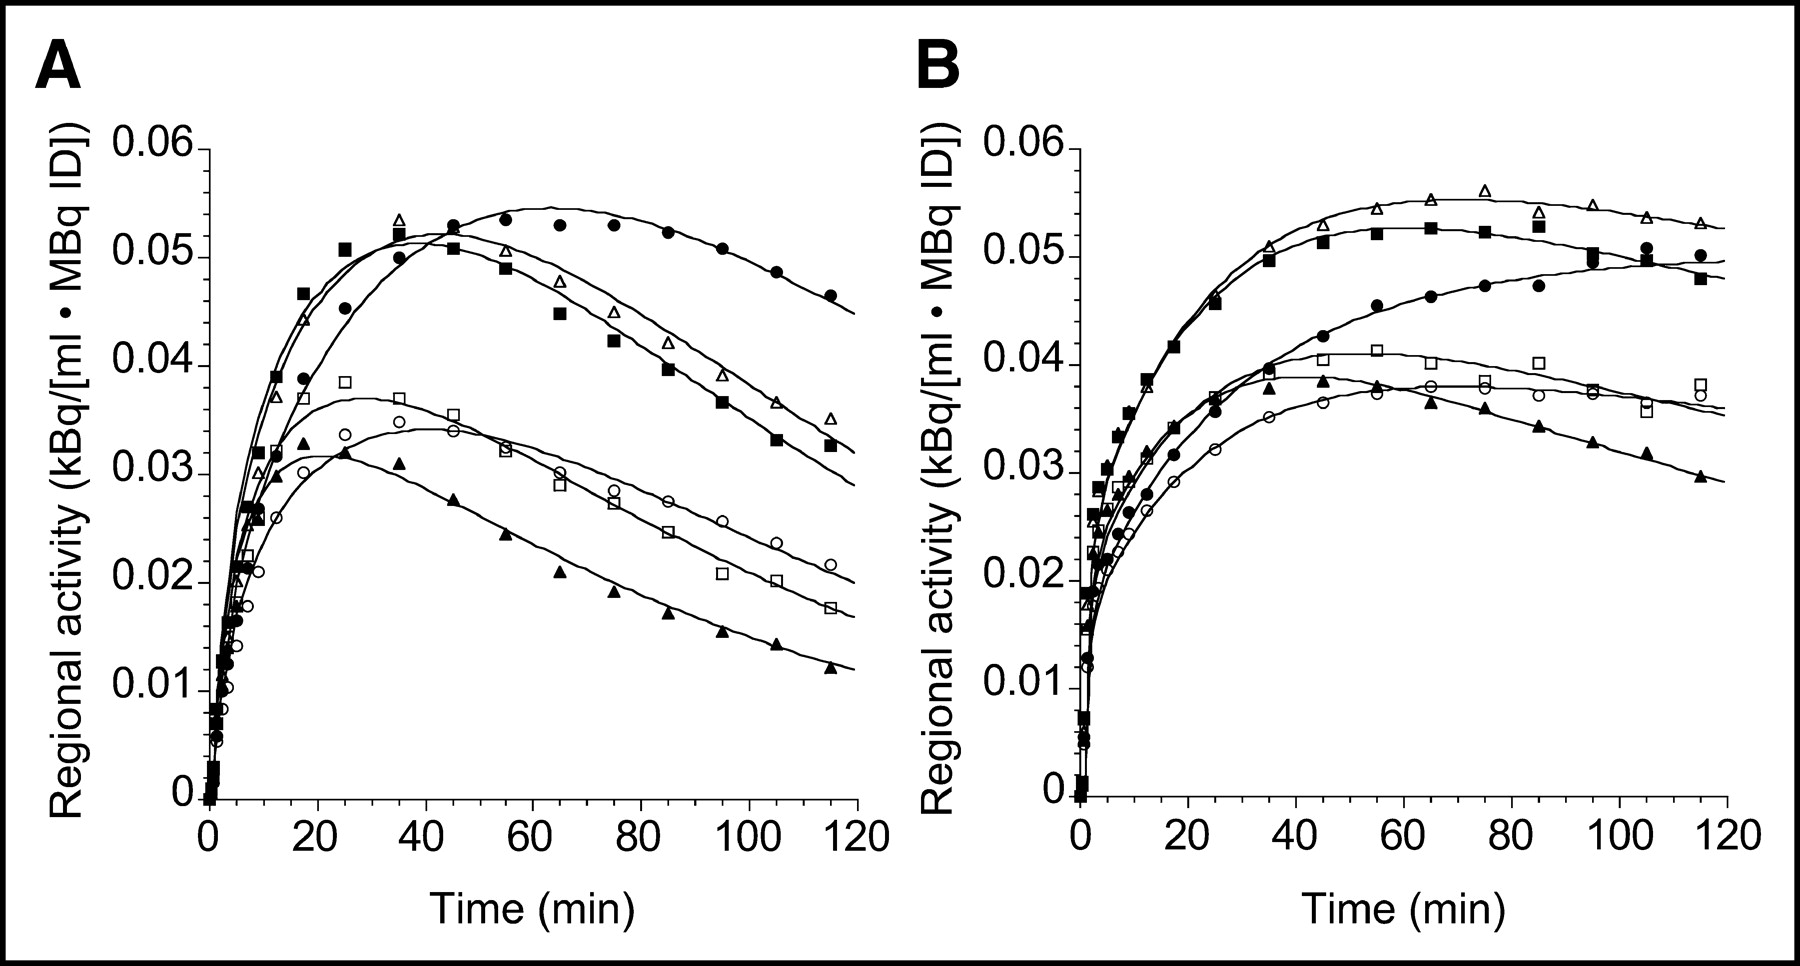
Time–activity curves of 11C-DASB (A) and 11C-McN 5652 (B) measured on same day in same human subject. Regions displayed include midbrain (•), thalamus (▪), striatum (▵), medial temporal lobe (○), anterior cingulate cortex (□), and cerebellum (▴). Points are measured activities in ROIs; lines are fitted values to 1TC model. y-Axis scale has been kept constant. Compared with 11C-McN 5652, 11C-DASB displays faster kinetics of uptake, with better-defined peak uptake and rapid washout. ID = injected dose.

Ratios of ROIs to cerebellum of 11C-DASB (A) and 11C-McN 5652 (B) measured on same day in same human subject (same experiment as presented in Fig. 5). Regions displayed include midbrain (•), thalamus (▪), striatum (▵), medial temporal lobe (○), and anterior cingulate cortex (□). y-Axis scale has been kept constant. 11C-DASB displays enhanced tissue-to-cerebellum ratios compared with 11C-McN 5652.
Table 1 lists the regional peak uptake times, the rate of tracer washout, and the time of peak specific binding for the different regions. Peak uptake time was calculated as the maximum value of the curve fit to the time–activity data for each region using a 1TC kinetic model. The mean regional peak uptake times for 11C-DASB and 11C-McN 5652 were 42 ± 15 and 61 ± 23 min, respectively. RM ANOVA revealed significant differences in peak uptake between tracers (P < 0.0001) and between regions (P < 0.0001) with no significant tracer-by-region interaction (P = 0.48).
Regional Peak Uptake Times and Regional Activity Washout Rate
The fraction of tracer washout during the scan was estimated by calculating the relative decrease in regional activity over the time course of the scan relative to peak uptake (percentage decrease from peak to end of scan). The mean fractional regional washout rates for 11C-DASB and 11C-McN 5652 were 46% ± 21% and 16% ± 14%, respectively. RM ANOVA revealed significant differences in fractional activity washout between tracers (P < 0.0001) and between regions (P < 0.0001) with no significant tracer-by-region interaction (P = 0.87).
The time of peak specific binding was determined using a 2TC model to derive the component of specific binding for each region in the dataset. In this model, the nonspecific distribution volume was fixed to the value of cerebellum VT, by constraining the K1/k2 ratio. The mean times of peak specific binding for 11C-DASB and 11C-McN 5652 were 40 ± 15 and 56 ± 24 min, respectively. RM ANOVA revealed significant differences in peak uptake between tracers (P < 0.0001), a significant difference between regions (P < 0.0001), and no tracer-by-region interaction (P = 0.86).
Kinetic Rate Constants.
Overall, 11C-DASB had a higher K1 and k2 (0.391 ± 0.06 mL g−1 min−1 and 0.028 ± 0.010 min−1, respectively, average of all regions and all subjects) than 11C-McN 5652 (0.304 ± 0.05 mL g−1 min−1 and 0.011 ± 0.004 min−1, respectively, average of all regions and all subjects). Regional values of K1 and k2 are presented in Table 2. For K1, RM ANOVA revealed significant between-tracer (P < 0.0001) and between-region (P < 0.003) differences, with no tracer-by-region interaction (P = 0.99). A significant tracer-by-subject interaction was also noted (P < 0.0001). A significant between-tracer and between-region difference was observed in the regional values of k2 (P < 0.0001) with a significant region-by-tracer interaction (P < 0.001).
Kinetic Analysis: Rate Constants, Total Distribution Volumes, and Minimal Scanning Time
Distribution Volumes.
Regional values of VT are shown in Table 2. Using RM ANOVA, significant differences in VT were observed between tracers (P < 0.0001) and between regions (P < 0.0001), with no tracer-by-region interaction (P = 0.40). 11C-DASB had a lower VT than 11C-McN 5652 (16.3 mL g−1 compared with 28.9 mL g−1, average of all regions, all subjects).
Minimal Scan Time.
Table 2 lists the minimal scanning times required to reach time-independent measures of VT for 11C-DASB and 11C-McN 5652 in different regions. The mean regional minimal scan time for 11C-DASB (79 ± 9 min) was significantly longer than that of 11C-McN 5652 (61 ± 16 min; P < 0.001). Figure 7 displays the biases and errors associated with shorter scan durations for each radiotracer in the region of highest SERT density (midbrain). Stable measurements of VT in the midbrain required 95 min of data for both 11C-DASB and 11C-McN 5652.
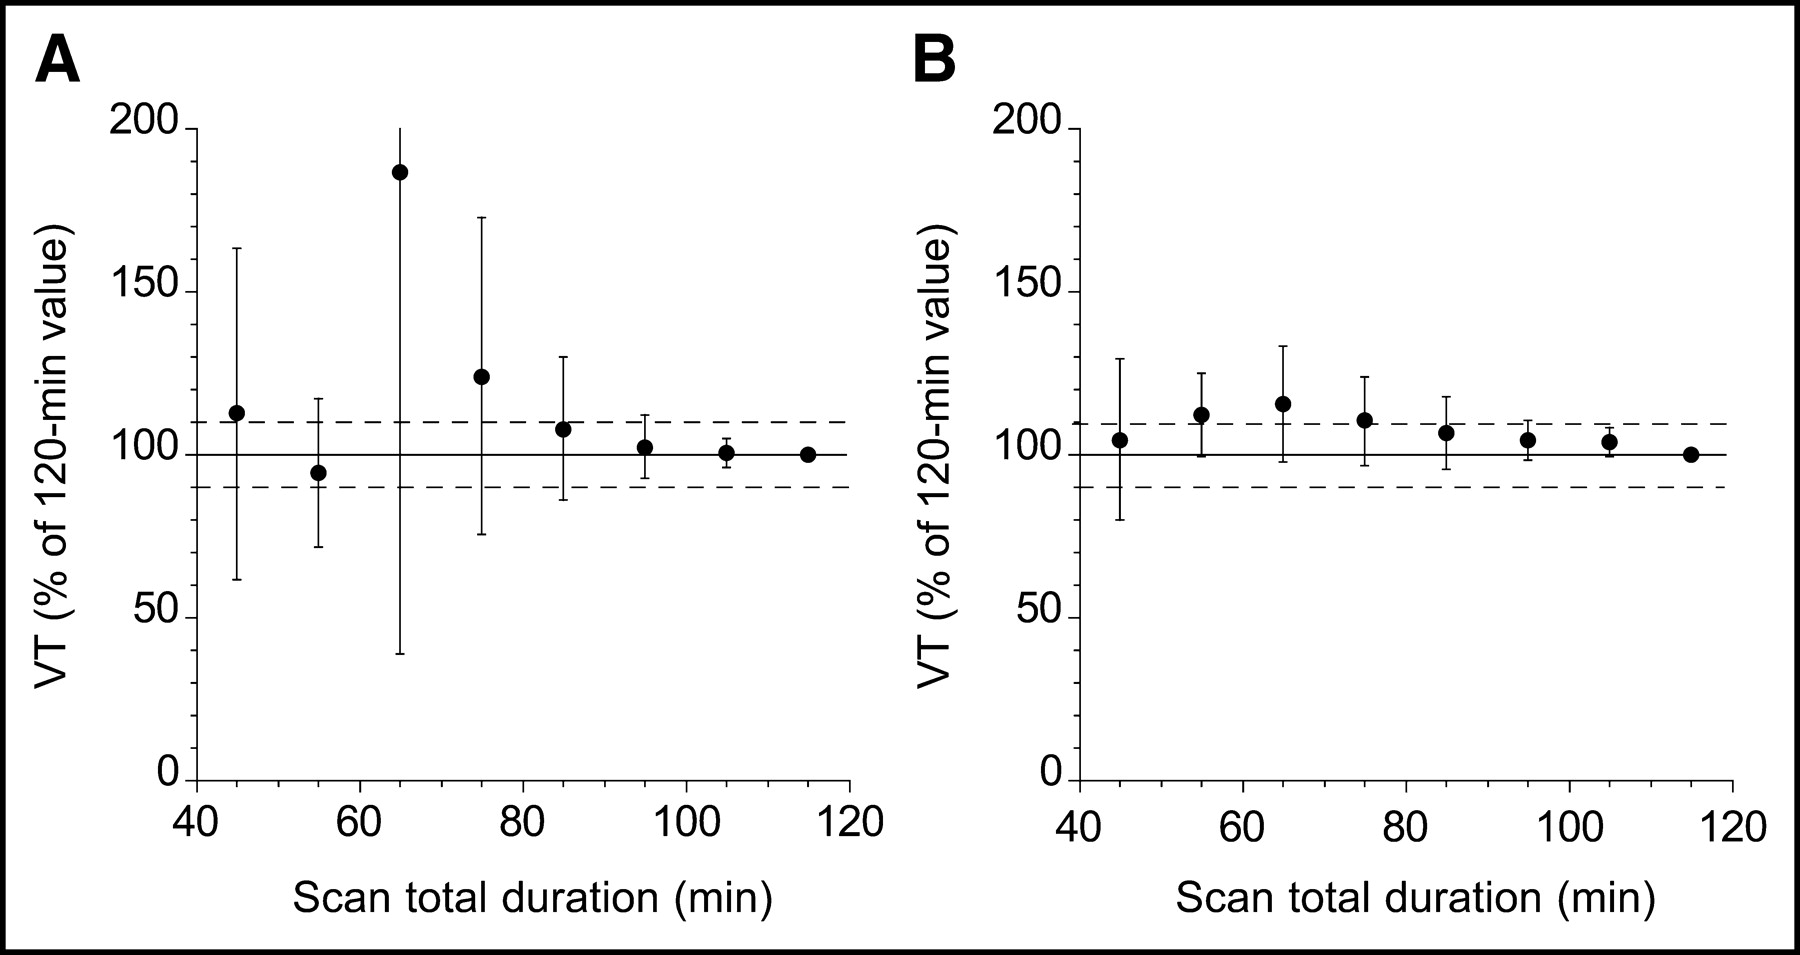
Time–stability of 11C-DASB (A) and 11C-McN 5652 (B) VT in midbrain. Times refer to midtimes of each 10-min acquisition. Data of shorter duration were analyzed, and estimated midbrain VT (mean ± SD) is expressed as percentage of value derived with complete dataset (120 min). Each point is average of 6 datasets. Deviation from 100% of mean value indicates bias associated with shorter scanning times, whereas SD indicates error associated with shorter scanning times.
Nonspecific Distribution Volumes.
Values of cerebellar VT are presented in Table 2. 11C-DASB had a significantly lower cerebellar VT than 11C-McN 5652 (P < 0.0001). No difference was seen between subjects in the nonspecific distribution volume (P = 0.98). Since f1 could not be reliably determined for 11C-McN 5652, f2 could only be determined for 11C-DASB (0.92% ± 0.24%).
BP.
Table 3 lists the regional values of BP for each tracer. Significant differences in BP were observed between tracers (P < 0.0001) and between regions (P < 0.0001) with a significant tracer-by-region interaction (P < 0.001).
BP and Specific-to-Nonspecific Partition Coefficients
Specific-to-Nonspecific Partition Coefficient.
Table 3 lists the regional values of V3″ for each tracer. A significant difference was observed between tracers (P < 0.0001) and between regions (P < 0.0001) with a significant tracer-by-region interaction (P < 0.0001).
Regional Distribution of Binding Sites.
As expected, since both radiotracers bind to the SERT, across all regions for all subjects, a significant correlation between 11C-DASB V3″ and 11C-McN 5652 V3″ was observed (R2 = 0.88; P < 0.0001). Regional variations in V3″ should reflect the variability in regional Bmax since V3″ corresponds to f2Bmax/Kd, and f2 and Kd are not expected to vary between regions. As both radiotracers bind to the same population of binding sites, the relative regional distribution of V3″ should be similar. To compare the relative V3″ of 11C-DASB with that of 11C-McN 5652, regional V3″ values were expressed as a percentage of the midbrain V3″ (Fig. 8). A significant difference was seen in the regional percentage of midbrain V3″ between tracers (P < 0.0001) and between regions (P < 0.0001) as well as a region-by-tracer interaction (P < 0.0001).
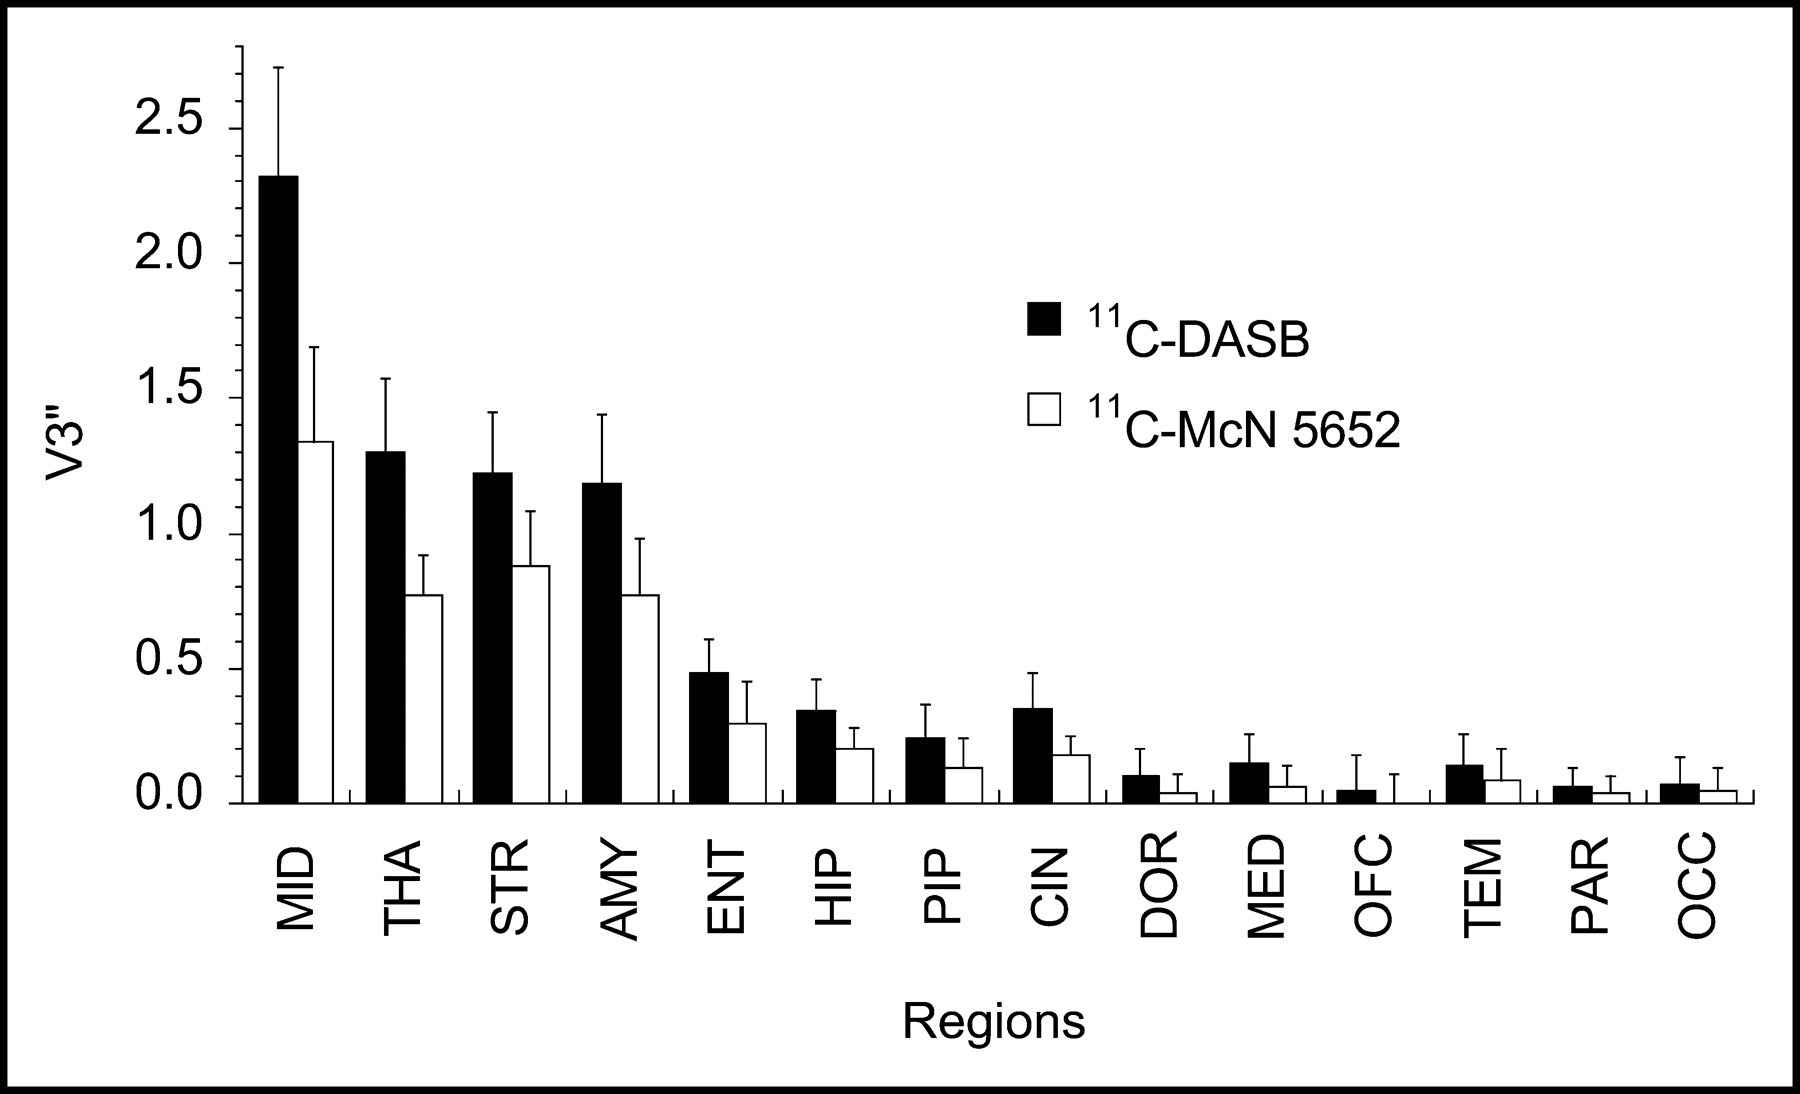
Regional V3″ measured with 11C-DASB (▪) and 11C-McN 5652 (□) in midbrain (MID), thalamus (THA), striatum (STR), amygdala (AMY), entorhinal cortex (ENT), hippocampus (HIP), parahippocampal gyrus (PIP), cingulate cortex (CIN), dorsolateral prefrontal cortex (DOR), medial prefrontal cortex (MED), orbitofrontal cortex (OFC), temporal cortex (TEM), parietal cortex (PAR), and occipital cortex (OCC). Values are mean ± SD (n = 6).
DISCUSSION
In this study, the imaging qualities of the new PET radioligand for the SERT, 11C-DASB, was compared with the reference tracer, 11C-McN 5652. The introduction of 11C-McN 5652 as a PET radioligand suitable for use in humans (6) represented an important advance. Before the introduction of 11C-McN 5652, only the SPECT ligand 123I-2β-carbomethoxy-3β-(4-iodophenyl)tropane (123I-β-CIT) was available for SERT imaging in humans. Due to its lack of selectivity, the use of 123I-β-CIT for SERT measurement was restricted to the midbrain (40). 11C-McN 5652 enabled SERT imaging not only in the midbrain but also in other regions of high SERT density, such as the thalamus and striatum. However, the relatively low specific-to-nonspecific binding ratio of 11C-McN 5652 precluded the reliable measurement of SERT in regions of moderate and low SERT density, such as the limbic and cortical regions.
Recently, Wilson et al. (13,14) described the synthesis and evaluation of a new class of SERT radiotracers, one of which was 11C-DASB. Subsequently 11C-DASB has been introduced in humans (16,17). Two studies compared the imaging qualities of 11C-McN 5652 and 11C-DASB in baboons and concluded that 11C-DASB provided significant improvement over 11C-McN 5652, as it provides higher specific-to-nonspecific binding ratios, higher plasma free fraction, and a faster uptake kinetics (18,19). The aim of this study was to determine whether the improved properties of 11C-DASB observed in baboon studies were preserved in human subjects. To provide an unbiased comparison of the tracers, both tracers were studied in the same human subjects under identical experimental conditions.
Plasma Analysis
A desirable property of any brain PET radiotracer is relatively fast brain kinetics of uptake and washout, which allow for a short scanning time. This property is usually promoted by a fast peripheral metabolism and plasma clearance. The relatively slow metabolism and clearance of 11C-McN 5652 contribute, among other factors, to its protracted brain uptake. Regarding metabolism rate, predictions from baboon studies were confirmed in this study. In baboons, the rate of metabolism of 11C-DASB was faster than that of 11C-McN 5652. For example, the parent fractions of 11C-DASB and 11C-McN 5652 at 30 min after injection were 20% ± 6% and 28% ± 13%, respectively. In humans, the metabolism of both tracers was slower than in baboon, but the rate of metabolism of 11C-DASB remained significantly faster (32% ± 6% at 30 min) than that of 11C-McN 5652 (59% ± 13% at 30 min).
In contrast, examination of the plasma clearance revealed an important difference between baboons and humans. In baboons, the clearance rate of 11C-DASB (84 ± 23 L h−1) was faster than that of 11C-McN 5652 (58 ± 13 L h−1) (n = 4 per tracer (18)). In humans, the clearance of 11C-DASB (159 ± 34 L h−1) was not significantly different from that of 11C-McN 5652 (170 ± 53 L h−1). After normalizing for body weight (baboon, 25 kg; human, 70 kg), the plasma clearance of 11C-DASB was faster in baboons (3.36 L h−1 kg−1) compared with that of humans (2.27 L h−1 kg−1), whereas the clearance of 11C-McN 5652 was similar in both species (baboons, 2.32 L h−1 kg−1; humans 2.43 L h−1 kg−1).
This species difference in plasma clearance impacted on the scanning time. In baboons, the faster plasma clearance of 11C-DASB contributed to its faster brain uptake kinetics and shorter minimal scan duration. In humans, the plasma clearance of both ligands was similar, and the advantage of 11C-DASB over 11C-McN 5652 in terms of minimal scan duration was not observed in humans.
As previously reported, the plasma free fraction of 11C-McN 5652 is not measurable with our standard technique (7). In contrast, the free fraction of 11C-DASB was measurable, allowing for the control of this parameter in clinical studies. Without the measurement of f1, between conditions differences in brain distribution volumes are difficult to interpret. The plasma free fraction of 11C-DASB measured in this study (8.9% ± 1.6%) was similar to that reported previously in humans (11.0% ± 1.2%) (17) and baboons (13.5% ± 1.7%) (18).
Image Analysis
Inspection of the activity distribution (Fig. 4), time–activity curves (Fig. 5), and ratios to cerebellum curves (Fig. 6) reveals one of the major differences between these 2 tracers—that is, the improved signal-to-noise ratio. On the 11C-DASB images, the cerebellum is darker, and the contrast between the regions rich in SERT and the cerebellum is much sharper. Examination of the midbrain on the transaxial images in Figure 4 is instructive. With tracers such as 123I-β-CIT or 11C-McN 5652, the midbrain appeared as a homogenous region of high binding. With 11C-DASB, the higher concentration of SERT in the dorsal raphe compared with the rest of the midbrain is noticeable as high activity concentrated just above the fourth ventricule. The higher concentration of SERT in the amygdala is also visually detectable with 11C-DASB but not with 11C-McN 5652.
Uptake Kinetics and Scan Duration
The kinetic analysis was performed using a 1TC model for both tracers, the model of choice for both 11C-McN 5652 (5,7,8) and 11C-DASB (17). The value of K1 for 11C-DASB reported in this study (0.465 ± 0.08 mL g−1 min−1) was in the same range as that reported by Ginovart et al. (17) in humans and about one third of that observed in baboons (18). The value of 11C-McN 5652 K1 in the current study (0.302 ± 0.04 mL g−1 min−1) was in good agreement with the value reported in a previous study from our group (0.248 ± 0.37 mL g−1 min−1) (7).
Compared with 11C-McN 5652, 11C-DASB displayed an earlier regional peak uptake and peak specific binding, and, by 90 min, more of the 11C-DASB activity was cleared from the brain. Yet, the faster kinetics of 11C-DASB did not translate into a shorter minimal scan duration required to derive time-independent estimates of VT when compared with 11C-McN 5652. This finding contrasts with that observed in baboons (18). In baboons, the regional minimal scan duration for 11C-DASB was 37 ± 11 min, significantly shorter than that for 11C-McN 5652 (65 ± 5 min). In humans, the regional minimal scan duration for 11C-DASB was 79 ± 11 min versus 59 ± 16 min for 11C-McN 5652. Thus, the regional minimal scan duration was identical in baboons and humans for 11C-McN 5652, reflecting the fact that the plasma clearance of 11C-McN 5652 is similar in both species. In contrast, the slower plasma clearance of 11C-DASB in humans compared with baboons translated into a sizeable increase in the regional minimal scan duration. In the midbrain, the region with the highest SERT density, the time of peak specific binding was not significantly different between the 2 tracers, contributing to an identical requirement in scanning time for 11C-DASB and 11C-McN 5652 in this region. For both 11C-DASB and 11C-McN 5652, 95 min of scanning was needed to derive a time-invariant estimate of midbrain VT.
Regarding 11C-McN 5652 minimal scan duration, the findings from this study (n = 6) were in disagreement with the results obtained in our initial human dataset (n = 6), in which we observed a regional minimal scan duration of 117 ± 13 min (7). In the previous study, the long scan duration was due to the results from one outlier individual. Because no valid reason for removing this individual from the analysis could be identified, results were reported using the whole dataset, including the outlier. Removal of this subject would have resulted in a finding similar to that of the current study. In addition, we examined this issue in a third and larger dataset of 11C-McN 5652 human scans (n = 35). Again, the results were identical to the present dataset. We conclude that the minimal scan duration of 11C-McN 5652 was overestimated in our original study (7).
These considerations highlight an inherent problem when determining the minimal scanning duration based on small samples. It follows that caution must be used in the interpretation of these results for 11C-DASB, which rely on data from 6 individuals. However, the results observed here for 11C-DASB are relatively consistent with the time–stability results reported by Ginovart et al. (n = 5 (17)). Based on a dataset that did not include the midbrain, Ginovart et al. proposed a minimal scan duration of 80 min for 11C-DASB. Based on the present dataset that includes the midbrain, we proposed a minimal scan duration of 95 min for 11C-DASB.
Nonspecific Binding
The cerebellum distribution reported here for 11C-McN 5652 (20.8 ± 3.6 mL g−1) was similar to values reported previously by our group (17.8 ± 1.9 mL g−1) (7). The cerebellum distribution volume of 11C-DASB (10.1 ± 2.0 mL g−1) was significantly lower than that of 11C-McN 5652 and in good agreement with the value reported by Ginovart et al. (11.8 ± 1.5 mL g−1) (17). The lower nonspecific distribution volume of 11C-DASB compared with that of 11C-McN 5652 observed here in the same human subjects confirmed a similar observation made in baboons: In that species, nonspecific distribution volumes for 11C-DASB and 11C-McN 5652 were 17.3 ± 0.5 mL g−1 and 27.7 ± 4.0 mL g−1, respectively (18). The lower nonspecific distribution volume of 11C-DASB confers on this tracer a critical advantage compared with 11C-McN 5652, as the high nonspecific distribution volume of 11C-McN 5652 hampers the ability to achieve high signal-to-noise ratios.
Receptor Parameters
The BP of 11C-DASB was lower than that of 11C-McN 5652 by 22% ± 27%. As both tracers presumably bind to the same population of sites (same Bmax), the relative magnitude of BP will depend on the respective values of f1 and Kd (BP = f1Bmax/Kd). In vitro, the Kd of 11C-DASB is 0.87 ± 0.41 nmol/L and 1.77 ± 0.25 nmol/L at 22°C and 37°C, respectively (18). 11C-McN 5652 Kd is 0.33 ± 0.12 and 0.26 ± 0.13 nmol/L at 22°C and 37°C, respectively (18). Thus, the affinity of 11C-DASB for SERT is 3–7 times lower than that of 11C-McN 5652. However, this large difference in Kd did not translate into a large difference in BP, because the plasma free fraction of 11C-DASB is higher than that of 11C-McN 5652.
The imaging qualities of a tracer are not defined by BP alone but rather by the ratio of BP to nonspecific distribution volume—that is, V3″. For a given region, a higher value of V3″ means an improved signal-to-noise ratio and better reliability in the measurement. The values of V3″ for 11C-McN 5652 measured in this study were in good agreement with our previously published study (7). However, values of 11C-DASB V3″ measured here were lower than those reported by Ginovart et al. (17). Note that the quantity denoted V3″ here is denoted BP in the study of Ginovart et al. (17). For example, 11C-DASB V3″ in the thalamus was 1.27 ± 0.29 in this study, compared with 2.00 ± 0.34 in the Ginovart study (17). 11C-DASB V3″ in the occipital cortex was 0.06 ± 0.10 in this study, compared with 0.51 ± 0.09 in the Ginovart study (17). The reasons for these differences are not obvious, as the same analytic method was used to derive VT and V3″ (1TC model). This difference is presumably due to the method used to define ROIs and cerebellum boundaries and highlights the difficulties in comparing V3″ data across groups.
11C-DASB V3″ values, though lower than previously reported in Ginovart et al. (17), were significantly higher than V3″ values of 11C-McN 5652. Combining all regions, the V3″ values for 11C-DASB was increased by 74% ± 33% compared with those for 11C-McN 5652. This result is similar to that observed in baboon. In that species, 11C-DASB V3″ values were found to be 42% ± 29% higher than that of 11C-McN 5652 (18). This higher signal-to-noise ratio of 11C-DASB compared with that of 11C-McN 5652 is due to lower nonspecific binding rather than higher BP and is the most clinically significant difference between the tracers. Due to this enhanced signal-to-noise ratio, 11C-DASB should allow for a more reliable quantification of SERT parameters in regions of moderate SERT densities, such as the limbic regions. However, in our hands, values of V3″ with 11C-DASB are still very low in neocortical regions (V3″ < 0.2), and it is unlikely that 11C-DASB would be able to provide a reliable measurement of SERT in these brain areas.
When comparing the V3″ values for each tracer across regions, a significant tracer-by-region interaction was observed. This interaction was unexpected and reminiscent of a similar finding in baboons (18). To explore this issue further, regional V3″ values were normalized for each tracer to the midbrain V3″ value. Assuming that both tracers bind to the same population of receptors, and that, for each tracer, Kd and nonspecific distribution volumes are constant across regions, the normalized V3″ values should be identical for both tracers. In general, this prediction was confirmed (Table 3). However, as seen in baboons, the normalized V3″ value for 11C-McN 5652 was greater in the striatal regions than that of 11C-DASB. The reason for this discrepancy was not clear and might be due to regional differences in nonspecific binding. Another possibility would be that, in the striatum, 11C-McN 5652 exhibits significant binding to an as yet unidentified receptor.
CONCLUSION
The newly developed SERT radiotracer 11C-DASB was compared with the reference tracer 11C-McN 5652 in the same human subjects, under identical experimental conditions. In baboons, 3 critical advantages of 11C-DASB were observed: (a) higher specific-to-nonspecific equilibrium activity ratios—that is, higher V3″; (b) measurable plasma free fraction; and (c) faster brain uptake kinetics and shorter minimal scan duration. Two of 3 of these improvements were confirmed in humans: (a) regional 11C-DASB V3″ values were significantly higher; and (b) 11C-DASB plasma free fraction was measurable with the conventional ultracentrifugation method. However, the plasma clearance of 11C-DASB was significantly slower in humans than in baboons, and, in humans, the minimal scan duration of 11C-DASB was not shorter than that of 11C-McN 5652. From this comparative evaluation, 11C-DASB emerged as the tracer of choice for the quantification of SERT, an advantage that should be mostly relevant to the study of SERT in the limbic regions. Additional research is needed to develop a radioligand that will enable the examination of SERT in neocortical regions.
Acknowledgments
This work was supported in part by grants from the National Alliance for Research on Schizophrenia and Depression, the National Institute of Mental Health (1 R21 MH66624-01, 1-K02-MH01603-01), and the Lieber Center for Schizophrenia Research at Columbia University. The authors thank Alan Wilson for providing the precursor for 11C-DASB and acknowledge the technical assistance of Julie Arcement, Jennifer Bae, Susan Curry, Ashlie Darr, Ingrid Gelbard-Strokes, Charisse Green, Elizabeth Hackett, Kimchung Ngo, Chaka Peters, Ben Poletta, Nurat Quadri, Norman Simpson, Lyudmila Savenkova, Kris Wolff, and Zohar Zephrani.
Footnotes
Received Jul. 23, 2003; revision accepted Nov. 17, 2003.
For correspondence or reprints contact: W. Gordon Frankle, MD, New York State Psychiatric Institute, 1051 Riverside Dr., Box 31, New York, NY 10032.
E-mail: wf2004{at}columbia.edu
REFERENCES
In this issue


Jump to section
Related Articles
Cited By...
- Imaging Pituitary Vasopressin 1B Receptor in Humans with the PET Radiotracer 11C-TASP699
- First-in-Human Assessment of 11C-LSN3172176, an M1 Muscarinic Acetylcholine Receptor PET Radiotracer
- First-in-Human Evaluation of 18F-SynVesT-1, a Radioligand for PET Imaging of Synaptic Vesicle Glycoprotein 2A
- Kinetic Modeling and Test-Retest Reproducibility of 11C-EKAP and 11C-FEKAP, Novel Agonist Radiotracers for PET Imaging of the {kappa}-Opioid Receptor in Humans
- First-in-Human Assessment of the Novel PDE2A PET Radiotracer 18F-PF-05270430
- In Vivo Characterization of a Series of 18F-Diaryl Sulfides (18F-2-(2'-((Dimethylamino)Methyl)-4'-(Fluoroalkoxy)Phenylthio)Benzenamine) for PET Imaging of the Serotonin Transporter
- Compartmental Modeling of 11C-HOMADAM Binding to the Serotonin Transporter in the Healthy Human Brain
- Human 5-HT Transporter Availability Predicts Amygdala Reactivity In Vivo
- Imaging the serotonin transporter during major depressive disorder and antidepressant treatment: 2005 CCNP Young Investigator Award Paper
- Metabolite Considerations in the In Vivo Quantification of Serotonin Transporters Using 11C-DASB and PET in Humans
- Estimation of Serotonin Transporter Parameters with 11C-DASB in Healthy Humans: Reproducibility and Comparison of Methods
- Quantification of 11C-MADAM Binding to the Serotonin Transporter in the Human Brain