


Visual Abstract

Abstract
This was a first-in-human study of the PET radiotracer 11C-LSN3172176 for the muscarinic acetylcholine receptor subtype M1. The objectives of the study were to determine the appropriate kinetic model to quantify binding of the tracer to M1 receptors, and the reliability of the chosen quantification method. Methods: Six healthy subjects completed the test–retest protocol, and 5 healthy subjects completed the baseline-scopolamine blocking protocol. Multiple modeling methods were applied to calculate total distribution volume (VT) and nondisplaceable binding potential (BPND) in various brain regions. The reference region was selected from the blocking study. The occupancy plot was applied to compute receptor occupancy by scopolamine and nondisplaceable distribution volume. Results: Tracer uptake was highest in the striatum, followed by neocortical regions and white matter, and lowest in the cerebellum. Regional time–activity curves were fitted well by all models. The 2-tissue-compartment (2TC) model fits were good, but the 2TC parameters often could not be reliably estimated. Because VT correlated well between the 2TC and 1-tissue-compartment (1TC) models after exclusion of unreliable estimates, the 1TC model was chosen as the most appropriate. The cerebellum showed the lowest VT, consistent with preclinical studies showing little to no specific binding in the region. Further, cerebellar VT did not change between baseline and blocking scans, indicating that the cerebellum is a suitable reference region. The simplified reference tissue model (SRTM) slightly underestimated 1TC BPND, and the simplified reference tissue model 2 (SRTM2) improved BPND estimation. An 80-min scan was sufficient to quantify VT and BPND. The test–retest study showed excellent absolute test–retest variability for 1TC VT (≤5%) and BPND (≤10%). In the baseline and blocking studies, occupancy values were lower in the striatum than in nonstriatal regions, as may be attributed to differences in regional acetylcholine concentrations. Conclusion: The 1TC and SRTM2 models are appropriate for quantitative analysis of 11C-LSN3172176 imaging data. 11C-LSN3172176 displayed excellent test–retest reproducibility and is a highly promising ligand to quantify M1 receptors in the human brain.
The M1 subtype of the muscarinic acetylcholine receptor (mAChR) is a G-protein–coupled receptor and the most prevalent among the 5 identified mAChR subtypes (M1–M5). M1 is richly expressed in forebrain regions, including the striatum, hippocampus, and cortex, but absent in the cerebellum (1). M1-abundant regions are involved in motor control, cognition, and memory regulation. As a result, M1 is implicated in diseases such as Alzheimer disease, Parkinson disease, and other psychiatric disorders (2,3). M1 receptors have 2 interconvertible affinity states: high-affinity, or active, and low-affinity, or inactive (silent) (4). According to the classic 2-state theory of G-protein–coupled receptors, antagonist PET ligands bind to receptors in both the active and the inactive states, whereas agonist ligands bind only to the receptors in the high-affinity, active state (5).
Several mAChR antagonist radiotracers have previously been reported, such as 11C-scopolamine (6), 11C-N-methylpiperidyl benzilate (7), [N-11C-methyl]-benztropine (8), and 11C-quinuclidinyl benzilate (9). However, most demonstrated a lack of selectivity to the M1 subtype, slow kinetics, or low specific binding. As for mAChR agonist radiotracers, 11C-xanomeline and 11C-butylthio-TZTP (thiadiazolyltetrahydro-1-methyl-pyridine) are not selective for M1 and display high affinity for σ-receptors (10). The putative M1 agonist radiotracer 11C-AF150(S) displayed rapid kinetics in rats but no measurable specific binding (11). 11C-GSK1034702 was an M1 allosteric agonist with good brain uptake in humans, but its total distribution volume (VT) was similar across brain regions, including the cerebellum, suggesting negligible specific binding (12). More recently, 11C-(S,R)-1-methylpiperidin-3-yl)2-cyclopentyl-2-hydroxy-2-phenylacetate was reported to be an M1 agonist radioligand with good imaging characteristics in monkeys (13). However, its binding was only partially blocked by the M1 selective antagonist pirenzepine, indicating a moderate M1 selectivity. We have developed a novel M1 agonist radioligand, 11C-LSN3172176 (Fig. 1) (14), and evaluated it in monkeys (15). LSN3172176 exhibited high binding affinity to M1 (inhibition constant [Ki] = 8.9 nM) and lower binding affinity for other mAChR subtypes, with a rank order of M1 > M4 (Ki = 41.4 nM), M5 (Ki = 55.6 nM), M2 (Ki = 63.8 nM) >> M3 (Ki = 3,031 nM) (14). In monkeys, 11C-LSN3172176 demonstrated highly favorable in vivo imaging properties such as high brain uptake, appropriate kinetics amenable to quantitative kinetic modeling, and high specific binding signals (15).
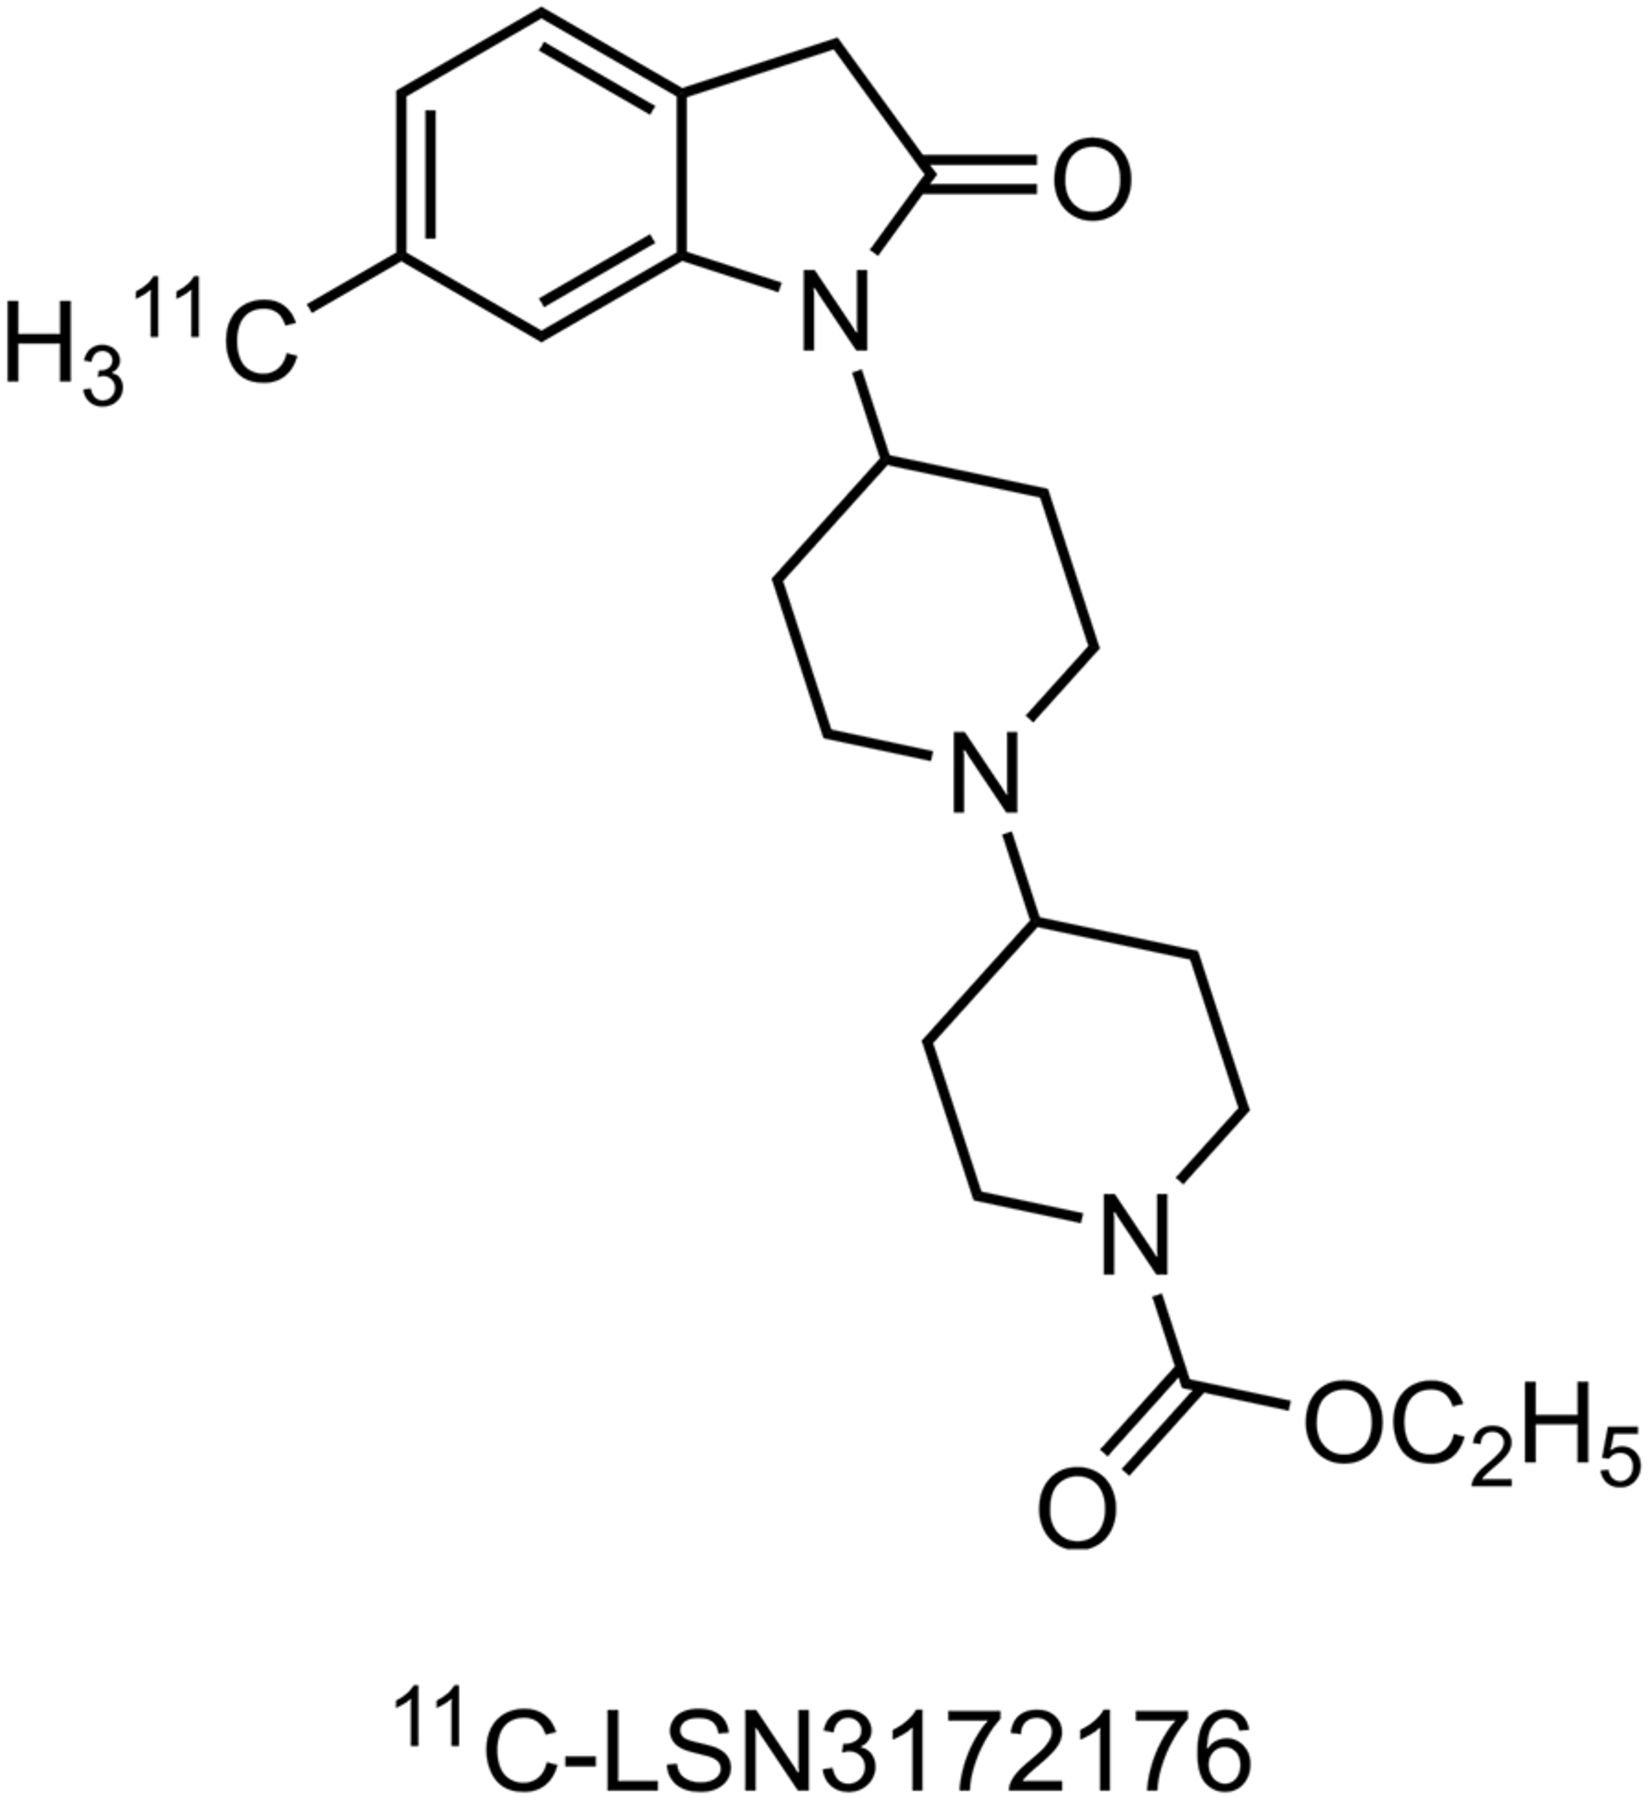
Molecular structure of 11C-LSN3172176.
In this paper, we present first-in-human PET imaging results for 11C-LSN3172176. Baseline and blocking studies with scopolamine were conducted to identify the appropriate kinetic model for quantifying tracer binding and for determining the test–retest variability (TRV) of binding parameters.
MATERIALS AND METHODS
Radiotracer Synthesis
The PET tracer 11C-LSN3172176 was synthesized as described recently (15).
Human Subjects
Eleven healthy people were included. All underwent a comprehensive screening assessment that included a complete physical examination with medical history, routine blood tests, electrocardiogram, and urine toxicology. Individuals were excluded if they had a current or past serious medical, psychiatric, or neurologic illness (including a history of head injury with loss of consciousness); a history of substance abuse or dependence; or metal in their body (an MRI contraindication).
Six subjects (37 ± 10 y; 3 male and 3 female) were enrolled in a test–retest study, and another 5 subjects (42 ± 2 y; 3 male and 2 female) completed a baseline-scopolamine blocking study. The protocol was approved by the Yale Human Investigation Committee (the local institutional review board) and the Yale–New Haven Hospital Radiation Safety Committee and was performed in accordance with the federal guidelines and regulations of the United States for the protection of human research subjects, as detailed in title 45, part 46, of the Code of Federal Regulations. All subjects gave written informed consent.
Brain PET Studies
PET Imaging
Subjects were administered a dose of 11C-LSN3172176 as an intravenous injection over 1 min by an automatic pump (PHD 22/2000; Harvard Apparatus). The approved maximum injected mass was 10 μg per administration. Six subjects had 2 PET scans each on the same day, 5.8 ± 0.9 h apart. Five subjects underwent the baseline and blocking PET scans on 2 consecutive days. The blocking scan was conducted 23.6 ± 0.3 h after scopolamine (1.5 mg) was administered via a transdermal patch placed behind the subject’s left or right ear.
PET images were acquired for 120 min in list mode using the High Resolution Research Tomograph (Siemens Medical Systems). A 6-min transmission scan was conducted for attenuation correction. Dynamic scan data were reconstructed into 207 slices (1.2-mm slice separation) in 33 frames (6 × 30 s, 3 × 1 min, 2 × 2 min, and 22 × 5 min) with corrections for attenuation, normalization, scatter, randoms, and dead time using a motion-compensation ordered-subsets expectation maximization list-mode algorithm for resolution-recovery reconstruction (16). Event-by-event motion correction (17) was included in the reconstruction based on measurements with the Polaris Vicra sensor (NDI Systems), using reflectors mounted on an elastic cap worn by the subject.
MRI
Each subject underwent MRI for PET image registration. The MRI scan was performed using a 3-dimensional magnetization-prepared rapid acquisition with gradient-echo pulse, with an echo time of 2.78 ms, repetition time of 2,500 ms, inversion time of 1,100 ms, and flip angle of 7° on a 3-T whole-body scanner (Trio; Siemens Medical Systems) with a circularly polarized head coil.
Arterial Input Function Measurement
Discrete blood samples were manually drawn every 10 s from 10 to 90 s, every 15 s from 90 s to 3 min, and then at 3.5, 5, 6.5, 8, 13.5, 15, 20, 25, 30, 45, 60, 75, 90, 105, and 120 min. Samples were centrifuged to obtain plasma, and then whole blood and plasma were counted with a calibrated well counter.
Radiotracer metabolism was analyzed using plasma samples collected at 3, 8, 15, 30, 60, and 90 min after injection. Metabolites were analyzed using the column-switching high-performance liquid chromatography method (18) to determine the parent fraction. An ultrafiltration-based method (Centrifree; Millipore) was used for measuring the plasma free fraction. The procedures have been described in detail previously (15).
For the blocking scan of 1 subject, no arterial data were available. This subject was excluded from occupancy calculations.
Image Registration and Regions of Interest
PET images were corrected for motion by frame-by-frame registration to a summed image (0–10 min after injection) using a 6-parameter mutual information algorithm (FLIRT; FSL). The summed PET image was then coregistered to the subject’s T1-weighted MR image (6-parameter affine registration), which was subsequently coregistered to the Automated Anatomic Labeling (AAL) template (19) in Montreal Neurologic Institute (20) space using a nonlinear transformation (Bioimage suite) (21). Using the combined transformations from template-to-PET space, regional time–activity curves in 13 regions were generated: putamen, caudate, frontal cortex, occipital cortex, parietal cortex, temporal cortex, amygdala, globus pallidus, hippocampus, thalamus, cerebellum, and centrum semiovale. The ventral striatum was drawn on the template MR image as in previous work (22).
Regional VT was computed using 1-tissue-compartment (1TC) and 2-tissue-compartment (2TC) models. Each scan and curve were fitted separately. Blood volume in the brain was assumed to be 5% in the 1TC and 2TC models ( , where CPET (t), CT (t), and CWB (t) are the measured PET data, the brain activity, and whole blood activity, respectively).
The occupancy results were visualized with the Lassen plot (23) but analyzed with a nonlinear model, since occupancy was not the same among all regions. The measured VT in n regions at baseline and after drug administration were modeled as  and
and  , where VND is the nondisplaceable distribution volume, r is M1 receptor occupancy by scopolamine, and VS is the specific distribution volume. Nonlinear least-squares (NLLS) fitting (24) was used to estimate parameter
  by minimizing the following cost function:
where  and
and  were determined from the SE of 1TC VT estimates. Thus, a total of n + 2 parameters were estimated using 2 × n data points. A reference region was selected by comparing VT at the baseline and blocking scans with the estimated VND.
BPND was computed using VT from the compartment models for all regions and the selected reference region. The simplified reference tissue model (SRTM) and simplified reference tissue model 2 (SRTM2) were also used to derive BPND directly. In the SRTM2 model, all regional time–activity curves were fitted simultaneously per scan with a common parameter  , the efflux rate of the reference region (coupled parameter fitting).
For VT and BPND, the mean and SD of the TRV [2 × (retest – test)/(test + retest)] and the mean of the absolute value of TRV were calculated. The intraclass correlation coefficients were also calculated.
The minimal scan duration sufficient for reliable estimation of VT and BPND was evaluated by considering shorter datasets (30–120 min in 10-min increments, n = 12). The percentage difference in VT and BPND between x (<120 min) and 120 min were calculated for each scan duration. The minimum scan duration was chosen using previously defined criteria (25): the average VT ratio was between 95% and 105%, and the SD of the ratio was lower than 10%.
RESULTS
Radiochemistry
11C-LSN3172176 was prepared in 14% ± 4% yield (range, 5%–21%) at the end of synthesis based on trapped 11C-methyl iodide. The radiochemical purity was 98% ± 2%, and the molar activity was 692 ± 400 MBq/nmol (range, 144–1,302 MBq/nmol) at the end of synthesis. The average synthesis time was 48 ± 2 min.
Human Injection and Scan Parameters
The injected dose, injected mass, and specific activity at the time of injection for 11C-LSN3172176 are listed in Table 1. Administered activity dose, injected mass, and specific activity did not significantly differ between test and retest scans (2-tailed paired t test: P = 0.43, P = 0.19, and P = 0.23, respectively) or between baseline and blocking scans (P = 0.81, P = 0.46, and P = 0.30, respectively).
Subject Information and PET Scan Parameters
Safety
There were no adverse or clinically detectable pharmacologic effects in any subject. No clinically significant changes in vital signs, laboratory test results, or electrocardiograms were observed.
Plasma Analysis
The parent fraction of 11C-LSN3172176 in plasma decreased moderately over time (Fig. 2). At 60 min after injection, parent fractions were 66% ± 5% and 67% ± 5% for the test and retest scans, respectively, and 64% ± 3% and 65% ± 3% for the baseline and blocking scans, respectively. Free fractions were 0.29 ± 0.03 for test, retest, and baseline scans and 0.28 ± 0.01 for blocking scans. There was no statistically significant difference in plasma free fraction between the test and retest scans (2-tailed paired t test: P = 0.51) or between the baseline and blocking scans (P = 0.24). The TRV of the plasma free fraction was −3% ± 11%.
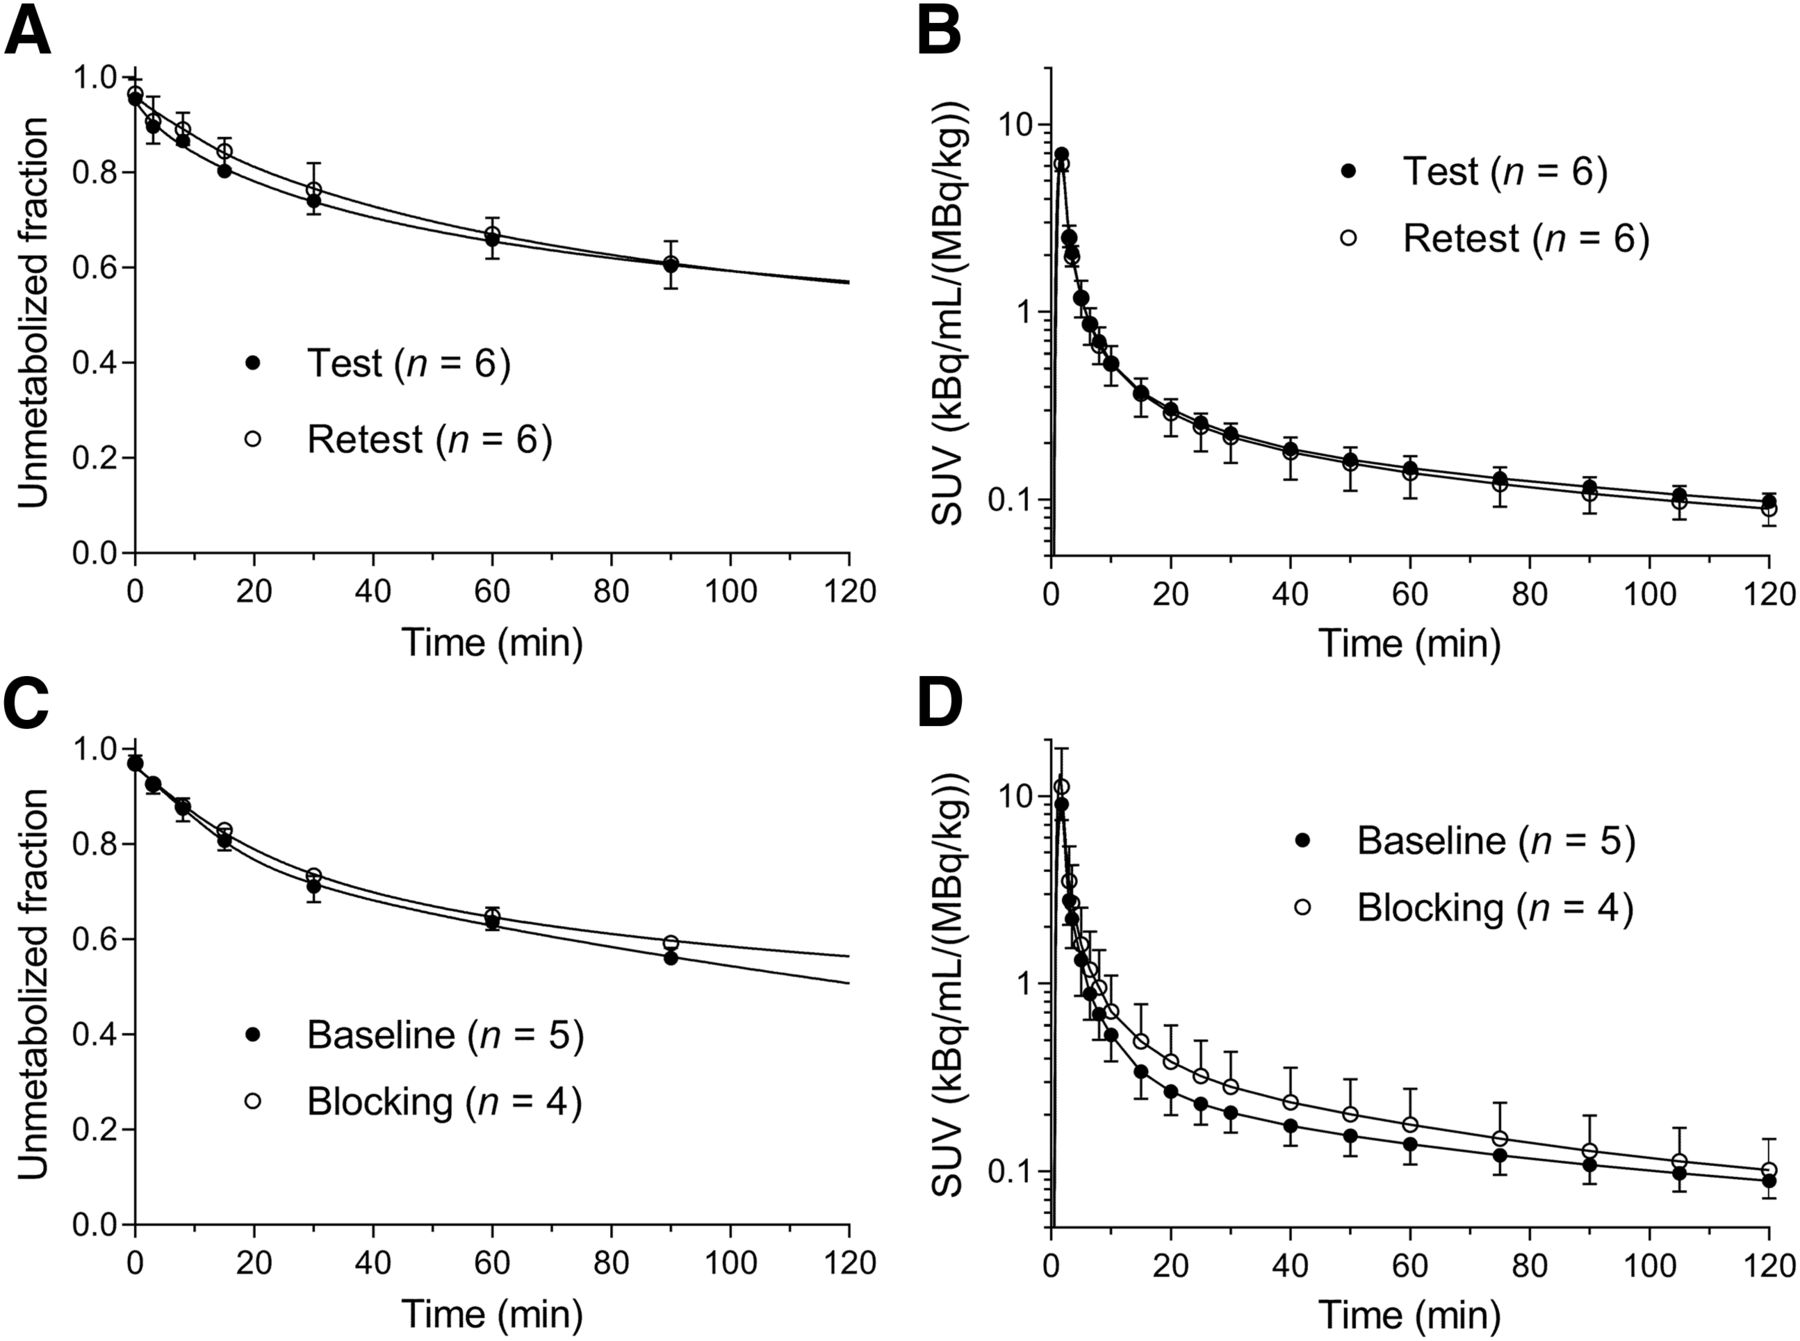
(A and B) Mean ± SD of plasma parent fraction (A) and metabolite-corrected input function (B) in test and retest scans of 11C-LSN3172176. (C and D) Plasma parent fraction (C) and metabolite-corrected input function (D) in baseline and blocking scans.
Brain Distribution and Kinetics
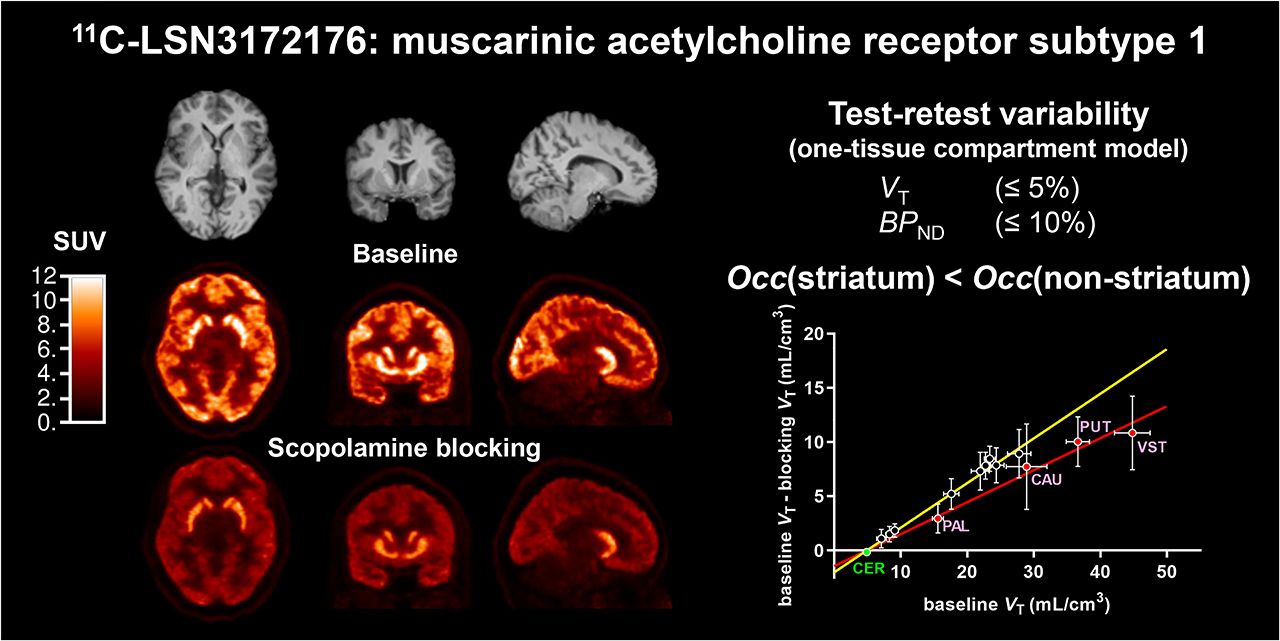
Figure 3 shows typical images of 11C-LSN3172176 in SUV units. The highest uptake was seen in the striatum (ventral striatum, putamen, and caudate), followed by the neocortex. The lowest uptake was in the cerebellum. Typical time–activity curves and fitted curves are shown in Figure 4. For baseline scans, peak SUV in cortical regions ranged from 5 to 9, peaking at later times for the regions with higher uptake. Regional time–activity curves fit well with all models:1TC, 2TC, SRTM, and SRTM2. The 2TC fitting of the time–activity curves was significantly better than the 1TC in 44% of the fits as assessed by the F test. Although the 2TC fits were statistically better overall, the individual parameters were often not reliably estimated because of numeric identifiability problems (relative SE of VT > 10%). When estimates were reliable, there was an excellent match between 2TC- and 1TC-derived VT [ ]. Given the quality of fits and comparison of VT with the 2TC estimates, the 1TC model was selected as the model of choice when the arterial input function is available. The 1TC K1 estimates (mL/min/cm3) ranged from 0.18 ± 0.03 (centrum semiovale) to 0.49 ± 0.12 (putamen). Estimates of 1TC VT without blood volume correction were very similar to those with correction [uncorrected VT = (0.99 × corrected VT) + 0.04, R2 = 1.00]. Mean regional VT across subjects in the test–retest study is shown in Table 2. VT was highest in the striatum, followed by the neocortical regions and white matter, and lowest in the cerebellum.

MR and coregistered typical PET images of 11C-LSN3172176 under test and retest conditions in one subject and under baseline and blocking conditions in another subject. PET images were summed from 30 to 60 min after injection.

Time–activity curves of 11C-LSN3172176 in baseline (A) and blocking (B) scans and fits with 1TC, 2TC, SRTM, and SRTM2. CER = cerebellum; FRO = frontal cortex; PUT = putamen; THA = thalamus.
Binding Parameters from Test–Retest Study of 11C-LSN3172176
Scopolamine Blocking
Tracer uptake was reduced by scopolamine administration (Fig. 3). The mean 1TC VT across subjects is shown in Table 3. The mean VT in all regions except the cerebellum was reduced by scopolamine. The mean cerebellum VT was similar between baseline and blocking scans (4% ± 11% difference, n = 4). Occupancy and VND are listed in Table 4, with the assumption of uniform occupancy across regions (1-occupancy model). Figure 5 shows the Lassen plot of VT averaged across subjects. Four regions (○) appear to belong to a different regression line than the other regions (•), with a lower slope. Thus, the assumption of uniform occupancy in all regions might not be adequate. Therefore, occupancy and VND were estimated assuming 2 occupancy groups—one for striatal regions and the other for nonstriatal regions—using a common VND (Table 4). The F test showed that the 2-occupancy model was significantly better than the 1-occupancy model (P < 0.001 for all subjects). VND was 5.22 ± 0.77 mL/cm3, which was extremely similar to the mean cerebellum VT (5.10 ± 0.54 mL/cm3, n = 5). As seen in Figure 5, the cerebellum point is located on the x-axis, thus showing no blockade by scopolamine and supporting use of the cerebellum VT as VND. Therefore, the cerebellum was selected as the reference region. The occupancies computed from percentage difference in BPND using 1TC and SRTM2 were at a level similar to those using the 2-occupancy model (Supplemental Table 1; supplemental materials are available at http://jnm.snmjournals.org).
Binding Parameters from Baseline-Blocking Study of 11C-LSN3172176
Occupancy by Scopolamine and VND 11C-LSN3172176
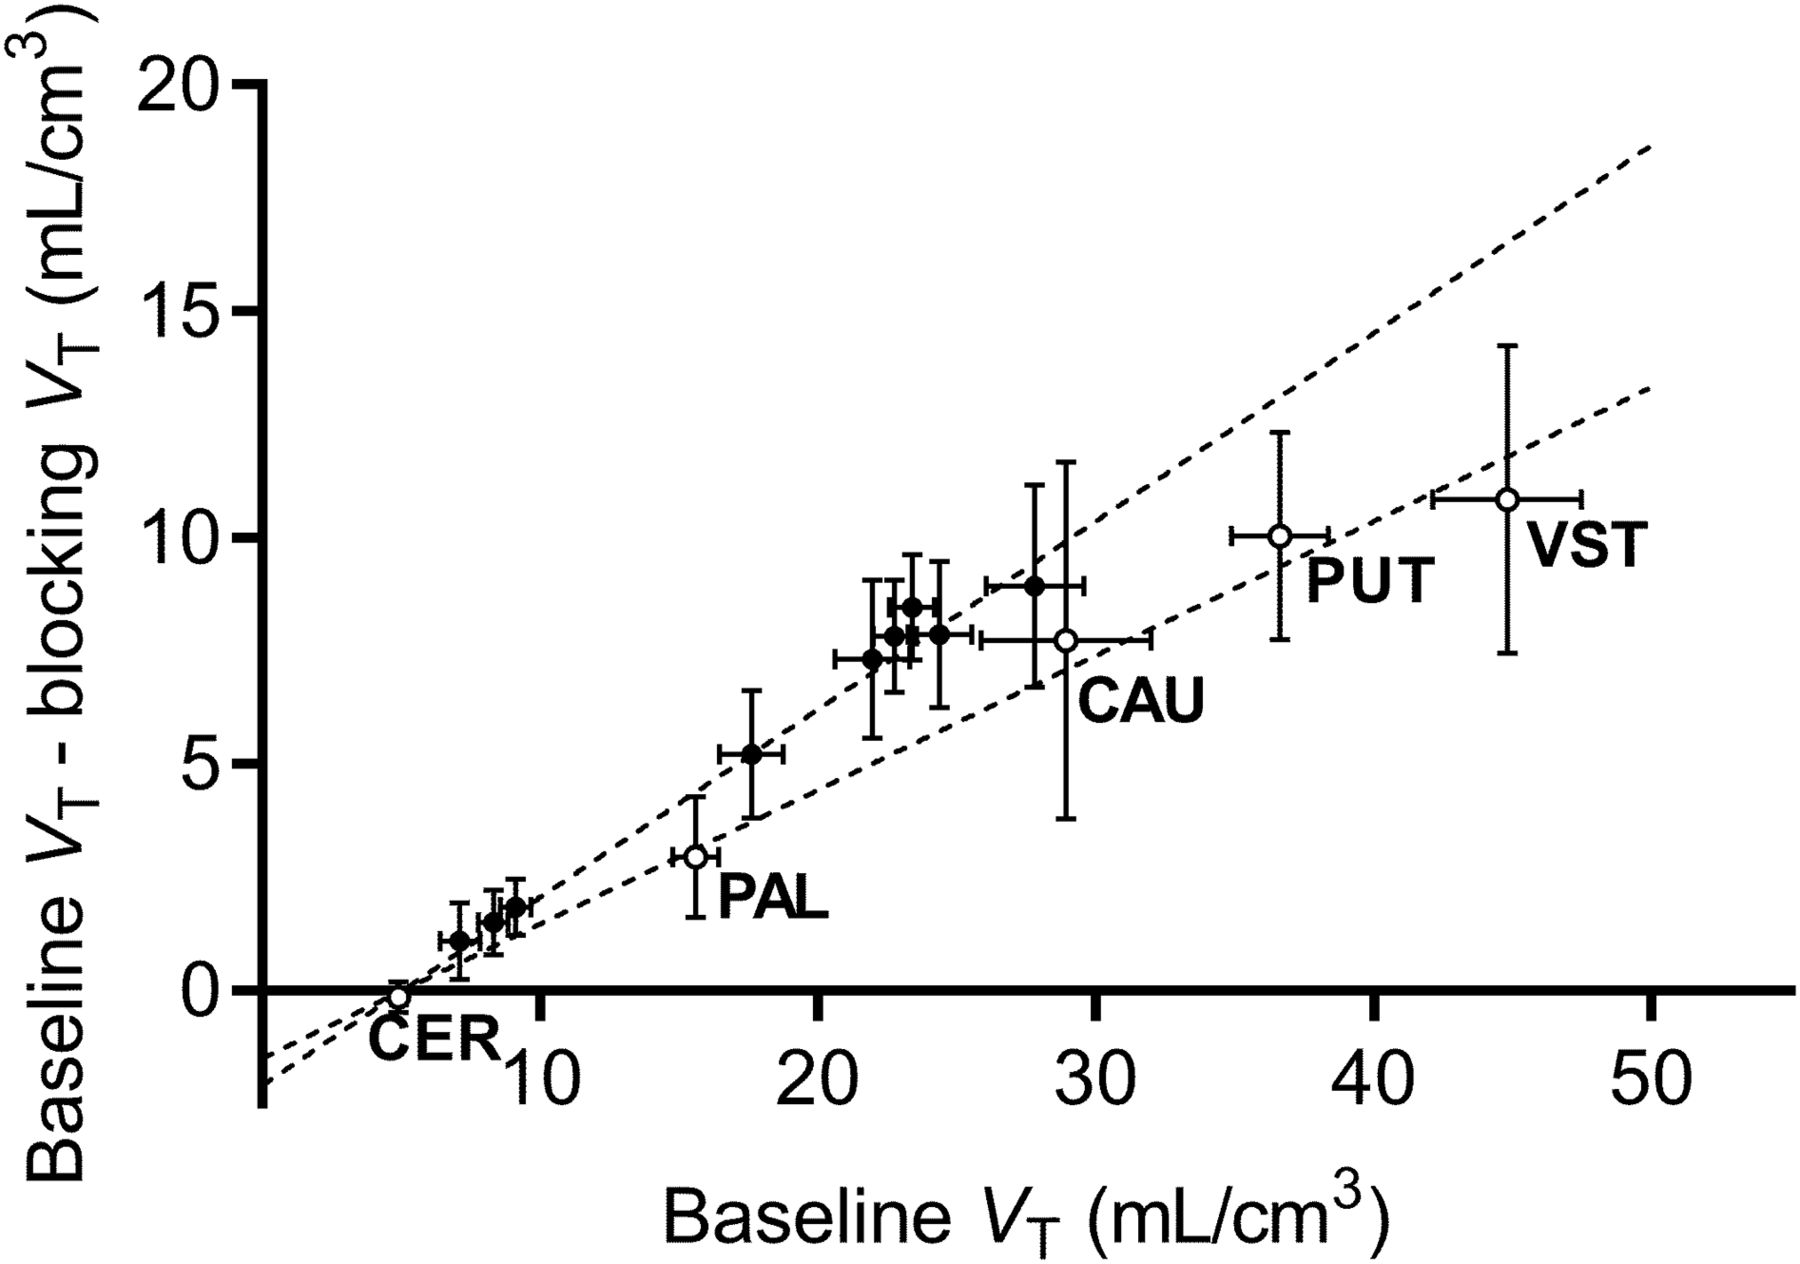
Lassen plot of mean regional 1TC VT of 11C-LSN3172176 (n = 4). Error bar shows SEM. Ventral striatum (VST), putamen (PUT), caudate (CAU), pallidum (PAL), and cerebellum (CER) are shown as open circles, and other regions are shown as closed circles.
Binding Potential
Shown in Table 2 is mean BPND calculated from the 1TC and SRTM2 models across subjects. BPND was first calculated using SRTM and correlated well with BPND from 1TC but was slightly underestimated [ ]. The estimated
  (1/min) ranged from 0.065 to 0.099, whereas the
  (1/min) in the cerebellum was 0.079 ± 0.002.
  matched well with
  in the cerebellum [
 ]. SRTM2 BPND matched better with the 1TC values:
  . Given the quality of fits (Fig. 4) and comparison of BPND with the 1TC estimates, SRTM2 is recommended as the best noninvasive model for quantitative analysis.
Minimum Scan Time and TRV of Binding Parameters
Listed in Table 2 are the minimum scan times required to achieve stable measurement of binding parameters for each region. In general, longer scan times were needed for regions with higher VT. Compared with the 1TC 120-min estimates, the minimum scan was 70 min for VT and 80 min for BPND.
Table 5 shows the test–retest statistics for VT and BPND. The TRV of VT was excellent: absolute TRV was no more than 5% in all regions and −2% for the global mean TRV. The absolute TRV of 1TC BPND was also good (≤10%), and the global mean TRV was 1%. SRTM2 BPND showed slightly higher absolute TRV and TRV than did 1TC BPND.
Test–Retest Reproducibility Parameters of 11C-LSN3172176
DISCUSSION
The primary aims of this study of the novel mAChR M1 PET tracer 11C-LSN3172176 were to determine an appropriate tracer kinetic model for quantitative analysis of imaging data, to assess the TRV of kinetic parameters, and to evaluate a suitable reference region for simplified analysis. 11C-LSN3172176 showed high uptake in the brain and produced images of high statistical quality. The pattern of the time–activity curves demonstrated reversible binding. All regional time–activity curves were described well using all kinetic models: 1TC, 2TC, SRTM, and SRTM2. On the basis of the F test, the 2TC model fitting was better than the 1TC model fitting; however, estimation of regional VT was not consistently reliable by the 2TC model. On the other hand, VT estimated by the 1TC model matched well with VT using the 2TC model. Therefore, the 1TC model was chosen as the best model for analysis of imaging data when input function data are available. The 1TC K1 in gray matter was 0.40 mL/cm3/min, suggesting good extraction of the tracer. The 1TC VT displayed a rank order consistent with the M1 distribution in the brain, that is, high in striatal regions and lowest in the cerebellum. Given the high VT, it was not surprising that a blood volume correction was not needed.
The 1TC VT in the cerebellum did not change between baseline and scopolamine blocking scans. Also, the estimated VND from occupancy estimation was close to the cerebellum VT. In view of these results and a postmortem study (26), the cerebellum was selected as a reference region satisfying the requirements to accurately compute binding potential.
For reference region models, SRTM and SRTM2 were evaluated for computation of BPND. The SRTM2-coupled fit led to an estimated  similar to the 1TC-estimated k2 in the cerebellum. SRTM2 BPND matched better with BPND from 1TC than did BPND from SRTM. Therefore, SRTM2 was selected as the best noninvasive model for quantitative analysis of 11C-LSN3172176 imaging data.
Test–retest reproducibility was excellent for both 1TC VT and 1TC BPND and was slightly poorer for SRTM2 BPND but still good. There is no published literature on the reproducibility of other M1 tracers for comparison. Compared with our previously published test–retest studies with various tracers, the test–retest reproducibility of 11C-LSN3172176 was similar to that of the synaptic vesicle 2A protein tracer 11C-UCB-J (27) and much better than those of other tracers, such as the κ-opioid receptor tracer 11C-LY2795050 (28) and the dopamine D2/D3 receptor tracer 11C-PHNO (29).
In the scopolamine blocking study, striatal and nonstriatal regions showed different occupancy levels in all subjects. This difference was visible in individual occupancy plots, and the 2-occupancy model was statistically better than the 1-occupancy model in all subjects. This result might be attributed to different endogenous acetylcholine concentrations between these regions. Drug occupancy is classically described as D/(1 + D + E), where D = [drug]/IC50 (drug) and E = [acetylcholine]/IC50 (acetylcholine). Concentration is denoted by [], and IC50 is half-maximal inhibitory concentration. Therefore, a higher endogenous acetylcholine concentration would lead to lower measured occupancy. Thus, the lower scopolamine occupancy in the striatal regions may be caused by higher endogenous acetylcholine concentrations. In the rat brain, acetylcholine exists abundantly in the caudate and putamen, in comparison with the cortical regions (30,31). Uptake of the vesicular acetylcholine transporter tracer 18F-fluoroethoxybenzovesamicol was 5–6 times higher in the striatum than in the cerebral cortices (32). These results suggest that in humans, acetylcholine concentrations are higher in striatal regions than in cortical regions. These differences in occupancy levels were observed because the occupancy by scopolamine was moderate (∼40%) in the present study. High occupancy (i.e., high scopolamine concentration) would diminish an effect by endogenous acetylcholine. Indeed, the effect of endogenous acetylcholine was undetectable during our preclinical characterization of 11C-LSN3172176 in rhesus macaques, in which an average occupancy of 98.6% was achieved by intravenous administration of a 50 μg/kg dose of scopolamine, without evidence of differential occupancy levels (15). However, the differences in regional occupancy levels might also be attributed to the regional differences in the magnitude of acetylcholine release induced by scopolamine. In rat studies (33,34), scopolamine increased acetylcholine release more in the frontal cortex (1,400% at peak) and hippocampus (1,200%) than in the striatum (400%). If a similar effect of scopolamine on acetylcholine occurs in human, the induced acetylcholine release also would lead to higher occupancy in the cortical than striatal regions. Therefore, the differential occupancy observed in the present study could be due to the combination of these 2 factors: high baseline endogenous acetylcholine levels in the striatum, and higher induced acetylcholine release in nonstriatal regions. Further experiments are needed to tease out these 2 factors.
Other possible causes for the differential occupancy by scopolamine are different levels of VND between striatal and nonstriatal regions and different proportions of binding to M1, M2, and M4 receptors. For the first possible cause, we compared occupancy models to describe the results from the scopolamine blocking study. The chosen model, 2 occupancies and 1 VND, was significantly better than the 1-occupancy and 1-VND model but not significantly different from the 2-occupancy and 2-VND model as judged by the F test. Further, the Akaike information criterion of the chosen model was smaller than the 1-occupancy and 2-VND model. These model comparison results support a single VND across all regions. For the next possible cause, scopolamine has similar affinity for M1 (1.1 nM), M2 (2.0 nM), and M4 (0.8 nM) receptors (35). Therefore, the spatial distribution of these subtypes is unlikely to affect the occupancy.
Finally, although LSN3172176 displayed high in vitro binding affinity for the M1 mAChR (Ki = 8.9 nM), it also had moderate affinities for M4 (Ki = 41.4 nM) and M2 (Ki = 63.8 nM). Preclinical studies on rodents have shown that the in vivo binding signal of 11C-LSN3172176 comes predominantly from M1. Nonetheless, it is possible that there are also small contributions from M4 and M2, especially in striatal regions where levels of M4 and M2 are relatively high (14). To date, a detailed mapping of the 5 mAChR subtypes in the human brain is not available. Assuming that the maximum density of binding sites of M2/M4 is about half that of M1 (36), up to 10% of 11C-LSN3172176 BPND might be contributed by its binding to M2/M4. Therefore, although 11C-LSN3172176 is fairly selective for the M1 mAChR, it is important to consider the contributions from its M2/M4 binding when interpreting the imaging data, especially in the striatal regions. Assessment of the exact contributions from M4 and M2 subtype binding will require future blocking studies with M4 and M2 selective compounds.
CONCLUSION
11C-LSN3172176, a new M1 mAChR PET tracer, displayed high brain uptake, heterogeneous distribution among brain regions, and appropriate kinetics. The 1TC and SRTM2 models were judged as the most suitable for describing the kinetics, and an 80-min scan time was sufficient to quantify regional VT and BPND. Excellent test–retest reproducibility was found for 1TC VT and BPND. From the blocking study, the cerebellum was considered a suitable reference region to compute BPND. On the basis of our results, 11C-LSN3172176 is an excellent PET ligand to quantify M1 mAChR in the human brain.
DISCLOSURE
This study was sponsored by Eli Lilly. Partial support was also provided by the NIH grant 1R01MH113557-01. Lawrence Slieker, Adam J. Schwarz, Nancy Kant, Cynthia Jesudason, Kevin Ruley, and Antonio Navarro were employees of Eli Lilly & Co. at the time of this study. This publication was also made possible by CTSA grant UL1 RR024139 jointly from the National Center for Research Resources (NCRR) and the National Center for Advancing Translational Sciences (NCATS), components of the National Institutes of Health (NIH). Its contents are solely the responsibility of the authors and do not necessarily represent the official view of NIH. No other potential conflict of interest relevant to this article was reported.
KEY POINTS
QUESTION: Does 11C-LSN3172176 show kinetic properties suitable for quantifying M1 mAChR in humans?
PERTINENT FINDINGS: 11C-LSN3172176 showed high brain uptake, favorable kinetics, high specific binding, and excellent test–retest reproducibility.
IMPLICATIONS FOR PATIENT CARE: The excellent kinetics of 11C-LSN3172176 will enable quantification of M1 receptors in the human brain.
Footnotes
Published online Aug. 28, 2020.
- © 2021 by the Society of Nuclear Medicine and Molecular Imaging.
REFERENCES
- Received for publication April 10, 2020.
- Accepted for publication July 9, 2020.


Jump to section
Related Articles
Cited By...
- Linking Brain Entropy to Molecular and Cellular Architecture in Psychosis
- Connectome-based brain fingerprints predict early cognitive decline in Parkinsons patients with minor hallucinations
- An engine for systematic discovery of cause-effect relationships between brain structure and function
- Geometric influences on the regional organization of the mammalian brain
- Brain maps of general cognitive function and spatial correlations with neurobiological cortical profiles
- Mapping the Microstructure of Human Cerebral Cortex In Vivo with Diffusion MRI
- Mapping neuropeptide signaling in the human brain
- A replicable and generalizable neuroimaging-based indicator of pain sensitivity across individuals
- Concurrent assessment of neurometabolism and brain hemodynamics to comprehensively characterize the functional brain response to psychotropic drugs: an S-ketamine study
- Benchmarking methods for mapping functional connectivity in the brain
- Controlling the human connectome with spatially diffuse input signals
- Integrating brainstem and cortical functional architectures
- The biological role of local and global fMRI BOLD signal variability in human brain organization
- Resting state changes in aging and Parkinsons disease are shaped by underlying neurotransmission - a normative modeling study
- Transitions between cognitive topographies: contributions of network structure, neuromodulation, and disease
- Multimodal, multiscale connectivity blueprints of the cerebral cortex
- Whole-brain modeling explains the context-dependent effects of cholinergic neuromodulation
- PET Imaging of Cholinergic Neurotransmission in Neurodegenerative Disorders
- Molecular and connectomic vulnerability shape cross-disorder cortical abnormalities
- Mapping neurotransmitter systems to the structural and functional organization of the human neocortex
- neuromaps: structural and functional interpretation of brain maps
- Correspondence between gene expression and neurotransmitter receptor and transporter density in the human brain