


Visual Abstract

Abstract
Arginine vasopressin is a hormone that is synthesized mainly in the hypothalamus and stored in the posterior pituitary. Receptors for vasopressin are categorized into at least 3 subtypes (V1A, V1B, and V2). Among these subtypes, the V1B receptor (V1BR), highly expressed in the pituitary, is a primary regulator of hypothalamic-pituitary-adrenal axis activity and thus a potential target for treatment of neuropsychiatric disorders such as depression and anxiety. N-tert-butyl-2-[2-(6-methoxypyridine-2-yl)-6-[3-(morpholin-4-yl)propoxy]-4-oxopyrido[2,3-d]pyrimidin-3(4H)-yl]acetamide (TASP699) is a novel PET radiotracer with high affinity and selectivity for V1BR. The purpose of this study was to characterize the pharmacokinetic and binding profiles of 11C-TASP699 in humans and determine its utility in an occupancy study of a novel V1BR antagonist, TS-121. Methods: Six healthy subjects were scanned twice with 11C-TASP699 to determine the most appropriate kinetic model for analysis of imaging data and test–retest reproducibility of outcome measures. Nine healthy subjects were scanned before and after administration of TS-121 (active component: THY1773) to assess V1BR occupancy. Metabolite-corrected arterial input functions were obtained. Pituitary time–activity curves were analyzed with 1- and 2-tissue-compartment (1TC and 2TC, respectively) models and multilinear analysis 1 (MA1) to calculate distribution volume (VT). Relative test–retest variability (TRV) and absolute TRV were calculated. Since no brain region could be used as a reference region, percentage change in VT after TS-121 administration was computed to assess its receptor occupancy and correlate with plasma concentrations of the drug. Results: 11C-TASP699 showed high uptake in the pituitary and no uptake in any brain region. The 2TC model provided better fits than the 1TC model. Because the MA1 VT estimates were similar to the 2TC VT estimates, MA1 was the model of choice. The TRV of VT was good (TRV, −2% ± 14%; absolute TRV, 11%). THY1773 reduced VT in a dose-dependent fashion, with a half-maximal inhibitory concentration of 177 ± 52 ng/mL in plasma concentration. There were no adverse events resulting in discontinuation from the study. Conclusion: 11C-TASP699 was shown to display appropriate kinetics in humans, with substantial specific binding and good reproducibility of VT. Therefore, this tracer is suitable for measurement of V1BR in the human pituitary and the V1BR occupancy of TS-121, a novel V1BR antagonist.
Arginine vasopressin (AVP) is a key regulator of the hypothalamic-pituitary-adrenal axis. In response to stress exposure, AVP potentiates the effects of corticotropin-releasing factor on adrenocorticotropin release from pituitary corticotrophs (1). Among the 3 vasopressin receptor subtypes (V1A, V1B, and V2), the V1B receptor (V1BR), which is expressed abundantly in the anterior pituitary (2), mediates the pituitary actions of AVP and regulates hypothalamic-pituitary-adrenal axis activity (3).
Several clinical studies have reported on the role of AVP in stress-related disorders. For example, AVP plasma levels were elevated in patients with major depressive disorder in comparison with healthy controls (4) and in depression with anxiety and slowed psychomotor activity (5). Cerebrospinal fluid AVP levels significantly decreased in patients who have major depressive disorder treated with the antidepressant fluoxetine, which is accompanied by a decrease in depression scores (6). In general, hyperactivity of the hypothalamic-pituitary-adrenal axis is a common finding in depression (7,8) and is thus a target of antidepressant treatment. These findings suggest that V1BR antagonists may be indicated in the treatment of major depressive disorder via reducing hypothalamic-pituitary-adrenal axis activity (9,10).
Development of V1BR imaging agents for PET will permit the in vivo characterization of this receptor subtype in humans, as well as accurate quantification of target engagement by drug candidates. To date, such development has been hampered by a lack of selective V1BR ligands. A nonpeptide V1BR antagonist, 11C-SSR149415, was evaluated in nonhuman primates and shown to have minimal uptake in the brain and high uptake in the pituitary (11). However, human imaging of 11C-SSR149415 has not been reported. More recently, a novel pyridopyrimidin-4-one analog, N-tert-butyl-2-[2-(6-methoxypyridine-2-yl)-6-[3-(morpholin-4-yl)propoxy]-4-oxopyrido[2,3-d]pyrimidin-3(4H)-yl]acetamide (TASP699), was identified as a V1BR antagonist with high affinity and selectivity for V1BR (V1B, 0.16 nM; 87 other off-target molecules including V1A, V2, and oxytocin receptors, >1 μM) (12). The 11C-labeled ligand 11C-TASP699 was then developed as a PET radiotracer and shown to have high uptake in the monkey pituitary. Further, the pituitary uptake was dose-dependently inhibited by pretreatment with TASP0390325 (12), a selective V1BR antagonist that has been well characterized in pharmacologic studies (13), thus demonstrating the V1BR binding specificity of 11C-TASP699.
The aim of this first-in-humans PET study was to evaluate the tracer 11C-TASP699 for measurement of V1BR availability, in order to assess the reproducibility of binding parameters. An open-label, single-dose study was also done to determine the target occupancy of a novel V1BR antagonist TS-121 (14) in the pituitary and to evaluate the relationship between plasma exposure of THY1773 (active component of TS-121) and receptor occupancy.
MATERIALS AND METHODS
Human Subjects
This was a 2-part study: test–retest and receptor occupancy. Fifteen healthy men were enrolled (test–retest: n = 6, 37–50 y old, body weight of 88 ± 11 kg; occupancy: n = 9, 32–52 y old, body weight of 80 ± 10 kg). Individuals were excluded if they had a diagnosis of a current or lifetime psychiatric disorder, a diagnosis of a current or past serious medical or neurologic illness, metal in the body that would result in an MRI contraindication, or a history of substance abuse or dependence. PET imaging experiments were conducted under a protocol approved by the Yale University School of Medicine Human Investigation Committee and the Yale–New Haven Hospital Radiation Safety Committee and were in accordance with U.S. federal guidelines and regulations for the protection of human research subjects (title 45, part 46, of the Code of Federal Regulations). Written informed consent was obtained from all subjects. MR images were acquired on all subjects to verify the absence of brain structural abnormalities. MRI was performed on a 3-T whole-body scanner (Trio; Siemens Medical Systems). The dimensions and pixel size of MR images were 256 × 256 × 176 voxels and 0.98 × 0.98 × 1.0 mm3, respectively.
Safety assessments included monitoring of adverse events and serious adverse events, routine hematology, biochemistry and urinalysis testing, physical and neurologic examinations, vital signs and electrocardiograms, concomitant medications, and extent of exposure (11C-TASP699 exposure in terms of radioactivity [MBq] per kilogram of body weight and total radioactivity, and, for part 2, extent of exposure to TS-121 in terms of milligrams of drug per kilogram of body weight at admission).
Radiotracer Synthesis
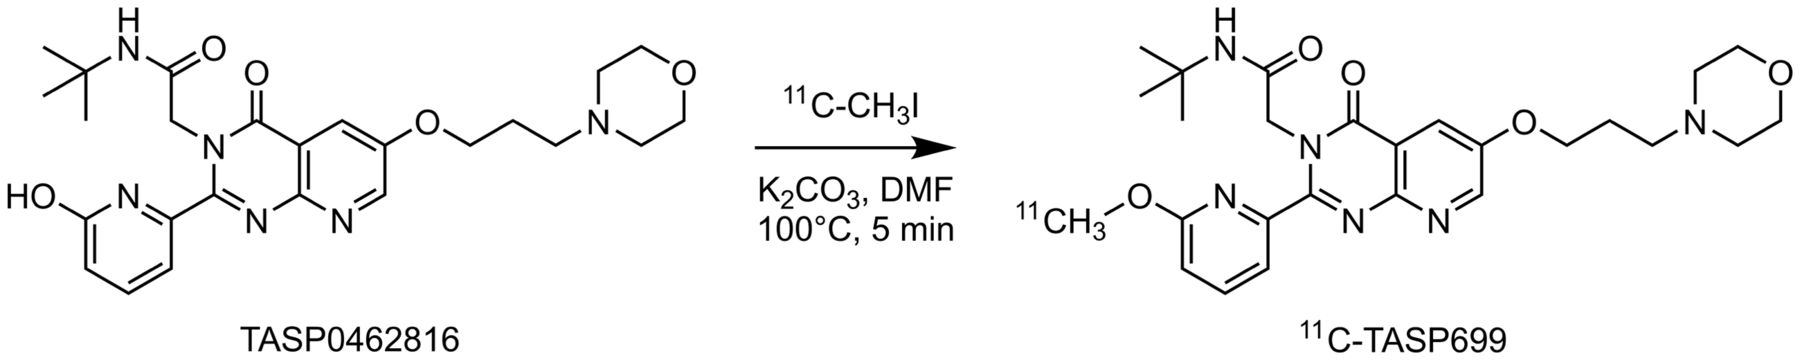
11C-TASP699 (Fig. 1) was radiolabeled with 11C-CH3I as reported previously (12). The PET drug was purified by high-performance liquid chromatography (Luna C18(2) [Phenomenex], 10 μm, 10 × 250 mm, 25% acetonitrile/75% 0.1 M ammonium formate with 0.5% acetic acid, pH 4.2, at 5 mL/min and 254 nm), isolated by solid-phase extraction, and formulated in 10 mL of saline containing 1 mL of ethanol. The detailed radiosynthesis procedure is described in the supplemental materials (available at http://jnm.snmjournals.org).

Synthesis of 11C-TASP699. DMF = dimethylformamide.
PET Imaging Experiments
Six subjects underwent two 2-h 11C-TASP699 PET scans on a single day to measure the reproducibility of the binding parameters in part 1 of the study. The start of the 2 scans were separated by 5.3 ± 0.7 h. In part 2 of the study, 9 subjects completed three 90-min PET scans (baseline, postdose 1, and postdose 2) to assess V1BR occupancy in the pituitary after a single oral administration of TS-121. The TS-121 dose was adaptively determined (3 mg, n = 1; 10 mg, n = 3; 30 mg, n = 2; 50 mg, n = 3). Postdose 1 scans were acquired 2.3 h after the dose of TS-121, and postdose 2 scans were acquired 1 or 2 d after the dose of TS-121 (3 mg, 2 d; 10 mg, 1 d; 30 mg, 2 d; 50 mg, 1 d [n = 2] and 2 d [n = 1]). The concentrations of THY1773 in plasma at pre-, mid-, and postscanning were determined by liquid chromatography and tandem mass spectrometry at CMIC, Inc., on behalf of Taisho Pharmaceutical Co., Ltd. The measured concentrations were averaged and used as the mean plasma exposure for each postdose scan.
All PET scans were conducted on a High Resolution Research Tomograph (Siemens Medical Solutions), which acquires 207 slices (1.2-mm slice separation) with a reconstructed image resolution of about 3 mm in full width at half maximum. After a 6-min transmission scan for attenuation correction, PET scans were acquired in list mode after intravenous administration of 11C-TASP699 over 1 min by an automatic pump (Harvard PHD 22/2000; Harvard Apparatus). Dynamic scan data were reconstructed in 33 (test–retest) or 27 (occupancy) frames (6 × 0.5 min, 3 × 1 min, 2 × 2 min, 22 or 16 × 5 min) with corrections for attenuation, normalization, scatter, randoms, and dead time using the MOLAR algorithm (15). Event-by-event motion correction (16) was included in the reconstruction on the basis of measurements with the Polaris Vicra sensor (NDI Systems) with reflectors mounted on a swim cap worn by the subject.
In 4 scans, the Vicra motion-tracking signal was unstable or lost because of slippage of the cap. In these cases, head motion was estimated by registration of the emission images reconstructed without attenuation or scatter corrections, and then dynamic PET images were reconstructed using the estimated motion. For 4 other scans, slight residual motion was visible; each image frame was therefore aligned to the early average image from 0 to 10 min after injection.
Input Function Measurement
Arterial input functions were generated for all scans. Discrete blood samples were manually drawn every 10 s from 10 to 90 s, every 15 s from 90 s to 3 min, and then at 3.5, 5, 6.5, 8, 12, 15, 20, 25, 30, 45, 60, 75, 90, 105, and 120 min. In addition to samples for the whole-blood and plasma radioactivity curves, arterial blood samples were drawn to determine the unmetabolized fraction of tracer at 3, 8, 15, 30, 60, and 90 min for test–retest scans and at 5, 15, 30, 60, and 90 min for occupancy scans. Radiometabolite analysis was performed using the column-switching high-performance liquid chromatography method (17). Briefly, plasma was separated from the whole blood by centrifugation. Up to 5 mL of filtered plasma samples treated with urea (8 M) were injected into the automatic column-switching system equipped with a capture column (19 × 4.6 mm) packed with Phenomenex SPE Strata-X sorbent and a Luna C18(2) analytic column (5 μm, 4.6 × 250 mm) eluting with 1% acetonitrile in water at a flow rate of 2 mL/min for the first 4 min and then with a mobile phase of 31% acetonitrile and 69% 0.1 M ammonium formate (v/v) at 1.85 mL/min. The unmetabolized parent fraction was determined as the ratio of the sum of radioactivity in fractions containing the parent compound (retention time of ∼10.5 min) to the total radioactivity collected and was fitted with an inverted γ-function.
For 1 baseline scan, reliable metabolite data were not available; the parent fraction curve at the postdose 2 study was therefore used to calculate a metabolite-corrected input function. For 1 postdose 2 scan, arterial blood samples were not available; the input function from the baseline scan was therefore scaled using the ratio of the injected doses between the 2 scans.
An ultrafiltration-based method was used to measure the unbound portion (free fraction) of 11C-TASP699 in plasma (18).
Quantitative Analysis
Analysis was performed directly on the PET images. A pituitary region of interest (ROI) was determined as the 400 voxels (730 mm3) with the highest values on the SUV image (test–retest scans, 10–120 min; occupancy scans, 10–90 min), and a pituitary time–activity curve was generated. The ROI was chosen to be larger than the pituitary size to reduce variability across frames. The regional distribution volume (VT) was computed using 1-tissue- and 2-tissue-compartment (1TC and 2TC, respectively) models and the multilinear analysis 1 (MA1) method. The effect of inclusion of a blood volume term was also assessed. The F test was used to compare model fits. Data points were weighted on the basis of noise-equivalent counts in each frame. Percentage SE was estimated from the theoretic parameter covariance matrix.
The mean and SD of the test–retest variability (TRV) was calculated as follows: Eq. 1Mean TRV is an index of trend in VT values between test and retest scans, and the SD of TRV is an index of the variability of the percentage difference between the 2 measurements. The absolute value of TRV, which combines these 2 effects into a single value, was also computed.
The time stability of pituitary VT values was assessed by comparing VT values from scans shortened from 110 to 50 min with VT values from 120-min scans in the test–retest dataset. Two criteria were used to determine a minimum scan duration (19): the average of the ratio was between 0.95 and 1.05, and the interindividual SD of the ratio was less than 0.1.
For the occupancy study, the fractional difference, that is, apparent receptor occupancy (aRO), between baseline and postdose VT values was computed using the following formula, which also shows the physiologic interpretation of aRO: Eq. 2VND is the nondisplaceable volume of distribution, BPND is the pituitary binding potential with respect to the nondisplaceable pool, and RO is the true receptor occupancy. Since aRO is proportional to RO, the half-maximal inhibitory concentration (IC50) of THY1773 can be estimated with the following formula using the plasma concentration and aRO:
 Eq. 3where aROmax is the maximum possible value of aRO [BPND/(1 + BPND)] and C is the THY1773 plasma concentration during each scan.
All modeling was performed with in-house programs using IDL 8.0 (ITT Visual Information Solutions).
RESULTS
Radiochemistry
11C-TASP699 was prepared in 24% ± 6% radiochemical yield based on trapped 11C-CH3I (range, 7.3%–44.1% for n = 41, decay-corrected to the end of bombardment). At the end of synthesis, the radiochemical and chemical purities were 97% ± 2% and 99% ± 7%, respectively, and the molar activity was 1,017.1 ± 465.0 GBq/μmol (173.5–1910 GBq/μmol). The average synthesis time was 46 ± 2 min.
Injection Parameters and Plasma Analysis
Table 1 lists the injected radioactivity dose, molar activity at time of injection, injected mass, and plasma free fractions. There were no significant differences between test and retest scans or between baseline and postdose scans. The administered activity of 11C-TASP699 was 569 ± 169 MBq (range, 301–756 MBq) for the test–retest study and 533 ± 118 MBq (range, 312–707 MBq) for the occupancy study. There were no adverse or clinically detectable pharmacologic effects by the administered radiotracer in any subject. No significant changes in vital signs or the results of laboratory studies were observed.
PET Scan Parameters
Figure 2 shows the mean (±SD) of parent fractions and metabolite-corrected plasma curves. In part 1, the mean parent fractions at 30 min were 71% ± 7% for the test scans (n = 6) and 69% ± 6% for the retest scans (n = 6), and in part 2, the mean parent fractions at 30 min were 70% ± 3% for the baseline scans, 69% ± 3% for postdose scan 1, and 69% ± 6% for postdose scan 2. The free fraction of 11C-TASP699 in plasma was 48% ± 6% (n = 12) for the test–retest scans, 50% ± 7% (n = 9) for the baseline scans, 51% ± 5% (n = 9) for postdose scan 1, and 52% ± 6% (n = 9) for postdose scan 2. The free fraction displayed no difference between test and retest scans or between baseline and postdose scans.

Mean ± SD of total plasma activity and parent fraction in plasma in test and retest scans (A and C) and in baseline, postdose 1, and postdose 2 scans (B and D).
Modeling Results
High uptake of 11C-TASP699 was reliably seen in the pituitary, with no substantial uptake in brain regions such as the choroid plexus and pineal gland (Fig. 3B). Pituitary regional time–activity curves for 11C-TASP699 (Fig. 4) showed peak uptake at approximately 10–30 min after injection followed by gradual clearance. Typical examples of fits are shown in Figure 4A. The pituitary time–activity curve was fitted well with the 2TC and MA1 models, and the F test showed that 2TC fitting was better than the 1TC model (P < 0.05 in 11 of 12 fits). However, the 2TC model provided unstable VT estimation (relative SE > 10%) and physiologically implausible microparameters (relative SE of K1 and k2 > 100%). The mean pituitary K1 from 1TC was 0.10 ± 0.02 mL/cm3/min. 1TC VT was somewhat underestimated compared with the reliable 2TC values but correlated well with 2TC VT estimates ( ). MA1 VT estimates were similar to those from 2TC with a good correlation (
 ). Since the MA1 method provided reliable VT estimates (relative SE < 10%) similar to those from 2TC, the MA1 VT values were used in the following analysis.

Typical MR (A) and coregistered PET images summed from 30 to 120 min after injection of 11C-TASP699. Coregistration (rigid transform) was applied using extracranial uptake (blue or purple area).

(A) Representative pituitary time–activity curve in baseline scan with 1TC (dashed), 2TC (dotted), and MA1 (t* = 10 min, solid) fits with brain time–activity curve. (B) Pituitary time–activity curves in baseline, postdose 1, and postdose 2 conditions with MA1 fits.
MA1 VT values showed large intersubject variability, ranging from 3.6 to 9.7 mL/cm3 (n = 19; test, retest, and baseline scans), and approximately 15 mL/cm3 for 1 subject, which may have been caused in part by the ROI definition. Note, however, that the TRV and absolute TRV were reasonably good (TRV, −2% ± 14%; absolute TRV, 11%; intraclass correlation coefficient, 0.94) (Fig. 5A), indicating good reliability of the measurements from repeated scans. The VT estimates for all models did not change with the inclusion of 2 additional parameters: a blood volume term and the time delay between the blood sampling site and pituitary. The percentage differences were 3% ± 3% for 1TC, 4% ± 3% for 2TC, and 0% ± 2% for MA1. Many 2TC VT values were unstable with the addition of delay and blood volume parameters (8/20 fits), and these values were excluded from this comparison. Pituitary blood volume was estimated to be about 20%. The minimum scan time for stable MA1 VT estimates was 90 min. The percentage difference in VT with respect to 120-min estimate was −6% ± 13%, −2% ± 16%, 1% ± 14%, 1% ± 9%, 0% ± 6%, and 0% ± 3% for the 60-, 70-, 80-, 90-, 100-, and 110-min scans.

(A) Pituitary VT values in test and retest conditions. Each symbol corresponds to a subject. (B) Mean percentage difference in VT in comparison with baseline VT values (aRO) at 2 h, 1 d, and 2 d after administration of TS-121.
Occupancy Results
Figure 4B shows a set of pituitary time–activity curves from the baseline and postdose scans after a 10-mg dose of TS-121. A moderate blocking effect was observed in the pituitary region. Figure 5B summarizes the percentage reductions in VT in the pituitary using MA1, whereas Figure 6 shows a plot of the percentage change in VT with THY1773 concentration in the plasma. The THY1773 plasma concentration over time is shown in Supplemental Figure 1. Using Equation 3, the IC50 (mean ± SE) was estimated at 177 ± 52 ng/mL, with an aROmax of 62% ± 7%. Using the estimated aROmax and Equation 2, the pituitary binding potential (BPND), representing the equilibrium ratio of specific to nondisplaceable binding, was calculated to be 1.6. Using the estimated aROmax, percentage change in VT was converted to RO, shown as the y-axis on the right of Figure 6.

Relationship between THY1773 plasma concentrations and percentage change in VT (left y-axis) and receptor occupancy (right y-axis). Estimated IC50 and aROmax are 177 ± 52 ng/mL and 62% ± 7%, respectively. Solid symbols and open symbols denote postdose 1 and postdose 2, respectively.
In fitting PET-measured occupancy values, it is typically assumed that the plasma drug levels are an accurate reflection of the drug levels in the tissue. This assumption may not be met at early times, depending on how rapidly the drug enters the tissue (20). We thus assessed whether the occupancy values at all times were consistent by using the F test to compare regression curve fits of Equation 3. The null hypothesis was that 1 set of model parameters was appropriate for all postdose scans. The alternative hypothesis was that a different curve was needed for the postdose scan 1 data versus the postdose scan 2 data, because of potential hysteresis. The null hypothesis was not rejected (P = 0.29). Therefore, hysteresis was not considered in the estimation. However, the ability to detect hysteresis may be limited since the data points for postdose 1 and postdose 2 scans were centered on different concentrations of the curve.
Safety
Overall, no safety issues were identified that would prevent further development and testing of either the investigational radiotracer 11C-TASP699 or the investigational drug TS-121.
No adverse events or serious adverse events resulting in discontinuation from the study (pain or burning at or arterial line or injection site was the most common adverse event, occurring in 3 subjects). No apparent safety trends in clinical laboratory results, vital sign measurements, electrocardiogram results, or physical and neurologic examinations were observed.
DISCUSSION
This first-in-humans PET study was conducted to assess the ability of a novel V1BR antagonist PET radiotracer, 11C-TASP699, to image V1BR in the human pituitary. Modeling methods were evaluated on the basis of time–activity curves and metabolite-corrected input functions. The volume of distribution was determined and used to estimate receptor occupancy by the V1BR antagonist, TS-121. A clear relationship between plasma concentration of the drug and receptor occupancy was found.
Modeling analysis assumes that only parent compound enters tissue and binds to the receptor. However, radiolabeled metabolites are likely to access the pituitary, since it has no blood–brain barrier. If the magnitude of the metabolite effect is large, it may bias the results. This does not seem to have been the case in the current study, since, first, VT did not show a continuous increase with scan time, as would be expected from tissue uptake of metabolites, and second, the metabolite fraction in plasma was moderate. In addition, since the fraction of metabolites was similar in the baseline and postdose scans, even if radiolabeled metabolites were present and were incorrectly increasing the estimated VT values, the IC50 estimates would likely not be affected although the aROmax could be biased.
Large intersubject variability was seen in VT (4–10 mL/cm3), although the test–retest reproducibility was good (absolute TRV, 11%). We evaluated whether there was a relationship between VT estimates at baseline scans and subject age, weight, body mass index, scan starting time, and injected mass, but we found no significant effects. VT might be affected by the pituitary volume itself, since it varies by age, sex, season, and subject conditions (21–23). However, we were not able to accurately define pituitary volumes from MR images since separation of the pituitary from neighboring tissues was challenging in many cases. Thus, we used a standard ROI size. Mean pituitary volume in healthy men is 500 ± 79 mm3 (22), and a larger ROI (730 mm3) was used to ensure that all uptake was included. To further consider this factor, the effect of ROI size on VT values was evaluated. As expected, VT values increased with smaller ROI sizes because of a reduced partial-volume effect. A near-identical TRV was found for ROIs above 500 mm3 (TRV, −3% ± 15% with 550 mm3 and −2% ± 13% with 910 mm3). Thus, the large intersubject variability in V1BR could have some biologic meaning. There have been several studies using immunohistochemistry, reverse-transcription polymerase chain reaction, and in situ hybridization histochemistry to investigate V1BR distribution in rodents. However, to the best of our knowledge, there are no quantitative postmortem studies in humans or nonhuman primates.
For the 2 subjects for whom plasma or metabolite data were not available from one scan, the data from another scan were used to generate the input function. We evaluated the effect of using these data from other scans in the subjects for whom all data were available. Percentage differences in VT were 1% ± 8% (plasma) and 0% ± 4% (metabolites).
Using 11C-TASP699, we evaluated the V1BR occupancy of TS-121, a drug candidate targeted for major depressive disorder. On the basis of animal model experience with THY1773, attenuated hyperactivity of the hypothalamic-pituitary-adrenal axis and antidepressantlike effects were found with more than 50% pituitary V1BR occupancy. This study showed that 10–50 mg of TS-121 achieved more than 50% occupancy at 2 h after a single oral administration in healthy men (Fig. 6). A phase 2 clinical trial using TS-121 (14) in patients with major depressive disorder showed reductions in the Montgomery-Asberg Depression Rating Scale score for subjects who had a daily oral TS-121 dose of 10 or 50 mg at week 6, though these reductions did not achieve statistical significance. If the plasma concentration was similar in both groups (patients with major depressive disorder with daily dosing, and our healthy subjects with a single administration), the dose of 10–50 mg should have been sufficient. However, plasma concentration may differ between patients and healthy subjects, as was seen in a glycine transporter-1 inhibitor study (24) in which the IC50 was similar between healthy controls and schizophrenic patients but the ID50 values were significantly different.
CONCLUSION
The novel V1BR antagonist tracer 11C-TASP699 showed high uptake in the pituitary but did not enter the brain. Its tracer kinetics could be modeled using MA1 to quantify VT values. VT values were variable between subjects but showed good test–retest reproducibility. 11C-TASP699 was successfully used in an occupancy study, which showed a consistent relationship between THY1773 (active component of TS-121) plasma concentration and V1BR occupancy. Single oral doses of TS-121 (3, 10, 30, and 50 mg) were found to be safe and well tolerated.
DISCLOSURE
This study was funded by Taisho Pharmaceutical R&D Inc. Izumi Nishino is a full-time employee of Taisho Pharmaceutical Co., Ltd. Satoshi Ozaki and Helene Sabia are a full-time employees of Taisho Pharmaceutical R&D Inc. Ming-Rong Zhang and Tetsuya Suhara hold a patent for 11C-TASP699 (Japan patent JP2015-1206 44A). No other potential conflict of interest relevant to this article was reported.
KEY POINTS
QUESTION: Does 11C-TASP699 show suitable kinetic properties to quantify pituitary V1BR in humans?
PERTINENT FINDINGS: The novel V1BR antagonist tracer 11C-TASP699 showed a good test–retest reproducibility. The tracer showed high uptake in the pituitary but did not enter the brain. The occupancy of TS-121 increased in a dose-dependent fashion (IC50 was 177 ng/mL as THY1773).
IMPLICATIONS FOR PATIENT CARE: 11C-TASP699 provides excellent measurements of V1BR binding in the human pituitary.
ACKNOWLEDGMENTS
The clinical trial registration identifier of this study is NCT02448212. We appreciate the excellent technical assistance of the staff at the Yale University PET Center. We thank Dr. Shigeyuki Chaki for reviewing this manuscript.
Footnotes
Published online August 12, 2021.
- © 2022 by the Society of Nuclear Medicine and Molecular Imaging.
REFERENCES
- Received for publication April 19, 2021.
- Revision received July 15, 2021.
In this issue


Jump to section
Related Articles
Cited By...
- No citing articles found.