


Abstract
Dose assessment to active bone marrow is a critical feature of radionuclide therapy treatment planning. Skeletal dosimetry models currently used to assign radionuclide S values for clinical marrow dose assessment are based on bone and marrow cavity chord-length distributions. Accordingly, these models cannot explicitly consider energy loss to inactive marrow (adipose tissue) during particle transport across the trabecular marrow space (TMS). One method to account for this energy loss is to uniformly scale the resulting TMS absorbed fractions by reference values of site-specific marrow cellularity. In doing so, however, the resulting absorbed fractions for self-irradiation of the trabecular active marrow (TAM) do not converge to unity at low electron source energies. This study attempts to address this issue by using nuclear magnetic resonance microscopy images of trabecular bone to define 3-dimensional (3D) dosimetric models in which explicit spatial distributions of adipose tissue are introduced. Methods: Cadaveric sources of trabecular bone were taken from both the femoral heads and humeral epiphyses of a 51-y-old male subject. The bone sites were sectioned and subsequently imaged at a proton resonance frequency of 200 MHz (4.7 T) using a 3D spin-echo pulse sequence. After image segmentation, voxel clusters of adipocytes were inserted interior to the marrow cavities of the binary images, which were then coupled to the EGS4 radiation transport code for simulation of active marrow electron sources. Results: Absorbed fractions for self-irradiation of the TAM were tabulated for both skeletal sites. Substantial variations in the absorbed fraction to active marrow are seen with changes in marrow cellularity, particularly in the energy range of 100–500 keV. These variations are seen to be more dramatic in the humeral epiphysis (larger marrow volume fraction) than in the femoral head. Conclusion: Results from electron transport in 3D models of the trabecular skeleton indicate that current methods to account for marrow cellularity in chord-based models are incomplete. At 10 keV, for example, the Eckerman and Stabin model underestimates the self-absorbed fraction to active marrow by 75%. At 1 MeV, the model of Bouchet et al. overestimates this same value by 40%. In the energy range of 20–200 keV, neither model accurately predicts energy loss to the active bone marrow. Thus, it is proposed that future extensions of skeletal dosimetry models use 3D transport techniques in which explicit delineation of active and inactive marrow is feasible.
In radionuclide therapies for the treatment of neoplastic disease, risk of marrow toxicity may be quantified through the assessment of the absorbed dose to sensitive tissues within the bone marrow (1). Computational skeletal dosimetry models are thus used in clinical applications of radionuclide therapy in which a distinction between active (red) and inactive (yellow) marrow is necessary. This binary classification of target tissues is in stark contrast to the complex microanatomy of real marrow. In this study, 3-dimensional (3D) tomographic images of trabecular bone structure are used to introduce target and nontarget regions that explicitly distinguish active from inactive marrow in a manner related to their clinical and histologic definitions.
Histology of Marrow Tissues
Bone marrow is a connective tissue found within cancellous, or trabecular, bone that is divided into irregular interconnected spaces by the bone trabeculae. The tissues of bone marrow may be grouped into 4 categories: (a) the hematopoietic cellular component (granulocytic, erythroid, and megakaryocytic series), (b) bone marrow stromal cells and the extracellular matrix, (c) venous sinuses and other blood vessels, and (d) various other support cells (2,3). Separating the osseous tissues of the bone trabeculae and the marrow is a thin layer of connective tissue, the endosteum, populated with osteoblasts and osteoclasts. The former are responsible for osteoid deposition and bone formation, whereas the latter are involved in bone resorption and remodeling. Spongiosa is defined as the combined tissues of both the bone trabeculae and the marrow tissues interior to the cortical bone cortex of the skeletal site.
The hematopoietic component is supported by a microenvironment of randomly distributed stromal cells, a complex extracellular matrix (ECM), and vascular structures that branch unevenly throughout the marrow space. Stromal cells include adipocytes, fibroblast-like reticulum cells, endothelial cells, and the osteoblasts and osteoclasts of the endosteum. The hematopoietic cell series are supported within marrow chords delineated by the fibroblast-like stromal cells and the stromal matrix. The ECM, which is produced by the stromal cells, contains various substances, including collagen, fibronectin, laminin, thrombospondin, hemonectin, and proteoglycans. In addition to their structural role, these substances also present growth factors to the hematopoietic progenitor cells (4–6). The vascular structures of bone marrow are largely composed of thin-walled venous sinuses (7,8). These sinuses receive blood from the nutrient artery and the periosteal capillary network (3). The former reaches the bone marrow through penetrations of the cortical bone cortex, whereas the latter provides articulation between the marrow sinuses and the haversian canals of the cortex.
Various topographic patterns of hematopoietic cell differentiation are found to occur within the marrow space. For example, precursor cells within the granulocytic series are arranged along the endosteal surface of the trabeculae with maturation occurring toward regions central to the marrow cavities (9,10). Higher concentrations of hemonectin have been found along the endosteal regions of marrow (11), and this protein is particularly adherent to granulocytic precursors (12,13). In contrast, erythroid elements are organized into small groups (erythroblastic islands) present within the central regions of the marrow extending back to the first fat space (adipocytes adjacent to the bone trabeculae). Mature megakaryocytes and their precursors are found uniformly throughout the central regions of the marrow space and are associated with the venous sinuses. Their presence along the bone trabeculae is considered abnormal.
Other cells, which support the function and health of the marrow tissues, include lymphocytes, plasma cells, mast cells, and macrophages. B- and T-lymphocytes are found in small aggregates throughout the marrow space and increase in number with age. Plasma cells may occur individually or in 2- or 3-cell clusters and are found more frequently in layers around blood vessels within the marrow. Mast cells are distributed throughout the marrow with a tendency for a perivascular and paratrabecular distribution. Macrophages are also found uniformly throughout the marrow space, including the luminal surfaces of the venous sinusoids.
Marrow Cellularity
Clinical and pathologic assessment of bone marrow function includes, among other assays, an assessment of the bone marrow cellularity defined as the percentage of bone marrow volume occupied by hematopoietic cells (2,3). Bone marrow cellularity generally decreases with age in normal, healthy individuals at rates that vary with skeletal site. In the femoral head and neck, for example, nominal values of marrow cellularity are 100% in the newborn, 60% in the 10 y old, and only 25% in the adult (14,15). Reference values for the marrow within the lumbar spine at these same ages are 100%, 80%, and 72%, respectively. In a study by Ballon et al. (16), in vivo 3-point chemical-shift MRI was applied as a noninvasive assay of marrow cellularity in the posterior iliac crests of volunteers and patients. In the 8 healthy subjects, marrow cellularity ranged from a low of 22.4% ± 5.7% to a high of 68.1% ± 2.2%. In the same study, marrow cellularity measured in patients with acute myelogenous leukemia (AML) ranged from 18.7% ± 4.9% to 67.7% ± 11.7%. A subsequent study by these authors reported marrow cellularities within the posterior iliac crests ranging from 0% (AML remission) to 98.2% ± 1.0% (chronic myelogenous leukemia, chronic phase) (17). For 6 of the 16 cases studies, the nuclear magnetic resonance (NMR)-derived cellularities were later confirmed by bone marrow biopsy.
In terms of the microanatomy of marrow tissues, a definition of marrow cellularity based on the volume fraction of active marrow would, in principle, exclude the volume associated with the marrow stromal cells and ECM, the blood sinuses and other vessels, and the marrow support cells (categories b–d above). However, most of these cells and structures are of smaller or comparable size and spatial location to the hematopoietic cell series, thus making any differentiation of their occupied marrow volume difficult to achieve in the clinical setting. Fortunately, the relative number and size of the adipocytes within the marrow space are easily distinguished and may be used to provide a more clinically achievable assessment of marrow cellularity. In this manner, marrow cellularity may be defined as the fraction of marrow space not occupied by adipocytes:
 Eq. 1
Eq. 1
Within this clinical working definition, one may then define active marrow—needed to define the source and target regions in radiation transport models of skeletal dosimetry—as the portion of trabecular marrow space not occupied by adipocytes. This definition is consistent with MRI assessments of marrow cellularity and with clinical conditions in which hypercellularity or hypocellularity is accompanied by proportional decreases or increases, respectively, in marrow fat composition.
Previous Methods of Including Marrow Cellularity in Skeletal Dosimetry Models
Most skeletal dosimetry models currently used in clinical medicine are fundamentally based on the seminal work of Spiers and his students at the University of Leeds some 30 y ago (18–21). In these studies, optical scanning of high-resolution radiographs of trabecular bone slices were imaged giving rise to chord-length distributions across marrow cavities and bone trabeculae. Dosimetry models subsequently developed using these chord distributions could only assess radiation absorbed dose averaged across the entire marrow space. Explicit consideration of active and inactive cellular components of the marrow were not included within the transport models when one considers the method by which the chord distributions were measured and assembled (i.e., radiographs showing only bone trabeculae and marrow spaces). Nevertheless, estimates of total active marrow mass were included in the final reporting of dose conversion factors (dose per unit activity concentration in the bone matrix) by the Leeds’ group. A reference value of 1,500 g of active marrow (3,000 g of total marrow) within reference man was used as taken from International Commission on Radiological Protection (ICRP) Publication 23 (22). The Spiers’ data were subsequently used by Snyder et al. (23,24) in the development of radionuclide S values within MIRD Pamphlet No. 11.
The ICRP used single-value approximations of absorbed fractions from the data of Spiers in ICRP Publication 30 (25). Explicit consideration of inactive and active marrow again was made only through the assignment of a total active marrow mass within the full skeleton. The skeletal dosimetry model of MIRDOSE2 uses the ICRP Publication 30 model for bone tissue dosimetry (26). More recent revisions to the ICRP reference man skeletal data have revised downward the estimate of total active marrow to 1,170 g, thus acknowledging that in many adult trabecular bone sites, the marrow is only partially active (14).
Recently, Eckerman and Stabin (15) and Bouchet et al. (27,28) presented more refined models of absorbed dose to skeletal tissues. Both of these models are chord-based models of radiation transport and both use the original marrow and trabeculae chord distributions measured by Spiers and his students. As such, these models cannot explicitly consider the influence of energy lost to adipocytes as an electron traverses a given marrow cavity. For example, consider the assignment of an absorbed fraction to the trabecular active marrow (TAM) for an electron source located within the active marrow tissues of bone site j:
 Because the Eckerman and Stabin model and the Bouchet et al. model use the Spiers’ chord-length distributions, the exact spatial location of the active tissues of the marrow cannot be considered. Consequently, the Monte Carlo simulations of electron transport yield only an estimate of the absorbed fraction to the trabecular marrow space (TMS) for a radiation source emitted within the TMS:
 As such, both models are forced to make approximations to assess the self-absorbed fraction to only the active marrow regions of the skeletal site. In the Eckerman and Stabin model, a uniform scaling of the TMS self-absorbed fraction is made across all electron energies. In their model, the marrow cellularity factor (CF) (fraction of marrow space occupied by active marrow) is taken as the appropriate weighting factor. In the Bouchet et al. model, no weighting factor is applied. Consequently, these authors make the following assignments at all electron energies:
 Eq. 2
Eq. 2
 Eq. 3
Note that in both cases, these absorbed fractions would be divided by the same reference man mass of active marrow in assigning radionuclide S values unique to each skeletal site.
Eq. 3
Note that in both cases, these absorbed fractions would be divided by the same reference man mass of active marrow in assigning radionuclide S values unique to each skeletal site.
At very low electron energies, the Bouchet et al. model correctly approaches the limiting value of unity as the electron source energy is totally imparted within the target region. In this case, no scaling of the TMS absorbed fraction is warranted. However, at high electron energies, electrons traverse 1 or more marrow cavities, and the fraction of electron energy lost to the active marrow tissues is more closely approximated by the fraction of tissue that is active within those cavities. Consequently, a uniform scaling of the TMS self-absorbed fraction is appropriate at high electron energies as is done in the Eckerman and Stabin model. At intermediate energies (as yet to be determined), both models would appear to be incorrect as the Bouchet et al. model would overestimate the self-dose to active marrow, and the Eckerman and Stabin model would underestimate that same dose. However, in both models, energy lost to the bone trabeculae would be accounted for and would be reflected in the energy-dependent profile of the absorbed fraction at all values of cellularity. Again, a dosimetry model that explicitly includes active and inactive marrow regions during particle transport would, in theory, give a correct profile of the absorbed fraction energy dependence without the need for scaling factors or other approximations. The goal of this study was to create such a model using 3D images acquired through NMR microscopy.
MATERIALS AND METHODS
Bone Site Harvesting
A 51-y-old male cadaver, 191 cm in total height and 113 kg in total mass, was purchased from the State of Florida Anatomical Board (Gainesville, FL). The cause of death was a large cardiovascular accident, which included edema and cardiomyopathy. No change in trabecular microstructure is expected from this cause of death. More than 40 bone samples were removed and stored frozen at −17°C until NMR imaging sessions were conducted. Of these various skeletal sites, the femoral head and humeral epiphysis were selected for study because microstructural data on the latter have not been reported previously; data from the femoral head are thus used as a surrogate in current reference man models. Jokisch (29) has reported NMR microscopy and dosimetry of the thoracic vertebrae.
CT Scanning
The right femoral head and right humeral epiphysis harvested from the male cadaver were imaged on a LightSpeed QX/i CT scanner (General Electric Medical Systems, Milwaukee, WI) operated at 120 kV and 120 mA. Helical scans, reconstructed to an in-plane spatial resolution of 240 × 240 μm and a slice thickness of 1.25 mm, were obtained for the femoral heads. For the humeral epiphysis, the in-plane spatial resolution was 188 × 188 μm for each 1.25-mm slice. In addition to identifying the best location to physically section the trabecular regions of the skeletal samples, the CT images allow one to determine the thickness of the cortical bone cortex, a parameter of importance in macrostructural transport models of the skeleton (30). The CT images indicated that the male femoral head sample has a cortex thickness of 0.15 ± 0.02 cm. Furthermore, the CT images show that the spongiosa within the male femoral head is best modeled as a sphere with a 5.0-cm inner diameter. The spongiosa of the male humeral epiphysis is modeled as a 5.0-cm inner-diameter sphere with a cortical thickness of 0.12 ± 0.02 cm. In each case, the spheric representations of these samples neglect the relatively small regions that articulate with the femoral or humeral necks. The 3D models thus developed characterize only the local dosimetry of the marrow tissues within these skeletal sites.
Sample Preparation
After CT scanning, each skeletal sample was physically sectioned. Two pieces were taken (rectangular prisms approximately 2 × 2 × 4 cm in size) from both the right femoral head and the right humeral epiphysis of the male subject. Bone sample sizes were such that the 2 bone prisms represented approximately 25% of the total spongiosa within the femoral head. For the humeral epiphysis, the sectioned bone prisms represented 30% of the spongiosa. Considering that rectangular samples were taken from a spheric bone site, these percentages are considered acceptable in modeling the trabecular structure of these skeletal sites.
Each femoral head bone prism was suspended in a container filled with an aqueous solution of 5.25% sodium hypochlorite. The container was placed on a magnetic stirrer, and the solution was circulated for 2–4 h. The samples were removed from the solution, rinsed with hot water, and reimmersed in a new solution until the marrow was no longer visible within the sample. Next, the marrow spaces of each bone prism were filled under vacuum with gadolinium-doped water and taken to the Advanced MRI and Spectroscopy Facility of the University of Florida Brain Institute for NMR imaging. For the humeral epiphysis sample, marrow-intact imaging was performed. Visual inspection of the CT images from each of these samples showed that the fractional bone volume in each sample was lower than that in the corresponding femoral heads. Marrow-intact imaging was thus selected because we feared that marrow digestion might comprise the trabecular lattice. Recently, we have shown that reproducible dosimetry can be achieved in marrow-intact and in marrow-free specimens (31).
NMR Microscopy
All NMR images were acquired on a 20-cm wide-bore Avance imaging spectrometer (Bruker Medical, Karlsruhe, Germany), operating at a 200-MHz proton resonance (4.7-T magnetic field strength) using a 35-mm-diameter quadrature birdcage coil of length 4.5 cm. A conventional 3D spin-echo pulse sequence was used to obtain fully 3D images of each sample. The field of view of each imaging session was 4.50 × 2.25 × 2.25 cm with matrix dimensions of 512 × 256 × 256. Therefore, the resulting spatial resolution of the 3D image was 88 × 88 × 88 μm. Table 1 lists the repetition time, echo time, receiver gain, and number of averages used in each session. Details of image processing techniques applied to the NMR microscopy images, by which 3D binary images of the bone trabeculae and marrow spaces are obtained, have been reported (30). Also given in Table 1 are the marrow volume fractions for each bone sample. For this male subject, the volume fraction of marrow was found to be higher in the humeral epiphysis than in the femoral head.
Parameters of NMR Imaging Sessions Used for Bone Samples Sectioned from 51-Year-Old Male Cadaver
Explicit Consideration of Adipocyte Clusters in Marrow Spaces
The final step before radiation transport is to further classify the marrow voxels of the 3D images into active and inactive marrow, with the latter defined as the presence of adipocyte cell clusters. First, a random marrow voxel is selected within the image and subsequently reclassified as a voxel of adipose tissue. Two randomly selected neighboring marrow voxels, both of which share a common face with the initial voxel, are then additionally reclassified. In this manner, adipocyte clusters of 3 voxels are randomly placed within the marrow spaces of the 3D image. This process is continued until an overall targeted marrow cellularity is attained. The model is somewhat approximate in that voxel dimensions within these current images are cubes 88 μm on edge, whereas true adipocytes are approximately spheric cells with a mean diameter of ∼57 μm (32). The clustering pattern chosen in this model is based on visual observations of biopsy slides of normal bone marrow (33).
Figure 1 is a simulated 2-dimensional slice with 10%, 50%, 80%, and 100% marrow cellularity imposed on an image extracted from a 3D NMR image. For the femoral head and humeral epiphysis, a reference cellularity factor of 0.25 (25% active marrow and 75% adipose tissue) is recommended by the ICRP (Table 4 of ICRP Publication 70 (14)). Our work investigates marrow cellularities ranging from 10% to 100% (fat fractions ranging from 0.90 to 0.0, respectively). The atomic composition of osseous tissue is taken from that given in International Commission on Radiation Units and Measurements (ICRU) Publication 46 for cortical bone (34). Similarly, the atomic compositions of active and inactive marrow are taken from those given in ICRU Publication 46 for red marrow and yellow marrow, respectively.
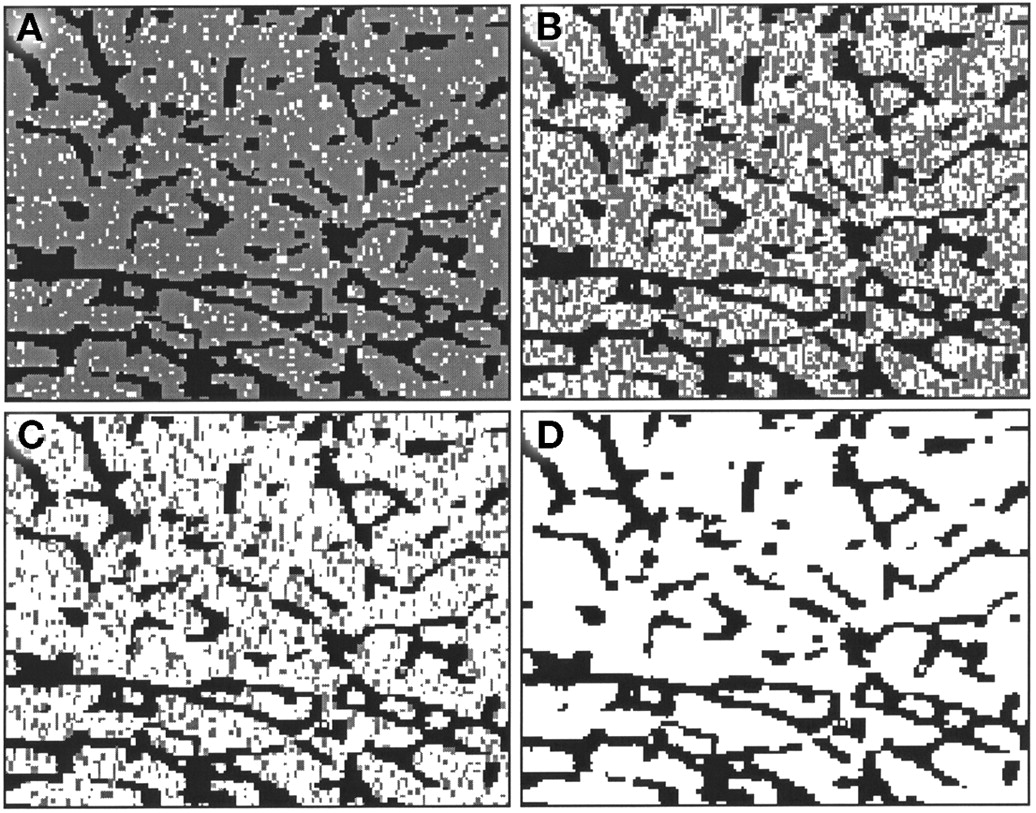
Two-dimensional region of interest selected from 3D NMR image of trabecular bone sample sectioned from male femoral head. Four values of marrow cellularity are displayed: 10% (A), 50% (B), 80% (C), and 100% (D). Gray voxels represent simulated adipocyte cell clusters defining inactive marrow tissue.
EGS4 Macrostructural Transport Model
In this study, macrostructural transport models of the femoral head and the humeral epiphysis are considered during EGS4 electron transport simulations (30). Electrons are transported within the region of interest defined within the original 3D NMR image. As they escape the region of interest, they are reintroduced through identical and adjacent copies of the image (30,31). Additionally, the macroscopic dimensions of the bone site, including the thickness of the cortical bone cortex and the inner diameter of the spongiosa, are also considered. Once a particle reaches the edge of the spongiosa, it is no longer transported within the voxels of the NMR image but is instead transported within a spheric shell of cortical bone. If the particle reenters the trabecular region, it is reintroduced within the voxel transport geometry. If the particle exits the exterior side of the cortical shell, it is transported within a surrounding region of soft tissue, thus allowing for the potential reentry to the bone site.
In this study, only the TAM is considered as the source and target region. Other regions defined in the model are the trabecular bone volume (TBV), the trabecular bone endosteum (TBE), the cortical bone cortex, the trabecular inactive marrow (TIM), and the surrounding soft tissues. Details of the techniques to model the endosteum within digital images of trabecular bone have been reported by Jokisch et al. (30). Ten sets of 1,000 monoenergetic electrons of initial energies between 10 and 4 MeV are transported. Coefficients of variation on the reported absorbed fractions are <1.0%.
RESULTS
Comparisons of Absorbed Fractions for Self-Irradiation of Active Marrow
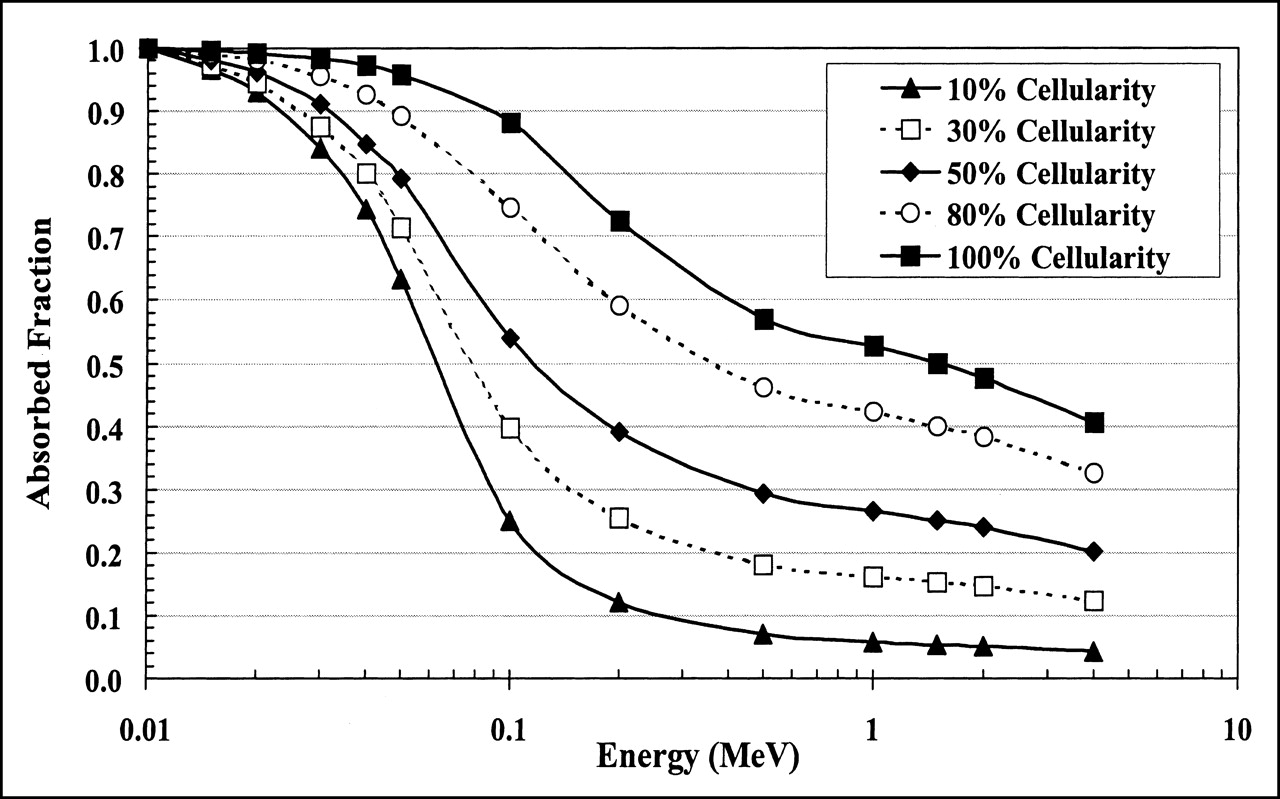
Figures 2 and 3 display absorbed fractions calculated using the macrostructural transport model for self-irradiation of the active marrow within the femoral head and humeral epiphysis, respectively, of the 51-y-old man. Five values of marrow cellularity are assumed: 10%, 30%, 50%, 80%, and 100%. For each marrow cellularity, the absorbed fraction begins at unity for low-energy electrons in which total energy absorption occurs within the TAM source region. As the electron source energy increases, more and more kinetic energy is lost to adipocytes within the marrow cavities. At increasingly higher energies, energy is additionally lost to the surrounding bone trabeculae. At approximately several hundred kiloelectron volts, steady-state values are approached, as predicted under models that transport the electrons within infinite regions of trabecular bone (15,27,30). In the macrostructural models of the femoral head and humeral epiphysis, however, a downturn in the absorbed fraction profile is seen at energies above 1 MeV as electrons leave the spongiosa of the skeletal site and deposit their residual energies within the surrounding cortical bone.

Electron absorbed fractions calculated for 10%, 30%, 50%, 80%, and 100% marrow cellularity using macrostructural transport model for femoral head of 51-y-old man. Values shown are average absorbed fractions of 2 separate bone samples sectioned from femoral head (<4% variation at high energies).

Electron absorbed fractions calculated for 10%, 30%, 50%, 80%, and 100% marrow cellularity using macrostructural transport model for humeral epiphysis of 51-y-old man.
The variations in absorbed fraction with changes in cellularity are slight at low electron energies, yet they progressively increase with increasing source energy to values proportional to the reduction in total active marrow mass. For example, Figure 2 shows that the absolute difference in the self-absorbed fractions at 50 keV for bone samples with 30% and 100% marrow cellularity is 25% (ratio of 0.74). This absolute difference increases to 47% at 200 keV (ratio of 0.35). At high electron energies, the absolute difference declines to about 29% (ratio of 0.29), as an increasing larger portion of the electron energy is lost to the cortical bone at both marrow cellularities. Absorbed fractions for the remaining marrow cellularities follow similar patterns.
For bone sites with a larger marrow volume fraction, as seen in the humeral epiphysis for the male subject, the self-absorbed fraction to the active marrow is systematically higher. Figures 2 and 3 show that the self-absorbed fraction to the active marrow at 30% cellularity is 0.30 in the humeral epiphysis and only 0.25 in the femoral head at 200 keV (ratio of 1.20). At 1 MeV, these values are 0.23 and 0.16, respectively (ratio of 1.44). These differences are important because current clinical models of skeletal dosimetry implicitly assume that the absorbed fraction profile in the femoral head (for which the Spiers’ microstructural chord-length data are available) can be used to estimate the dosimetry of the humeral epiphysis (for which no microstructural data have yet been published).
Table 2 displays the absorbed fraction data for active marrow sources and targets for the femoral head and humeral epiphysis taken from the male cadaver. Values are given for marrow cellularities ranging from 10% to 100% in increments of 10%.
Absorbed Fractions of Energy for Monoenergetic Electrons Emitted Within TAM Irradiating TAM of Femoral Head and Humeral Epiphysis of 51-Year-Old Male Cadaver for 10%–100% Marrow Cellularity
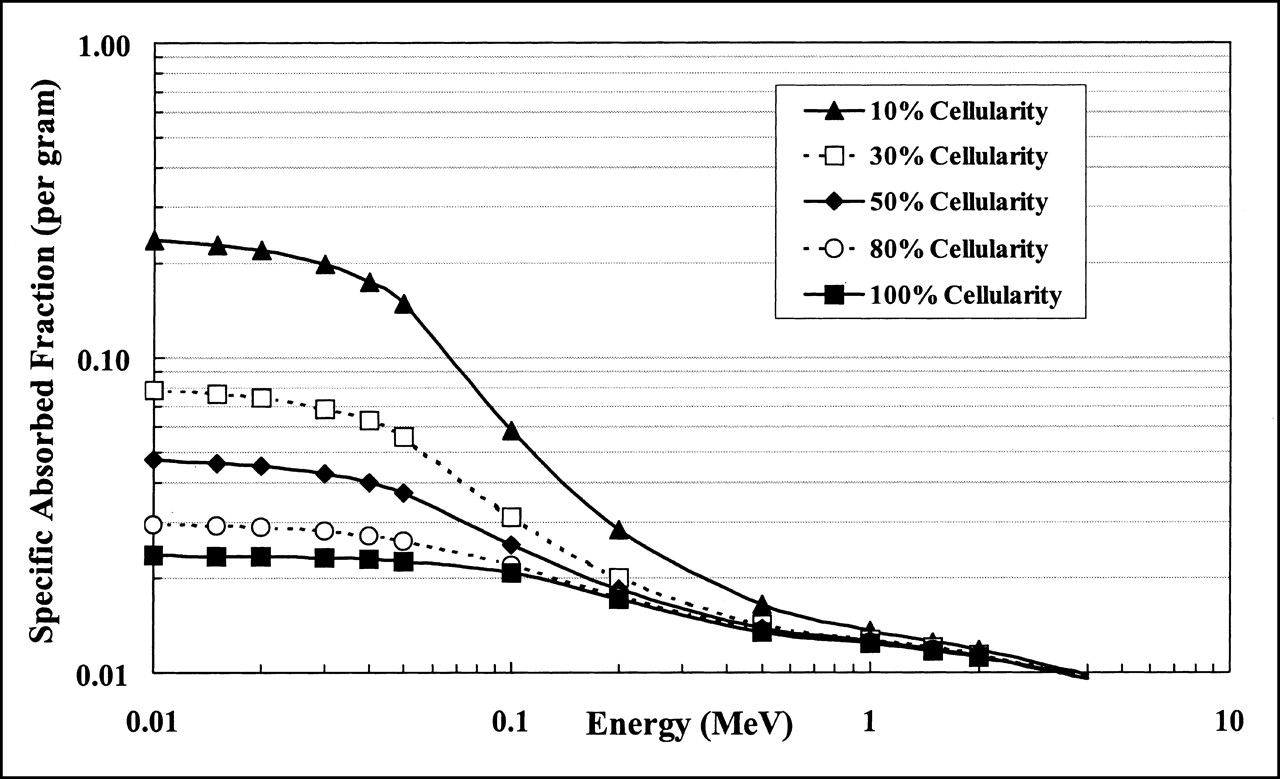
Comparisons of Specific Absorbed Fractions for Self-Irradiation of Active Marrow
In Figure 2, the self-absorbed fractions for electron sources in the active marrow of the male femoral head are shown to separate from one another at high energies in direct proportion to the reduction in active marrow target mass. Consequently, it is instructive to normalize the absorbed fractions at each value of marrow cellularity by the corresponding TAM target mass. As defined in the MIRD schema, the resulting values of specific absorbed fraction, Φ(TAM ← TAM), are directly proportional to the mean dose to active marrow per particle emission i:
 Eq. 4
where ÃTAM is the cumulated activity in the active marrow, and Δi is the mean energy emitted per decay. Values of Φ(TAM ← TAM) in the male femoral head are shown in Figure 4. For high-energy electron emitters (energies exceeding several hundred kiloelectron volts), the mean dose per decay to active marrow is shown to be independent of the marrow cellularity. At high energies, the electrons more or less uniformly traverse the marrow cavities resulting in a uniform density distribution of imparted energy to all marrow tissues. At high energies, the active and inactive marrow components experience the same absorbed dose independent of their respective volume fractions within the marrow space. However, as one considers lower and lower energy emissions within the active marrow, the spatial separation of the active and inactive marrow tissues becomes increasingly important, particularly at low cellularities (high fat fractions). Figure 4 shows that, for 10-keV electrons, the mean dose per decay to active marrow at 10% cellularity is a factor of 3 higher than that in marrow of 30% cellularity. For marrow at 50% cellularity, the dose per decay delivered by 10-keV electrons is a factor of 0.6 lower than that at 30% cellularity. For low-energy emitters in the energy range of 10–100 keV, the specific absorbed fractions, and thus the radionuclide S values, vary considerably with marrow cellularity. As discussed later in this article, these variations in radionuclide S values with marrow cellularity might, under certain conditions, be accompanied by compensatory changes in radionuclide uptake, thus leaving the active marrow absorbed dose per administered activity invariant with changes in patient marrow cellularity.
Eq. 4
where ÃTAM is the cumulated activity in the active marrow, and Δi is the mean energy emitted per decay. Values of Φ(TAM ← TAM) in the male femoral head are shown in Figure 4. For high-energy electron emitters (energies exceeding several hundred kiloelectron volts), the mean dose per decay to active marrow is shown to be independent of the marrow cellularity. At high energies, the electrons more or less uniformly traverse the marrow cavities resulting in a uniform density distribution of imparted energy to all marrow tissues. At high energies, the active and inactive marrow components experience the same absorbed dose independent of their respective volume fractions within the marrow space. However, as one considers lower and lower energy emissions within the active marrow, the spatial separation of the active and inactive marrow tissues becomes increasingly important, particularly at low cellularities (high fat fractions). Figure 4 shows that, for 10-keV electrons, the mean dose per decay to active marrow at 10% cellularity is a factor of 3 higher than that in marrow of 30% cellularity. For marrow at 50% cellularity, the dose per decay delivered by 10-keV electrons is a factor of 0.6 lower than that at 30% cellularity. For low-energy emitters in the energy range of 10–100 keV, the specific absorbed fractions, and thus the radionuclide S values, vary considerably with marrow cellularity. As discussed later in this article, these variations in radionuclide S values with marrow cellularity might, under certain conditions, be accompanied by compensatory changes in radionuclide uptake, thus leaving the active marrow absorbed dose per administered activity invariant with changes in patient marrow cellularity.

Specific absorbed fractions for monoenergetic electrons calculated for 10%, 30%, 50%, 80%, and 100% marrow cellularity using macrostructural transport model for femoral head of 51-y-old man.
As noted earlier, the original Spiers’ chord-length measurements for reference man did not include data for the humeral epiphysis. Thus, it is instructive to compare values of Φ(TAM ← TAM) within the humeral and femoral heads of the male subject using our data from 3D transport simulations. For the 51-y-old man, the dosimetry at high energies within the humeral epiphysis is shown in Table 3 to be only slightly higher than that in the femoral head (ratios of 1.07–1.09). At low energies, however, the mean dose per decay in the humeral epiphysis is only three fourths of the dose per decay in the femoral head. In all cases, these ratios are independent of the marrow cellularity and are strictly a function of the relative volumes of spongiosa within the skeletal sites as well as the relative magnitudes of bone and marrow volume fractions (bone trabeculae thinning). The combination of these parameters determines the total mass of active and inactive marrow within the marrow cavities. The ratios of total marrow mass in these bone sites (humeral epiphysis to femoral head) are 1.33 for the male subject used in this study.
Ratios of Specific Absorbed Fraction Φ(TAM ← TAM) Within Humeral Epiphysis to Corresponding Value in Femoral Head of 51-Year-Old Male Cadaver
Comparisons with Published Methodologies
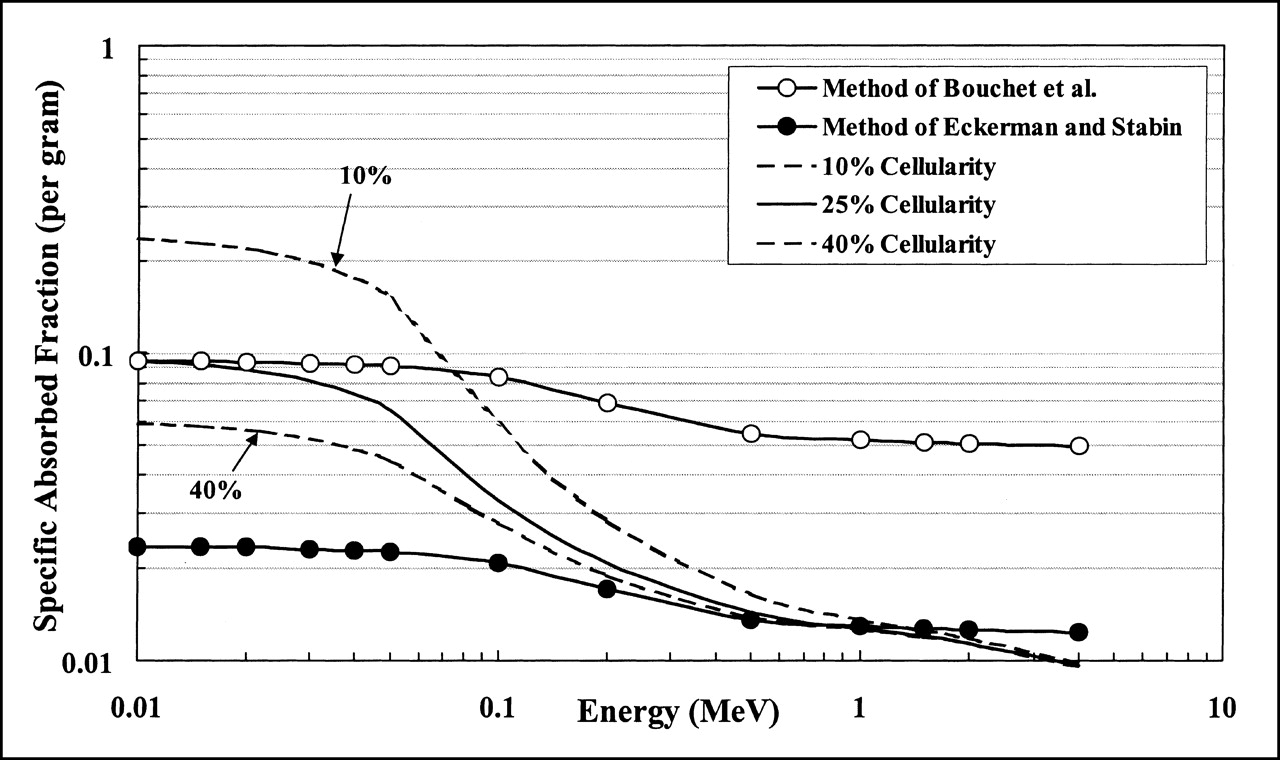
For electron energies between 20 and 500 keV, the slope of the relationship between absorbed fraction and energy can vary greatly with the marrow cellularity and the marrow volume fraction (Figs. 2 and 3). Consequently, scaling of the TMS self-absorbed fractions by a constant reference cellularity does not represent the true energy profile over this energy range. Furthermore, the assumption that the TAM self-absorbed fraction equals the TMS self-absorbed fraction neglects the fact that energy is lost to fat cells in this or at higher electron energies. Figure 5 displays the absorbed fraction profiles for a TAM source and target in the femoral head of the male subject using 2 published methodologies and compares those results with values obtained through direct radiation transport in the digital NMR images. In these comparisons, the radiation transport results use a reference cellularity of 0.25 for the femoral head (14) (Fig. 5, solid line, no data points). Two additional values (Fig. 5, dashed lines) are shown for 10% cellularity (lower than average) and 40% cellularity (higher than average). Self-absorbed fractions for the TMS are calculated in this work using an infinite trabecular region transport model as representative of the Bouchet et al. model. Next, this curve is then uniformly scaled by a value of 0.25 at all energies to produce absorbed fractions representative of the Eckerman and Stabin model. Eckerman and Stabin (15) only report electron absorbed fractions as averaged across all skeletal sites; consequently, values unique to the femoral head are not available for comparison. Still, the above approach, using internally consistent data from the NMR image, fairly compares the 3 methodologies.

Electron absorbed fractions for self-irradiation of TAM within femoral head of 51-y-old man. Three dosimetry methodologies are compared. Method of Bouchet et al. (27,28) assumes that TAM self-absorbed fractions are equal to TMS self-absorbed fractions, whereas method of Eckerman and Stabin (15) scales TMS self-absorbed fractions by reference cellularity factor (0.25 for femoral head). TAM self-absorbed fractions reported in this study are calculated directly using macrostructural transport model of EGS4 transport code (solid line, no data points). Dashed lines indicate potential variations in absorbed fraction with changes in individual marrow cellularity either lower than that of reference man (10%) or higher than that of reference man (40%).
Figure 5 shows that the method used by Eckerman and Stabin greatly underestimates the absorbed fraction to active marrow for electron energies below 200 keV. In fact, at 10 keV, their method underestimates the TAM absorbed fraction by as much as 75% as defined in their scaling approach. However, at electron energies above 200 keV, their method produces results that differ by <5% from the absorbed fractions calculated in our work, provided that the assumed reference cellularity of 25% is appropriate to the patient in question. As shown by the dashed lines in Figure 5, the absorbed fraction can vary over a factor of 3.5 at high energies for corresponding cellularity variations ranging from 10% to 40%. At 4 MeV, their method begins to overestimate the TAM self-absorbed fractions by a factor of 1.3 in that their model does not allow for electron energy escape to the surrounding cortical bone (macrostructural vs. infinite trabecular-region transport).
The method of Bouchet et al. (27,28) is consistent with the absorbed fractions calculated by direct transport at all marrow cellularities only at extremely low electron energies. At 20 keV, this method overestimates the absorbed fraction at reference cellularity by a factor of 1.05 and overestimates by as much as a factor of 5.3 at 4 MeV. In the energy range of 20–200 keV, neither method accurately predicts the fraction of electron energy absorbed within the active tissues of the marrow cavities.
In the methods of Bouchet et al. (27,28) and Eckerman and Stabin (15), absorbed fractions are divided by the active marrow mass in reference man (0.25 × total marrow mass) to obtain corresponding values of Φ(TAM ← TAM). Consequently, discrepancies in φ(TAM ← TAM) shown in Figure 5 are reflected in corresponding values of Φ(TAM ← TAM) as shown in Figure 6. As discussed previously, the specific absorbed fraction is shown to be invariant with changes in marrow cellularity at energies of several hundred kiloelectron volts and above. Consequently, the method of Eckerman and Stabin preserves values of mean dose to active marrow per electron emission with changes in marrow cellularity for high-energy electron sources. However, as the source energy decreases, the model of Bouchet et al. provides accurate dosimetry at energies of ≤30 keV, provided that the assumed reference cellularity is justified for that particular patient. If the patient’s marrow cellularity is lower than normal (10% in the extreme), the dose per low-energy electron emission is shown to be a factor of 2.5 times higher than predicted by Bouchet et al. and a factor of 10 times higher than that predicted by the Eckerman and Stabin model.
Electron-specific absorbed fractions for self-irradiation of TAM within femoral head of 51-y-old man. Values are obtained by dividing each curve in Figure 5 by corresponding mass of active marrow. Dashed lines indicate potential variations in specific absorbed fraction with changes in individual marrow cellularity either lower than that of reference man (10%) or higher than that of reference man (40%).
DISCUSSION
In the definition of marrow cellularity given by Equation 1, radiation absorbed dose to active marrow would necessarily represent the energy per unit mass averaged across not only the hematopoietic stem cells (pleuripotent hematopoietic stem cell, myeloid stem cell, and lymphoid stem cell) but also across their various hematopoietic progeny, the stromal cells, the ECM, and the support cells of the marrow space. The adequacy of this definition depends on the purpose of the dose estimate. For short-term effects, the above definition may be considered appropriate in that many of the cells in marrow components b–d (Histology of Marrow Tissues section) directly support hematopoiesis. For example, reticulum cells induce proliferation of myeloid and B-lymphoid progenitor cells (35), whereas endothelial cells play a role in regulating the trafficking and homing of the hematopoietic cells as they reach maturity and are released into circulation (36,37). If, however, one is interested in long-term risks of marrow irradiation, then a direct dose assessment to only the stem cells of marrow component a is desired. Unfortunately, the explicit location of the stem cells within the irregular network of the trabecular marrow spaces remains highly uncertain, and one must again resort to an assessment of the average dose across all active marrow tissues. In either case, an explicit segmentation of the adipose tissue within the marrow provides a more histologically correct and achievable geometry for active marrow dose assessment. A dosimetric model that makes a distinction among active and inactive marrow can use patient-specific information on marrow cellularity derived either invasively through marrow biopsies or noninvasively through MRI (16,17,38). In addition to changes in cellularity with the patient’s age, damage to marrow tissues through either disease or chemotherapy may alter marrow cellularity within the skeletal regions of the patient. Thus, the presence of marrow cellularity as an independent model parameter permits improved patient specificity in the resulting dose estimates.
One must also consider active marrow as a potential source region. As outlined by Sgouros (39) and Sgouros et al. (1), radiochemicals may localize in active marrow either through equilibrating within the extracellular fluid volume of the marrow space (nonspecific uptake) or through binding to cellular marrow components (specific uptake). In either case, a 3D delineation of the cellular-level locations of these source regions within the marrow cavities is difficult to define in the clinical setting as well as to implement in more macroscopic radiation transport models in which only the TBV and TMS are defined through microimaging. The use of Equation 1 to partition the TMS into its inactive (adipocyte) and active volumes again provides an acceptable solution.
The clinical significance of this new approach to skeletal dosimetry may be assessed using the MIRD schema for determining the mean absorbed dose to the active marrow for radiation emission i:
 Eq. 5
where Δi indicates the mean energy per electron emission i within the active marrow tissues. If the active marrow mass term, mTAM, in the denominator is positioned under the first term of the numerator, then Equation 5 can be rewritten in terms of the mass concentration of cumulated activity in the active marrow [Ã]TAM:
Eq. 5
where Δi indicates the mean energy per electron emission i within the active marrow tissues. If the active marrow mass term, mTAM, in the denominator is positioned under the first term of the numerator, then Equation 5 can be rewritten in terms of the mass concentration of cumulated activity in the active marrow [Ã]TAM:
 Eq. 6
Alternatively, one may position the mass term under the absorbed fraction and rewrite Equation 5 in terms of specific absorbed fractions:
Eq. 6
Alternatively, one may position the mass term under the absorbed fraction and rewrite Equation 5 in terms of specific absorbed fractions:
 Eq. 7
Eq. 7
For nonspecific uptake in skeletal tissues, the radiopharmaceutical equilibrates quickly within the marrow plasma and the extracellular fluid volume regions, which are both assigned to active marrow in the present model. Here, the total cumulated activity is proportional to the mass of active marrow, and thus [Ã]TAM remains constant (for a given administered activity A0) and is independent of marrow cellularity. According to Equation 6, the mean absorbed dose to active marrow is directly proportional to the absorbed fraction for marrow self-irradiation. Figure 2 shows that for low-energy electron sources, values of φ(TAM ← TAM) are fairly independent of cellularity, and thus patient-specific assessments of marrow cellularity are not needed for marrow dose estimates (reference values will suffice). If, however, high-energy electron sources are used, the active marrow dose becomes very much a function of the patient marrow cellularity. Efforts to assess marrow cellularity in the patient are then warranted.
For specific binding to marrow components, as for the case of radiolabeled antibodies, the importance of knowing the patient’s marrow cellularity in providing an accurate dose estimate depends on whether the binding sites have been saturated. For uptake in active marrow below saturation, the cumulated activity in active marrow, ÃTAM, will be fixed for a given value of A0. According to Equation 7, the mean dose to active marrow in this case is proportional to the specific absorbed fraction for marrow self-irradiation. Furthermore, Figure 4 reveals that values of Φ(TAM ← TAM) are strong functions of marrow cellularity only for low-energy electron sources. Consequently, patient-specific assessments of marrow cellularity, with corresponding corrections to the specific absorbed fraction (and thus the radionuclide S value), should be made for specific uptake of low-energy emitters below binding saturation. If the antibody has reached binding saturation, the value of [Ã]TAM once again remains constant for a given value of A0, and the conclusions drawn above for nonspecific uptake then apply.
CONCLUSION
This study extends previous work in NMR microscopy–based skeletal dosimetry in which image voxels delineating the marrow tissues are further partitioned into regions of active and inactive marrow, with the latter defined as clusters of adipocytes. Absorbed fractions are then calculated within these images for active marrow electron sources and for marrow cellularities ranging from 10% to 100% (fat fractions from 90%–0%), a range that corresponds to values potentially seen in patient populations (17). Transport calculations are based on 3D NMR microscopy images from trabecular bone samples acquired from the femoral head and humeral epiphysis of a 51-y-old male subject. The absorbed fraction profiles are then compared between bone sites in this individual and against data from published transport methodologies.
The 3D electron-transport simulations indicate that the Eckerman and Stabin model used in MIRDOSE3 accurately describes specific absorbed fractions for self-irradiation of the active marrow for source energies exceeding 200 keV. However, this model substantially underestimates the dose per electron emission at energies below several tens of kiloelectron volts. Below 30 keV, the model of Bouchet et al. accurately portrays the specific absorbed fraction for self-irradiation of active marrow, provided that the reference cellularity selected for reference man is accurate for the patient in question. If the patient marrow cellularity differs from the reference value of 25%, neither model is particularly accurate at electron energies below 200 keV. Radionuclide S values cannot be compared in this study because reference active marrow masses are given only for the upper half of the femur and the humerus in the Bouchet et al. and Eckerman and Stabin models. Consequently, additional NMR imaging of the femoral and humeral necks is required, as well as an expansion of the macrostructural transport model, before comparable tissue masses and radionuclide S values would be available from 3D transport simulations.
Patient-specific information on marrow cellularity is clearly an important parameter that might influence the estimates of cumulated activity in active marrow and the magnitude of the radionuclide S value. Simple mass scaling of the reference man radionuclide S value is not sufficient for total patient specificity because marrow cellularity should also be considered as an independent model parameter in the assignment of absorbed fractions and radionuclide S values. Additional factors to consider are the overall size of the skeletal site relative to that in reference man and the bone volume fraction within the spongiosa. This work indicates that 3D microimaging of trabecular bone, as done through NMR microscopy or other methods, can be a valuable tool in efforts to expand the existing database of reference man S values for skeletal dosimetry in ways that will explicitly consider these important factors.
Acknowledgments
This work was supported in part by U.S. Department of Energy Nuclear Engineering Education Research grant DE-FG07-ID1376 with the University of Florida.
Footnotes
Received Apr. 26, 2001; revision accepted Sep. 25, 2001.
For correspondence or reprints contact: Wesley E. Bolch, PhD, Department of Nuclear and Radiological Engineering, University of Florida, Gainesville, FL 32611-8300.
E-mail: wbolch{at}ufl.edu
REFERENCES
In this issue


Jump to section
Related Articles
Cited By...
- Bone Marrow Dosimetry Using 124I-PET
- MIRD Pamphlet No. 22 (Abridged): Radiobiology and Dosimetry of {alpha}-Particle Emitters for Targeted Radionuclide Therapy
- A Method to Correct for Radioactivity in Large Vessels That Overlap the Spine in Imaging-Based Marrow Dosimetry of Lumbar Vertebrae
- Toward Patient-Friendly Cell-Level Dosimetry
- Linear Regression Model for Predicting Patient-Specific Total Skeletal Spongiosa Volume for Use in Molecular Radiotherapy Dosimetry
- Absorbed Fractions for {alpha}-Particles in Tissues of Trabecular Bone: Considerations of Marrow Cellularity Within the ICRP Reference Male
- Planning Time for Peripheral Blood Stem Cell Infusion After High-Dose Targeted Radionuclide Therapy Using Dosimetry
- A Paired-Image Radiation Transport Model for Skeletal Dosimetry
- Dosimetry of Internal Emitters
- Adipocyte Spatial Distributions in Bone Marrow: Implications for Skeletal Dosimetry Models
- Radiation Dosimetry Results and Safety Correlations from 90Y-Ibritumomab Tiuxetan Radioimmunotherapy for Relapsed or Refractory Non-Hodgkin's Lymphoma: Combined Data from 4 Clinical Trials