


Abstract
Although FDG uptake is closely related to the expression of the glucose transporter (GLUT) in malignant tumors, such a relationship has not been fully investigated in inflammatory lesions. The aim of our study was to determine the expression of GLUT subtypes in experimental inflammatory lesions and to compare the results with those in malignant tumors in relation to FDG accumulation. Methods: Rats were inoculated with a suspension of Staphylococcus aureus or allogenic hepatoma cells (KDH-8) into the left calf muscle. Five days after S. aureus inoculation (n = 9) and 14 d after KDH-8 inoculation (n = 11), [14C]FDG was injected intravenously and its accumulation in the infectious and tumor tissues was determined as the percentage activity of the injected dose per gram of tissue (%ID/g). The expression of glucose transporters (GLUT-1 to GLUT-5) was investigated by immunostaining the infectious tissues (n = 6) and the tumor tissues (n = 6). Immunohistochemical grading was assessed semiquantitatively by 5 observers. Results: The [14C]FDG uptake was significantly higher in the tumor lesion than in the inflammatory lesion (2.04 ± 0.38 %ID/g vs. 0.72 ± 0.15 %ID/g; P < 0.0001). The tumor and inflammatory tissues highly expressed GLUT-1 and GLUT-3. The GLUT-1 expression level was significantly higher in the tumor tissue than in the inflammatory tissue (P < 0.05). Conclusion: The results based on our models showed a high FDG uptake and high GLUT-1 expression level not only in the tumor lesion but also in the inflammatory lesion. The higher GLUT-1 expression level in the tumor lesion may partially explain the higher FDG accumulation in the tumor than in the inflammatory lesion.
A widely used technique to visualize and classify malignant tumors into stages and to differentiate malignant lesions from benign lesions is [18F]FDG PET (1–6). These applications are based on the accumulation of FDG caused by increased glucose utilization in most tumors. However, recent investigations have shown that FDG accumulates not only in malignant tumors but also in inflammatory lesions (7–11). It is now important to investigate how to differentiate malignant tumors from inflammatory lesions to obtain increased accuracy in diagnosing malignant tumors by FDG PET.
FDG is rapidly transported through the cell membrane into the cytosol, phosphorylated by hexokinase (a key glycolytic enzyme), and metabolically trapped intracellularly as FDG-6-phosphate (12–14). Thus, FDG accumulation depends on the rate of transport through the cell membrane, the activity of hexokinase, and the rate of dephosphorylation in the tissue (15,16). The transport of FDG across cell membranes is mediated by ≥5 structurally related proteins (family of glucose transporters [GLUT-1 to GLUT-5]) (17). The GLUT expression and its relation to FDG accumulation in malignant tumors have been extensively investigated in clinical and experimental studies (17–20). Significantly elevated expression levels of GLUT-1 and GLUT-3 are considered to be a factor contributing to the accumulation of FDG in malignant tumors (21).
On the other hand, little is known about the factors contributing to FDG accumulation in inflammatory lesions. To our knowledge, the expression of GLUTs and its relationship to FDG accumulation in inflammatory lesions have not been studied. If the contribution of GLUTs to FDG accumulation in inflammatory lesions is different from that in malignant tumors, this may provide a clue for differentiating malignant tumors from benign lesions by FDG PET. The aim of this study was to investigate the expression of GLUT subtypes in inflammatory lesions and to compare the results with those in malignant tumors in relation to FDG accumulation using rat models of malignant tumor and inflammation.
MATERIALS AND METHODS
Preparation of Animal Models
All procedures involving animals were performed in accordance with institutional guidelines of Hokkaido University for the care and use of laboratory animals. KDH-8 rat hepatoma cells were used to generate a tumor model. Staphylococcus aureus was applied to induce infectious inflammation. Female Wistar King Aptekman/Hok (WKA/H) rats (Experimental Animal Institute, Graduate School of Medicine, Hokkaido University, Sapporo, Japan) weighing 170–200 g were inoculated with a suspension of KDH-8 (1 × 10⁶ cells per rat) or S. aureus (1 × 10⁸ organisms per rat) into the left calf muscle.
[14C]FDG Uptake Study
Five days after S. aureus inoculation (n = 9) and 14 d after KDH-8 inoculation (n = 11), when the tumor and inflammatory tissues were 1–2 cm in diameter, each rat was injected intravenously with 37 kBq [14C]FDG (Amersham Life Science, Tokyo, Japan). Sixty minutes after [14C]FDG injection, the animals were killed and the tumor, infectious tissues, and muscle were excised. The tissue samples were weighed and the radioactivity was determined with a liquid scintillation counter (1414 WinSpectral α/β; Wallac, Turku, Finland). The accumulation of [14C]FDG in the tissues was expressed as the percentage activity of injected dose per gram of tissue (%ID/g).
Immunohistochemistry
The expression of GLUT-1 to GLUT-5 was studied in formalin-fixed paraffin sections of the tumor tissues (n = 6) and inflammatory tissues (n = 6) according to a standard immunostaining procedure (20). Briefly, deparaffinized sections were incubated with each of the anti-GLUT antibodies (Chemicon International Inc., Temecula, CA) for 30 min at 37°C. The bound antibody was visualized using the avidin/biotin conjugate immunoperoxidase procedure with the HISTOFINE SAB-PO kit (Nichirei, Tokyo, Japan) and 3,3′-diaminobenzidine tetrahydrochloride.
Immunohistochemical Grading
Immunohistochemical grading was performed blindly by 5 independent researchers on 6 randomly selected ×200 microscopic fields for each section. The intensity of staining (intensity) was graded from 0 to 3 (0, not stained; 1, equivocal; 2, intense; and 3, very intense) according to the criteria of Higashi et al. (22). Also, the percentage of positively stained cells (percentage positive) was graded from 1 to 5 (1, 0%–20%; 2, 21%–40%; 3, 41%–60%; 4, 61%–80%; and 5, 81%–100%). The mean values of these scores determined by the 5 observers were used. The expression of GLUTs was assessed semiquantitatively by the product of these scores (intensity × percentage positive).
Statistical Analyses
A paired t test and an unpaired t test were used to assess the significance of differences in the [14C]FDG uptake between 2 tissues in the same model group and between the tumor and inflammatory tissues, respectively. A 2-way ANOVA was performed to assess the significance of differences attributed to the model (tumor or inflammation) and the GLUT subtypes (intensity × percentage positive). A 2-tailed value of P < 0.05 was considered significant.
RESULTS
[14C]FDG Accumulation Study
[14C]FDG accumulation in the tumor tissue (2.04 ± 0.38 %ID/g) and in the inflammatory tissue (0.72 ± 0.15 %ID/g) was significantly higher than that in the normal right calf muscle (tumor model, 0.25 ± 0.02 %ID/g; inflammatory model, 0.18 ± 0.02 %ID/g) (P < 0.0001) (Table 1). In addition, [14C]FDG accumulation in the tumor tissue was significantly higher than that in the inflammatory tissue (P < 0.0001).
[14C]FDG Accumulation in Tissues
Expression of GLUTs
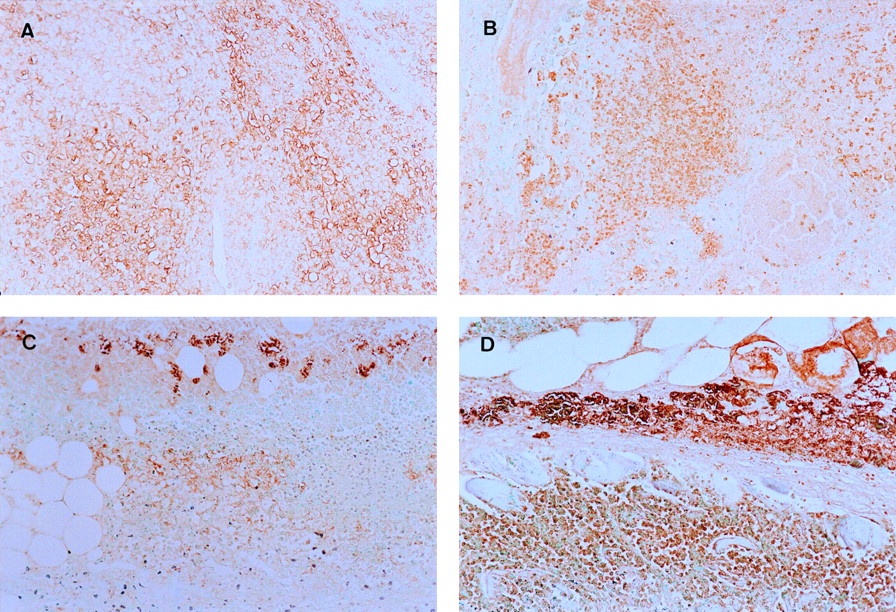
A high intensity of staining was observed in the tissue sections that reacted with anti-GLUT-1 and anti-GLUT-3 antibodies (Fig. 1). The GLUT expression was observed at the surface of tumor cells in the tumor model. The GLUT expression was also observed in white blood cells in the inflammatory model. The results of immunohistochemical grading are summarized in Figure 2. The expression levels of GLUT-1 and GLUT-3 estimated on the basis of intensity × percentage positive were significantly higher than those of GLUT-2, GLUT-4, and GLUT-5 in the inflammatory and tumor tissues. There was no significant difference in the expression patterns of GLUTs between the inflammatory and tumor tissues. The GLUT-1 expression level was significantly higher in the tumor (38.22 ± 7.64) than that in the inflammatory tissue (27.30 ± 7.98) (P < 0.05). On the other hand, the GLUT-3 expression level appeared to be slightly higher in the inflammatory tissue (34.58 ± 14.55) than that in the tumor tissue (23.44 ± 9.11), although the difference was not statistically significant.

Staining with anti-GLUT-1 (A) and anti-GLUT-3 (B) antibodies in tumor tissue and staining with anti-GLUT-1 (C) and anti-GLUT-3 (D) antibodies in inflammatory tissue. Significant amounts of GLUT-1 and GLUT-3 are expressed in tumor and inflammation models. (×200)

Immunohistochemical grading in inflammatory and tumor tissues. Percentage of positively stained cells and intensity of GLUT have been visually graded and assessed by semiquantitative immunohistochemical grading performed by calculating product of intensity and percentage positive. Expression levels of GLUT-1 and GLUT-3 are significantly higher than those of GLUT-2, GLUT-4, and GLUT-5 in inflammatory and tumor tissues (*P < 0.0001). GLUT-1 expression level is significantly higher in tumor tissue than that in inflammatory tissue (†P < 0.05). S.A. = S. aureus.
DISCUSSION
Our data indicate that [14C]FDG uptake was significantly higher in the tumor than that in the inflammatory lesion, that the tumor and inflammatory tissues highly expressed GLUT-1 and GLUT-3, and that the GLUT-1 expression level was significantly higher in the tumor than that in the inflammatory tissue.
The increase in the glucose transport rate and the overexpression of GLUT-1 are well established in cells that are stimulated by mitogens or growth factors or are transformed by various viruses or activated oncogenes (23,24). Flier et al. (25) indicated that the increase in the glucose transport rate and the overexpression of transporter messenger RNA are induced by ras or src oncogenes. In addition, the GLUT-1 gene was activated by oncogenes through biochemical intracellular signaling pathways (26). Our semiquantitative analysis data also showed the expression of GLUT-1 in the KDH-8–inoculated rat. This finding is concordant with previous reports showing a high expression level of GLUT-1 in various types of human malignant tumor (17–20).
The GLUT-3 expression was also noted in our tumor model. Younes et al. (21) also reported the high expression level of GLUT-3 in stage I non–small cell lung carcinoma that was associated with poor survival. Our data may support their clinical findings. On the other hand, Higashi et al. (18) did not observe any expression of GLUT-3 in human pancreatic tumors in their immunostaining study. Although they evaluated staining by qualitative analysis, the different types of tumor showed different expression patterns of GLUT-3.
Little is known about the factors that contribute to FDG accumulation in inflammatory lesions. To our knowledge, the expression of GLUT-1 and GLUT-3 in relation to FDG uptake in experimental inflammatory lesions has not been reported previously. Our study showed the expression of GLUTs in the surrounding zone of the abscess (Fig. 1). White blood cells exist in areas surrounding the abscess. Peters and Hausen (27) reported the accumulation of 3-O-methyl[U-14C]glucose in lymphocytes. Yamada et al. (28) reported a high accumulation of FDG in turpentine-induced inflammatory tissues. The accumulation of FDG observed in their microautoradiography study occurred in the zone surrounding the abscess wall. From these results, it may be possible to observe the high expression level of GLUTs and the high accumulation of FDG in white blood cells of inflammatory lesions.
Two major differences in FDG uptake and GLUT expression between the tumor and inflammatory lesions are the higher FDG uptake and the higher expression level of GLUT-1 in the tumor than those in the inflammatory lesions. These differences may possibly provide a clue for differentiating these 2 lesions. However, such differentiation cannot be made on the basis of different patterns of GLUT expression in the lesions. The GLUT-3 expression level tended to be higher in the inflammatory lesions than that in the tumor, but the difference is not statistically significant.
We used [14C]FDG, instead of [18F]FDG, to measure FDG activity for 2 major reasons. First, our cyclotron center was not ready for FDG labeling when we started these experiments. In addition, our cyclotron was located far from the animal experimental laboratory. [14C]FDG was more easily applied for tissue counting because of its longer physical half-life. The biodistribution of FDG was essentially the same for [18F]FDG and [14C]FDG. Unfortunately, autoradiography was not performed in this study, although an advantage of using [14C]FDG over [18F]FDG is the applicability of [14C]FDG to autoradiography. Autoradiographic studies that correlate the regional distribution of FDG with the expression of GLUTs are necessary.
In this study, the expression of GLUTs was assessed semiquantitatively on the basis of the intensity of staining and the percentage of positively stained cells. The intensity of GLUT was scored by a method similar to that of Higashi et al. (18,22). They reported that GLUT-1 expression and cellularity were important factors for FDG uptake in human pancreatic tumors (18). Accordingly, we considered the intensity and the percentage positive as important factors for FDG uptake in an in vivo study. In addition, the use of the percentage positive appeared to partially eliminate the influence of differences in cell sizes between inflammatory and tumor cells. This is a very simple method that entails a relatively easy assessment of immunostaining of the GLUTs.
In the immunohistochemistry, we used anti-GLUT antibodies specific for each GLUT subtype. Because of the different affinities of each antibody for the antigen, it is difficult to compare directly the difference in the expression of GLUT subtypes. However, the aim of this study was to compare the difference in the expression of GLUTs between inflammatory tissues and tumor tissues; thus, we believe that this aim was achieved.
The results in this study were limited only to an inflammatory model (S. aureus) and a tumor model (KDH-8). We observed high-FDG-uptake tumors and low-FDG-uptake tumors. The tumor grade is also related to the FDG uptake and the expression of GLUTs (29). The time after inoculation of S. aureus or tumor cells was also limited. In this study, we measured the FDG uptake at 60 min after tracer injection. It has been shown that the FDG uptake in tumors does not reach a plateau within 90 min after injection. Nakamoto et al. (30) reported that delayed FDG PET scanning may contribute to differentiation between malignant and benign lesions in the pancreas. Hustinx et al. (8) recently suggested that a dual time-point imaging protocol is helpful in differentiating malignant lesions from inflammatory lesions and normal tissues. Further studies, using a variety of inflammatory and tumor models analyzed at various time points, are required to confirm our results and to determine the roles of GLUT in FDG accumulation in inflammatory and tumor tissues.
The contribution of hexokinase activity to FDG accumulation in these tissues also remains to be investigated. FDG that accumulated in the tumor is changed to FDG-6-phosphate by hexokinase. The hexokinase activity may determine FDG retention in the tumor. Haberkorn et al. (15) observed that the uptake of FDG correlated with the expression of GLUT-1 and hexokinase. Moreover, in some tumors such as breast cancer, hexokinase is the rate-limiting factor, whereas this is not the case in lung cancer (31). Therefore, it is also necessary to compare the expression of hexokinase and the uptake of FDG in inflammatory tissues.
CONCLUSION
The results based on our models showed a high FDG uptake and a high GLUT-1 expression level not only in the tumor lesion but also in the inflammatory lesion. The GLUT-1 expression level was significantly higher in the tumor lesion than that in the inflammatory lesion. The higher GLUT-1 expression level in the tumor may partially explain the higher FDG accumulation in the tumor lesion than that in the inflammatory lesion.
Acknowledgments
The authors are grateful to Prof. Shinzo Nishi and Prof. Toshiyuki Ohnishi of the Central Institute of Isotope Science, Hokkaido University, for supporting this work.
Footnotes
Received Jan. 18, 2001; revision accepted Jun. 1, 2001.
For correspondence or reprints contact: Nagara Tamaki, MD, PhD, Department of Nuclear Medicine, Graduate School of Medicine, Hokkaido University, Kita 15 Nishi 7, Kita-ku, Sapporo, 060-8638, Japan.
REFERENCES
In this issue


Jump to section
Related Articles
Cited By...
- 18F-FDG PET/CT for Posttreatment Surveillance Imaging of Patients with Stage III Merkel Cell Carcinoma
- The diagnostic value of 18F-FDG PET/CT in identifying the causes of fever of unknown origin
- What Lies Within?: Imaging to Detect Ventricular Assist Device Infection
- PET/CT in nononcological lung diseases: current applications and future perspectives
- Mediastinal germ cell tumour causing superior vena cava tumour thrombosis
- In Vivo Monitoring of Staphylococcus aureus Biofilm Infections and Antimicrobial Therapy by [18F]Fluoro-Deoxyglucose-MicroPET in a Mouse Model
- EANM/SNMMI Guideline for 18F-FDG Use in Inflammation and Infection
- Imaging the inflammatory activity of sarcoidosis
- Prediction of the Need for Surgical Intervention in Obstructive Crohn's Disease by 18F-FDG PET/CT
- Noninvasive Pulmonary [18F]-2-Fluoro-Deoxy-D-Glucose Positron Emission Tomography Correlates with Bactericidal Activity of Tuberculosis Drug Treatment
- 18F-FDG Uptake in Lung, Breast, and Colon Cancers: Molecular Biology Correlates and Disease Characterization
- Cancer Detection Using a PET Tracer, 11C-Glycylsarcosine, Targeted to H+/Peptide Transporter
- 18F-FDG PET and PET/CT in Fever of Unknown Origin
- Enhanced Apoptotic Reaction Correlates with Suppressed Tumor Glucose Utilization After Cytotoxic Chemotherapy: Use of 99mTc-Annexin V, 18F-FDG, and Histologic Evaluation
- Biologic Correlates of Intratumoral Heterogeneity in 18F-FDG Distribution with Regional Expression of Glucose Transporters and Hexokinase-II in Experimental Tumor
- 18F-FDG PET in Rheumatoid Arthritis: There Still Is a Long Way to Go
- PET and SPECT for Detection of Tumor Progression in Irradiated Low-Grade Astrocytoma: A Receiver-Operating-Characteristic Analysis
- Tetraphenylphosphonium as a Novel Molecular Probe for Imaging Tumors
- 18F-FDG Uptake in Squamous Cell Carcinoma of the Cervix Is Correlated with Glucose Transporter 1 Expression
- Value of Dual-Phase 2-Fluoro-2-Deoxy-D-Glucose Positron Emission Tomography in Cervical Cancer
- Detection of Apoptotic Tumor Response In Vivo After a Single Dose of Chemotherapy with 99mTc-Annexin V