


Abstract
Differentiation between tumor progression and radiation necrosis is one of the most difficult tasks in oncologic neuroradiology. Functional imaging of tumor metabolism can help with this task, but the choice of tracer is still controversial. This prospective study following up irradiated low-grade astrocytoma (LGA) was, to our knowledge, the first receiver-operating-characteristic (ROC) analysis that intraindividually evaluated the diagnostic performance of the SPECT tracers 3-[123I]iodo-α-methyl-L-tyrosine (IMT) and 99mTc(I)-hexakis(2-methoxyisobutylisonitrile) (MIBI) and the PET tracer 18F-FDG. Methods: We examined 17 patients, initially with histologically proven LGA and treated by stereotactic radiotherapy, who presented with new gadolinium-diethylenetriaminepentaacetic acid–enhancing lesions (n = 26) on MRI. At that time, MRI could not differentiate between progressive tumor and nonprogressive tumor. This MRI examination was closely followed by 18F-FDG PET and by 99mTc-MIBI and 123I-IMT SPECT. Lesions were classified as progressive tumor (n = 17) or nonprogressive tumor (n = 9) on the basis of prospective follow-up (through clinical examination, MRI, and proton MR spectroscopy) for 26.6 ± 6.6 mo after PET or SPECT. Results: 123I-IMT yielded the best ROC characteristics and was the most accurate for classification, with an area under the ROC curve (Az) of 0.991. The Az of 18F-FDG (0.947) was not significantly lower than that of 123I-IMT. The difference in the Az of 99mTc-MIBI (0.713) from the Az of the other tracers used in our study was highly significant (P ≤ 0.01). 99mTc-MIBI SPECT was of low accuracy and, especially, of poor sensitivity even at modest specificity values. Conclusion: 123I-IMT SPECT imaging of amino acid transport accurately detects tumor progression in patients with irradiated LGA. In contrast to 123I-IMT, 18F-FDG PET was slightly less accurate for classification, and 99mTc-MIBI SPECT was of limited value. Imaging of amino acid transport with 123I-IMT is a valuable additional tool for the follow-up of LGA, allowing early, noninvasive differentiation of lesions with ambiguous morphology after irradiation.
- 18F-FDG
- 3-123I-iodo-α-methyl-l-tyrosine
- 99mTc(I)-hexakis(2-methoxyisobutylisonitrile)
- radiotherapy
- astrocytoma
The American Cancer Society estimates that 16,800 new intracranial tumors are diagnosed in the United States each year. In persons older than 20 y, gliomas compose more than 90% of primary intracranial tumors. About 25% of gliomas are low-grade astrocytomas (LGAs). Most LGAs are not amenable to complete resection, and radiotherapy is the most effective nonsurgical therapy (1).
Many low-grade gliomas convert to high-grade gliomas during follow-up. Anatomic distortion and scarring after therapy often impair detection of residual or recurrent disease. Differentiation between tumor recurrence or progression and radiation injury or necrosis is one of the most difficult tasks in oncologic neuroradiology. In addition to clinical findings, contrast-enhanced MRI is used to measure therapy response. Single conventional MRI scans often fail to distinguish recurrent tumor from radiation injury or necrosis, because both cause disturbances of the blood–brain barrier (BBB) leading to nonspecific contrast-medium enhancement. Even biopsy of an edematous or gliotic site is often nondiagnostic.
Functional imaging of tumor metabolism can help overcome this issue. For detection of glioma recurrence, a variety of tracers have been used. Some authors reported that glucose metabolism measured by 18F-FDG PET could differentiate radiation necrosis from recurrent tumor (2), whereas other groups questioned its value (3). Furthermore, SPECT with 3-123I-iodo-α-methyl-l-tyrosine (IMT) for imaging amino acid transport and with the tumor-affine tracer 99mTc(I)-hexakis(2-methoxyisobutylisonitrile) (MIBI) is used frequently, although the value of 99mTc-MIBI has been questioned (4). Few studies have dealt with previously irradiated brain tumors, and those tumors have been mostly of higher grade. Still strongly controversial is the question of which tracer gives more accurate information on tumor progression or recurrence. Therefore, studies directly comparing the diagnostic utility of different tracers for this clinically highly complex and important task have been recommended (5). In a recently published study, we compared the SPECT tracers 123I-IMT and 99mTc-MIBI (6) for sensitivity and specificity. The present prospective study on the follow-up of irradiated LGAs was, to our knowledge, the first receiver-operating-characteristic (ROC) analysis that intraindividually evaluated the diagnostic performance of SPECT tracers (123I-IMT and 99mTc-MIBI) and PET tracers (18F-FDG).
MATERIALS AND METHODS
Patients
We included 17 patients (11 male, 6 female; mean age, 44.5 ± 10.6 y) who initially had biopsy-proven LGAs according to the criteria of the World Health Organization (7). The study was approved by the local ethical committee, and all patients gave informed consent before being included in the study. The patients fasted overnight before administration of tracers. Tracers were injected in a room with dimmed light, no conversation, and low ambient noise coming primarily from the scanner gantry fans. The patients closed their eyes, but their ears were left unplugged to avoid the frontal activation that occurs during total sensory deprivation. Treatment was by stereotactic radiotherapy (59.0 ± 4.4 Gy). On average, 35.3 ± 21.0 mo after radiotherapy, the patients presented with new gadolinium-diethylenetriaminepentaacetic acid (DTPA)–enhancing lesions (n = 26) on MRI, which, at that time, could not differentiate between progressive tumor (PT) and non-PT (nPT). Tumor invasiveness and heterogeneity can lead to the appearance of multiple separate gadolinium-DTPA–enhancing lesions during the course of the disease. Multifocal lesions can appear as separate distinct masses, because different grades of tumor, with variable regions of BBB disruption and gadolinium-DTPA enhancement, may exist within the same tumor. The MRI examination was closely followed by PET or SPECT. Lesions were classified as PT or nPT on the basis of prospective follow-up (through clinical examination, MRI, and proton MR spectroscopy) for 26.6 ± 6.6 mo after PET or SPECT. The 17 patients were studied as part of a larger group of consecutive LGA patients in whom gadolinium-DTPA-enhancing lesions had developed during follow-up. The inclusion criterion was the feasibility of a clear-cut classification into PT or nPT during follow-up after PET or SPECT. In the PT group (17 lesions), patients received 59.3 ± 3.9 Gy. The interval between radiotherapy and PET or SPECT was 39.1 ± 21.4 mo. Lesions were followed up for an additional 24.6 ± 5.6 mo after PET or SPECT until the final classification was made. The patients in the nPT group (9 lesions) received 58.5 ± 5.3 Gy. In this group, the interval between radiotherapy and PET or SPECT was 27.7 ± 18.9 mo and the follow-up after PET or SPECT was 30.3 ± 6.9 mo. The classification was not influenced by the results of PET or SPECT. MRI, including multiplanar T1-weighted and T2-weighted spin-echo imaging followed by multiplanar gadolinium-DTPA-enhanced T1-weighted imaging, was repeated every 3–6 mo using a 1.5-T MRI scanner (Siemens AG). Intervals were shortened if symptoms worsened. A lesion was classified as PT if the T2-weighted hyperintense area increased by more than 25% or if the gadolinium-DTPA-enhancing area enlarged. Repeated proton MR spectroscopy, because shown to improve differentiation between treatment-induced necrosis and residual or recurrent brain tumor, was included in the MRI protocol in ambiguous cases (8). The combined MRI/1H-MR spectroscopy examination included multiplanar T1-weighted and T2-weighted spin-echo imaging and single-voxel 1H-MR spectroscopy (point-resolved spectroscopy; repetition time = 1,500 ms, echo time = 135 ms) of lesions, followed by multiplanar gadolinium-DTPA-enhanced T1-weighted MRI. The horizontal or frequency axes were normalized to a strong signal of known origin, and the locations of the peaks were given as parts per million relative to the known signal. The relative signal intensity ratios for choline (3.20 ppm, membrane phospholipid turnover), creatine (3.93 and 3.04 ppm, cellular energy metabolism), and N-acetyl-aspartate (2.02 ppm, neuronal integrity) were calculated.
99mTc-MIBI SPECT
Preparation and quality control of 99mTc-MIBI (sestamibi; DuPont Pharma S.A.) were according to the manufacturer’s instructions. In 16 patients, SPECT was started 15 min after intravenous injection of 695 ± 65 MBq of 99mTc-MIBI. SPECT was performed using a dual-head γ-camera (MULTISPECT2; Siemens) equipped with high-resolution collimators. Sixty-four projections were obtained over 360°. Data were registered for 40 s in each projection and were recorded in a 64 × 64 matrix. Images were reconstructed by filtered backprojection using a Butterworth filter (frequency cutoff = 0.5 Nyquist; order = 8). Attenuation correction (first-order, 0.12/cm) was performed using the postreconstruction method of Chang (9).
123I-IMT SPECT
To prevent possible uptake of free iodine, the thyroid gland was blocked with sodium perchlorate. 123I-IMT was prepared using essentially the KIO3/123I-iodide method described previously (10). 123I-IMT accumulates in brain and tumor tissue, reaching a maximum after 15 min, with a washout of 20%–45% at 60 min after injection (11). Therefore, in all 17 patients, imaging began 10 min after intravenous injection of 285 ± 59 MBq 123I-IMT. The γ-camera system (MULTISPECT 2) was the same as for the sestamibi examination, but equipped with medium-energy collimators, as recommended for 123I (12). Sixty-four projections (40 s each) were acquired over 360° using a 64 × 64 matrix. Images were reconstructed by filtered backprojection using a Butterworth filter (frequency cutoff = 0.5 Nyquist, order = 8). First-order attenuation correction (0.12/cm) was performed, using Chang’s method (9).
18F-FDG PET
In all 17 patients, 209 ± 40 MBq of 18F-FDG were injected. Starting 45 min after injection, a 20-min emission scan was acquired, followed by a 5-min transmission scan using 3 68Ge line sources. Measurements were obtained with a whole-body PET system (ECAT EXACT HR+; CTI) covering 155 mm in the axial field of view (63 transversal slices; thickness of each slice, 2.4 mm). The scanner consisted of 4 rings, each having 72 bismuth germanate detector blocks. Data were acquired in the more sensitive 3-dimensional mode without interslice tungsten septa. Quantification in 3-dimensional mode was found to be equivalent to that in the 2-dimensional mode for radioactivities used clinically (13). The matrix size was 128 × 128 pixels. Iterative image reconstruction used the ordered-subsets expectation maximization algorithm.
Data Analysis
The images were analyzed by calculating lesion-to-normal ratios (l/n). Areas of abnormal tracer uptake were defined as focally increased uptake or as asymmetric uptake, compared with the contralateral side. Uptake ratios were calculated using reference regions in the contralateral hemisphere, because of the limitations of SPECT in providing absolute quantification. Regions of interest (ROIs) were delineated on the 2 transaxial slices with the highest tracer uptake in the lesion. The scanner software was used to place ROIs over the lesions, to include all pixels having at least 70% of the maximum uptake of the lesion. For this purpose, the cursor was manually positioned at the border of the lesion. A circular contour was generated automatically, starting and ending at this point and including the same percentage as the maximum pixel value in this area. Then, the percentage was adjusted to 70% of the maximum pixel value in this area. Afterward, a mean was calculated from this particular set of pixels. Some gadolinium-DTPA–enhancing lesions showed no elevated uptake of 123I-IMT, 99mTc-MIBI, or 18F-FDG. In these patients, ROIs were placed in accord with the MRI reference. Because a 70% threshold could not be determined, ROIs were defined manually in these cases. For that purpose, MRI scans were visually inspected and ROIs were manually delineated on PET and SPECT scans, enclosing the gadolinium-DTPA–enhancing lesion on MRI. Afterward, a mean was calculated from this particular set of pixels. 123I-IMT and 99mTc-MIBI uptake was measured semiquantitatively by calculating l/n ratios for all gadolinium-DTPA–enhancing lesions. As a reference region, the lesion ROI was mirrored to the contralateral hemisphere. Software automatically performed the mirroring procedure, which approximated the interhemispheric fissure. In all patients, the position of the contralateral ROI was manually adjusted to fit the exact position of the lesion ROI. In cases of anatomic distortion secondary to mass effects or edema, visually inspected MRI scans were considered.
The calculation of ratios based on uninvolved contralateral structures was recommended for analysis of 18F-FDG PET studies of the brain (14). Although the possibility cannot be excluded that the contralateral hemisphere might exhibit reduced metabolism because of interruption of association fibers between hemispheres, this effect has been shown to be negligible (15). For 18F-FDG, semiquantitative l/n ratios based on a separate ROI determining the mean uptake of the uninvolved contralateral gray matter (70% isocontour), as a reference, were calculated (14,16).
For conventional statistical analysis, SigmaStat software (version 2.0; Jandel Corp.) was used. The Mann–Whitney rank sum test was used to compare the PT and nPT groups.
The choice of cutoff values is arbitrary, and one can obtain different results by selecting different values. A general solution to the arbitrary-thresholds problem is the ROC curve. One selects many cutoff points, calculates the sensitivity and specificity for each cutoff value, and plots sensitivity against 1 − specificity. Such a curve describes the compromises that can be made between sensitivity and specificity and is helpful to determine a clinically adequate cutoff. Another advantage of this method is that the area under the ROC curve (Az) tends to be robust, even when the normality assumption is violated. The shapes of the underlying populations do not significantly affect Az. Relative to traditional methods, ROC methods better estimate predictive power because of their independence from cutoff values and their attention to the impact of prevalence on optimal cutoff values.
The diagnostic accuracy of 123I-IMT, 99mTc-MIBI, and 18F-FDG was analyzed using the ROCKIT 0.9B software package for Windows (Microsoft) developed by Charles E. Metz (University of Chicago). The Az and its SE (SE [Az]) were calculated as a measure of the likelihood of a correct test decision using a global decision variable (17). This measure represents the predicted diagnostic accuracy of the diagnostic tests and is independent of disease prevalence and decision-making threshold. Another goal was to find optimized l/n decision thresholds for adequate tradeoffs between sensitivity and specificity. Az was calculated parametrically with a bivariate binormal model. The ROCKIT software categorizes continuously distributed input data to produce a spread of operating points on each ROC curve. The datasets are then analyzed to obtain maximum-likelihood estimates of the conventional binormal intercept, slope, and category-boundary parameters. Differences in the areas under the ROC curves (Az) were tested for significance using a bivariate χ2 test of the simultaneous differences between the “a” and “b” parameters describing the 2 ROC curves (null hypothesis: the datasets arose from the same binormal ROC curve). A true-positive fraction (TPF) test was conducted at false-positive fraction (FPF) = 0.05, FPF = 0.1, and FPF = 0.2 (i.e., specificities of 95%, 90%, and 80%, respectively) to compare the sensitivity of the tracers at low FPFs. FPF was defined as 1 −specificity. Sensitivity (synonym for TPF) was defined as number of true positives/(number of true positives + number of false negatives), and specificity was defined as number of true negatives/(number of true negatives + number of false positives). The TPF test is a univariate z score test of the difference between the TPFs on the 2 ROC curves at a selected FPF (null hypothesis: the datasets arose from the same binormal ROC curve, having the same TPF at the selected FPF).
For all tests, the 0.05 level was considered statistically significant. Because 3 tracers were used, the Bonferroni-corrected P value was 0.05/3 = 0.017.
RESULTS
99mTc-MIBI SPECT
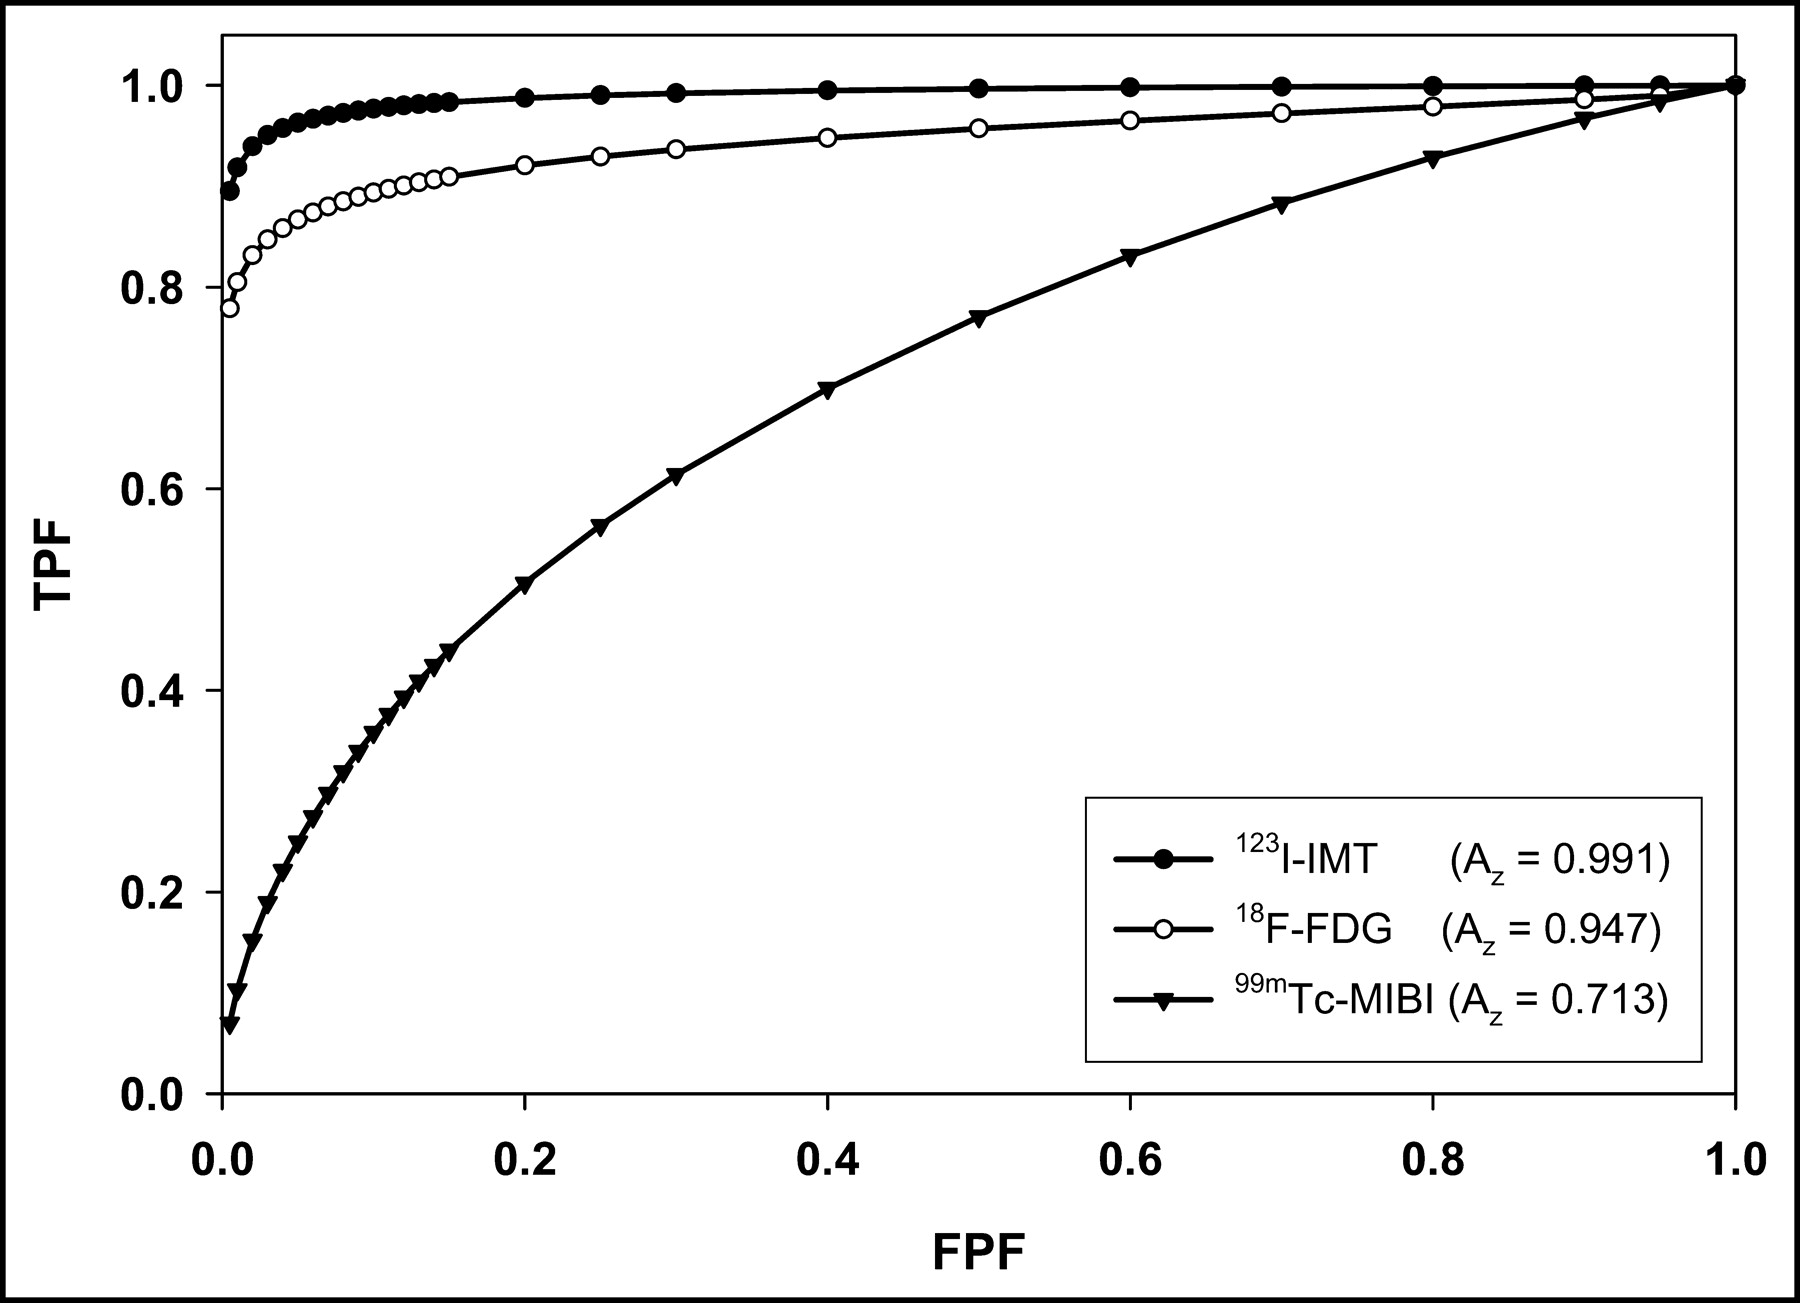
In the nPT group, l/n ratios varied from 1.0 to 7.0, with a mean (±SD) of 1.8 ± 1.8. L/n ratios in the PT group ranged from 1.0 to 8.6, with a mean of 3.7 ± 2.8. For the whole population of patients, the mean l/n ratio was 3.0 ± 2.6. PT and nPT did not significantly differ (P = 0.206) (Fig. 1). Using 99mTc-MIBI, the Az (±SE) was 0.713 ± 0.170 (Fig. 2; Table 1). Differences in Az between examined tracers were tested for significance using a χ2 test as well as t tests conducted at different FPFs ranging from 0.05 to 0.2. When 99mTc-MIBI was compared with both 123I-IMT and 18F-FDG, differences were highly significant (Table 2). A merely acceptable trade-off between sensitivity and specificity for separating PT from nPT was found at l/n thresholds of 1.3–1.5. At these decision thresholds, FPF ranged from 0.23 to 0.25 and TPF ranged from 0.54 to 0.55 (Table 3).

L/n ratios (mean ± SD) for 123I-IMT, 18F-FDG, and 99mTc-MIBI. In contrast to 99mTc-MIBI, both 123I-IMT and 18F-FDG allow highly significant differentiation between PT and nPT groups.

ROC curves for 123I-IMT, 18F-FDG, and 99mTc-MIBI.
Az, SE (Az), and Parameters “a” (Ordinate Intercept) and “b” (Slope) Describing the ROC curves for 18F-FDG, 123I-IMT, and 99mTc-MIBI
P Values for Differences in ROC Curves, Tested for Significance Using the Bivariate χ2 Test and the TPF test at Different FPFs
Decision Thresholds (I/n) for 99mTc-MIBI
123I-IMT SPECT
L/n ratios in the PT group ranged from 1.2 to 2.8, with a mean of 1.7 ± 0.3 (Fig. 1). The l/n ratios in the nPT group varied from 1.0 to 1.3, with a mean of 1.1 ± 0.1. Significantly higher ratios were found in PT than in nPT (P < 0.001) (Fig. 1). Az as a measure of the likelihood of a correct test decision with a global decision variable was 0.991 ± 0.014 for 123I-IMT (Fig. 2; Table 1). Testing for significance of differences in Az using χ2 and FPF tests revealed highly significant differences between 123I-IMT and 99mTc-MIBI. In contrast, Az did not significantly differ between 123I-IMT and 18F-FDG (Table 2). 123I-IMT demonstrated a good trade-off between sensitivity and specificity at l/n thresholds between 1.27 and 1.35. For these decision thresholds, FPF ranged from 0.02 to 0.05 and TPF ranged from 0.94 to 0.96 (Table 4). There was only a moderate correlation between l/n ratios of 123I-IMT and 18F-FDG (r = 0.64) and only a weak correlation between 123I-IMT and 99mTc-MIBI (r = 0.53).
Decision Thresholds (I/n) for 123I-IMT
18F-FDG PET
In the PT group, l/n ratios ranged from 0.2 to 2.0, with a mean of 1.1 ± 0.5. The l/n ratios in the nPT group varied from 0.4 to 0.7, with a mean of 0.5 ± 0.1 (Fig. 1). Using 18F-FDG, significantly higher l/n ratios were found in the PT group than in the nPT group (P < 0.001) (Fig. 1). The Az was 0.947 ± 0.052 for 18F-FDG (Fig. 2; Table 1). χ2 and FPF tests for evaluation of Az revealed highly significant differences between 18F-FDG and 99mTc-MIBI. In contrast, Az was not significantly different between 18F-FDG and 123I-IMT (Table 2). Using l/n thresholds between 0.6 and 0.8, 18F-FDG demonstrated a good trade-off between sensitivity and specificity. For these decision thresholds, FPF ranged from 0.02 to 0.05, whereas TPF ranged from 0.83 to 0.86 (Table 5).
Decision Thresholds (I/n) for 18F-FDG
DISCUSSION
Although a comparison of different tracers for this clinically relevant task has been proposed (5), no study applying 18F-FDG, 123I-IMT, and 99mTc-MIBI in the same population has, to our knowledge, been published. Furthermore, the studies using one of these tracers included only small numbers of irradiated low-grade tumors. We investigated the classification accuracy of these tracers using ROC analysis. Az represents the predicted diagnostic accuracy of the diagnostic tests and, unlike sensitivity and specificity, is independent of disease prevalence and decision-making threshold. Because the shape of the ROC curves for different tracers can vary, even with the same Az parameter, the sensitivity at low FPFs (i.e., high specificity) was also investigated. As in most other studies, the classification of our patients relied on clinical follow-up and not on biopsy. Particularly after irradiation, gliomas are not homogeneous. Even stereotactically guided biopsy is often inaccurate, because samples may be taken from scarred or gliotic areas and not necessarily represent total tumor viability (18). Furthermore, the presence of morphologically intact tumor cells did not indicate recurrence or progression, because these cells may be unable to proliferate after therapy. In our series of patients, lesions were classified on the basis of prospective clinical follow-up, including serial MRI and proton MR spectroscopy for an average of 26.6 mo after PET or SPECT for a suggestive new cerebral lesion, and 61.9 mo after completion of radiotherapy. Also, survival of patients with low-grade gliomas is prolonged, and long follow-up times are necessary. We believe that a mean prospective follow-up of 26.6 mo after the appearance of new areas of contrast enhancement (suggestive of anaplastic tumor areas) on MRI is sufficient to distinguish real progress from a radiation-induced disturbance of the BBB. Progressive disease was confirmed by repeated MRI, which showed further enlargement of the contrast-enhanced areas, and by MRI spectroscopy examinations. MRI was repeated every 3–6 mo. Intervals were shortened if symptoms worsened or MRI showed progression. The suspected higher-grade anaplastic tumor parts are much more aggressive than genuine low-grade gliomas. Karim et al. reported a progression-free median survival of approximately 5.5 y after radiotherapy of low-grade gliomas. However, in progressive disease, the median overall survival was only 24 mo (19). In addition, our follow-up period is one of the longest reported and is more than 4-fold longer than those of comparable studies (20–22).
The difference between the Az of 99mTc-MIBI (0.713) and the Az of the other tracers used in our study was highly significant (Table 2). 99mTc-MIBI SPECT examinations resulted in low accuracy and, especially, in poor sensitivity even at modest specificity values. The results of the more elaborate ROC analysis using variable cutoff values agreed with our previous results comparing 99mTc-MIBI and 123I-IMT at a fixed cutoff value (l/n = 1.3), resulting in a distinctly higher sensitivity and specificity for 123I-IMT (6). In contrast to 18F-FDG and 123I-IMT, 99mTc-MIBI did not allow exclusion of PT, because of its high rate of false-negative results. Uptake of 99mTc-MIBI is determined by multiple factors, such as vascular supply; disruption of the BBB; density, viability, and oxygenation of tumor cells; and mitochondrial membrane potential (23). Furthermore, in delayed imaging (2–4 h after injection), uptake is related to the expression of the multidrug resistance pump P-glycoprotein (24). When 99mTc-MIBI was applied to pretreated high-grade gliomas, promising results were reported (21), whereas studies examining miscellaneous tumor grades showed sensitivities of 73%–88% for detecting tumor relapse. Specificity was 85%–91%, PPV was 91%–98%, and NPV was 60%–63%, respectively (20,22). However, the study reporting the highest values included only a small percentage (27%) of low-grade tumors (20). In contrast, the lowest sensitivities and specificities were observed in the study with the highest percentage (50%) of low-grade gliomas (22). In 6 previously irradiated gliomas, solely of low grade, 99mTc-MIBI could not differentiate between tumor and radiation necrosis (25). Staudenherz et al. recently questioned the value of 99mTc-MIBI for the detection of high-grade recurrences after chemotherapy and suggested that retention of 99mTc-MIBI reflects simply damage of the BBB (4). Within 5 y after initial diagnosis, at least 50% of LGAs undergo malignant transformation and a BBB disruption develops (26). However, BBB disruption also occurs in radiation necrosis. Accordingly, gadolinium-DTPA enhancement on MRI indicated damage of the BBB in all our patients, as a prerequisite for 99mTc-MIBI uptake. In accordance with previous reports, we also found the detectability of paraventricular lesions to be limited (27). The explanation was the high physiologic 99mTc-MIBI uptake in the choroid plexus. The low tumor-detection rate of 99mTc-MIBI, compared with that of 123I-IMT, could not be explained by technical issues, because the same camera system and acquisition parameters were used for both SPECT tracers.
123I-IMT yielded the best ROC characteristics and the highest classification accuracy, with an Az of 0.991. For decision thresholds (l/n) between 1.25 and 1.35, 123I-IMT offered a good trade-off between sensitivity (>94%) and specificity (>93%). Choosing an l/n threshold of 1.35, associated with a high specificity of 98%, resulted in only a slight reduction of sensitivity—to 94%. Az was significantly higher for 123I-IMT than for 99mTc-MIBI (Az = 0.713) but not for 18F-FDG (Az = 0.947). Because competition of 123I-IMT with structurally related naturally occurring l-amino acids for transport into brain and tumor could decrease sensitivity (28), we examined all patients while they were fasting. In contrast to 11C-tyrosine, 123I-IMT uptake reflects amino acid transport rather than the protein synthesis rate, because it is not incorporated into proteins. Both protein synthesis and amino acid transport are accelerated in high- and low-grade tumor tissue. The l-carrier system for large neutral amino acids mediates transport across the intact BBB (28). Because 123I-IMT is not metabolized, it is washed out of the brain after reaching a maximum uptake at 15 min after injection (11,29). Excepting a few extracerebral applications, such as carcinomas of the hypopharynx or larynx (30), 123I-IMT has been used mostly for brain tumors. It was shown to be promising for evaluating biologic activity and delineating intracerebral infiltration of gliomas (11,16,31). Most studies using 123I-IMT during follow-up after treatment of brain tumors have included only a limited number (n ≤ 5) of low-grade tumors (32,33). In one of the largest series, cerebral uptake of 123I-IMT was determined in 27 patients, including 9 with low-grade tumors, of whom 3 underwent radiotherapy. In this study, the overall sensitivity for detecting recurrences was 78% and the specificity was 100% (5). Also, classification with 18F-FDG was highly accurate. Its Az (0.947) was somewhat (but not significantly) lower that that of 123I-IMT, mainly because of the slightly lower sensitivity of 18F-FDG (Fig. 2B). With 18F-FDG PET, one might question whether gray matter or white matter should be used as a reference for semiquantitative analysis. For that reason, we additionally analyzed our PET data using white matter as a reference (data not shown). A close correlation was found between the l/n ratios based on gray-matter and white-matter reference regions (r = 0.95). Az for gray matter (0.947) was slightly higher than Az for white matter (0.921). Az did not significantly differ between gray and white matter (P = 0.7). In the pretherapeutic setting, 18F-FDG PET has proven useful in grading gliomas (18,34), assessing prognosis (35), and localizing the most aggressive areas before biopsy (18). In gliomas, 18F-FDG uptake correlates with the grade of malignancy (34). For many years, 18F-FDG PET has been regarded as the gold standard for noninvasive differentiation between radiation necrosis and recurrent high-grade gliomas, which exhibit increased glucose metabolism. For high-grade gliomas, the sensitivity ranges from 80% to 90%, whereas the specificity is between 50% and 90% (36). According to the literature, malignant progression is common in nearly two thirds of all recurrent LGAs. This finding is in accordance with the mean 18F-FDG uptake in our PT group, slightly exceeding the mean uptake in cortical reference regions. Studying 13 patients with irradiated LGA, Roelcke et al. concluded that patients with tumors undergoing malignant progression during the course of the disease can be identified with 18F-FDG PET (37). In contrast, other reports have indicated limitations because of the low l/n contrast. Ricci et al. reported a sensitivity of 73% and a specificity of only 56% for the detection of recurrences (3). The specificity of 18F-FDG PET can be limited by an increased glycolysis in tissue reparation after surgery or radiotherapy and in inflammatory lesions (38). The sensitivity of 123I-IMT SPECT (75%) for confirming low-grade recurrences (n = 8) proved to be superior to that of 18F-FDG PET (50%), whereas specificity could not be calculated in the study of Bader et al. (39). Sensitivity for detection of low-grade tumors, tumor progression, or tumor recurrence and clear definition of tumor extension can be reduced because of high glucose metabolism in surrounding normal brain tissue. Labeled amino acids may overcome this problem because of their low uptake in normal brain. As demonstrated with autoradiography, amino acids play a minor role in the metabolism of inflammatory cells, resulting in higher specificity for 123I-IMT SPECT than for 18F-FDG (40). Therefore, they were presumed to be more suitable for monitoring response to radio- or chemotherapy (41).
In prospect, the combination of the higher resolution of PET and a tracer that can image amino acid transport might be promising for further increasing the accuracy of classification, especially in small lesions. Recently, the synthesis of the 18F-labeled amino acids 18F-fluoro-ethyl-l-tyrosine and 18F-fluoro-α-methyl-tyrosine was reported (40). Like 123I-IMT SPECT, these tyrosine analogues reflect amino acid transport, and because of their 18F label, they can benefit from the higher resolution of PET. Further clinical studies are required to determine their suitability for detecting tumor progression in irradiated LGA.
CONCLUSION
This multitracer ROC analysis of patients with irradiated LGA indicated that imaging of amino acid transport with 123I-IMT SPECT had a high classification accuracy for detecting tumor progression. Despite its considerably higher spatial resolution in comparison with 123I-IMT SPECT, the classification accuracy of 18F-FDG PET was somewhat lower. The classification accuracy of both 123I-IMT and 18F-FDG was substantially higher than that of 99mTc-MIBI SPECT, which had limited value in the follow-up of these patients.
Acknowledgments
The authors thank Stephanie Biedenstein, Heidi Adam, and Christian Schoppa for kind technical assistance with this study.
Footnotes
Received Jul. 8, 2003; revision accepted Dec. 8, 2003.
For correspondence or reprints contact: Marcus Henze, MD, Department of Nuclear Medicine, University of Heidelberg, Im Neuenheimer Feld 400, 69120 Heidelberg, Germany.
E-mail: marcus.henze{at}med.uni-heidelberg.de


