


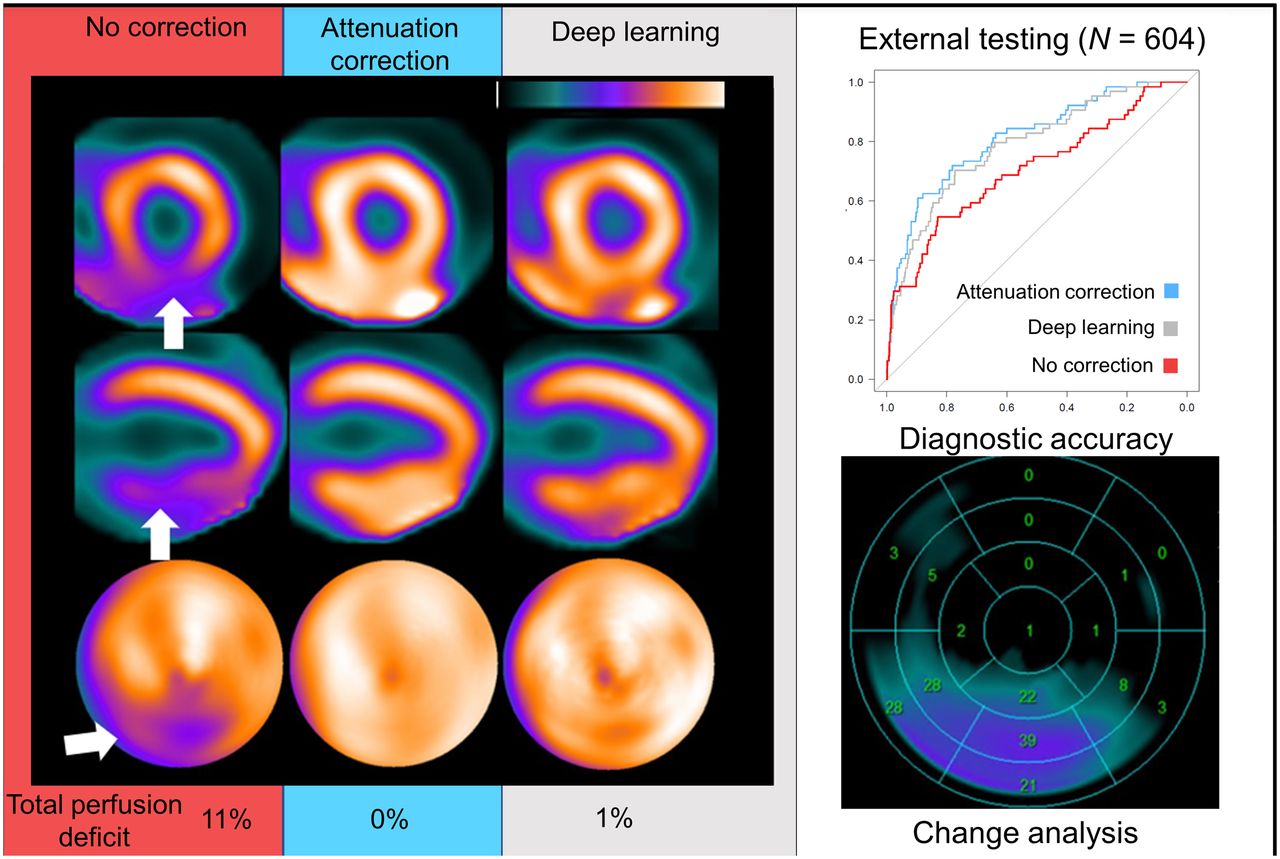
Visual Abstract

Abstract
To improve diagnostic accuracy, myocardial perfusion imaging (MPI) SPECT studies can use CT-based attenuation correction (AC). However, CT-based AC is not available for most SPECT systems in clinical use, increases radiation exposure, and is impacted by misregistration. We developed and externally validated a deep-learning model to generate simulated AC images directly from non-AC (NC) SPECT, without the need for CT. Methods: SPECT myocardial perfusion imaging was performed using 99mTc-sestamibi or 99mTc-tetrofosmin on contemporary scanners with solid-state detectors. We developed a conditional generative adversarial neural network that applies a deep learning model (DeepAC) to generate simulated AC SPECT images. The model was trained with short-axis NC and AC images performed at 1 site (n = 4,886) and was tested on patients from 2 separate external sites (n = 604). We assessed the diagnostic accuracy of the stress total perfusion deficit (TPD) obtained from NC, AC, and DeepAC images for obstructive coronary artery disease (CAD) with area under the receiver-operating-characteristic curve. We also quantified the direct count change among AC, NC, and DeepAC images on a per-voxel basis. Results: DeepAC could be obtained in less than 1 s from NC images; area under the receiver-operating-characteristic curve for obstructive CAD was higher for DeepAC TPD (0.79; 95% CI, 0.72–0.85) than for NC TPD (0.70; 95% CI, 0.63–0.78; P < 0.001) and similar to AC TPD (0.81; 95% CI, 0.75–0.87; P = 0.196). The normalcy rate in the low-likelihood-of-coronary-disease population was higher for DeepAC TPD (70.4%) and AC TPD (75.0%) than for NC TPD (54.6%, P < 0.001 for both). The positive count change (increase in counts) was significantly higher for AC versus NC (median, 9.4; interquartile range, 6.0–14.2; P < 0.001) than for AC versus DeepAC (median, 2.4; interquartile range, 1.3–4.2). Conclusion: In an independent external dataset, DeepAC provided improved diagnostic accuracy for obstructive CAD, as compared with NC images, and this accuracy was similar to that of actual AC. DeepAC simplifies the task of artifact identification for physicians, avoids misregistration artifacts, and can be performed rapidly without the need for CT hardware and additional acquisitions.
SPECT myocardial perfusion imaging (MPI) is frequently used to evaluate patients for the presence of obstructive coronary artery disease (CAD) (1). Abnormalities of regional perfusion are used to identify patients with a higher likelihood of having obstructive CAD (1,2). However, perfusion abnormalities can be similar in appearance to soft-tissue photon attenuation artifacts.
Attenuation correction (AC) can be provided through CT (CTAC) (3) and has been shown to improve the diagnostic accuracy of SPECT MPI and increase specificity from 81% to 88% (4). AC imaging has been proposed as an important method to significantly increase the proportion of patients who are candidates for rest scan cancellation (5). However, CTAC requires dedicated, expensive SPECT/CT scanners and is associated with additional radiation exposure. Importantly, misregistration of the separately acquired SPECT and CTAC maps is often a source of artifacts, requiring careful quality control and potentially diminishing the clinical value of AC images (6). For these reasons, despite its advantages, CTAC is currently performed on a minority of SPECT MPI scans. This is especially true for the latest generation of solid-state scanners, on which CTAC is performed in less than 5% of sites (written communication between Cory McNeil and Robert Miller, June 9, 2022) and is available from only 1 vendor.
To provide the benefits of AC without the above shortcomings, we developed and evaluated a deep learning model (DeepAC) that applies AC directly to non-AC (NC) short-axis images, without the use of CT (or the need for reconstruction of the data), by generating simulated AC images. DeepAC is a conditional generative adversarial network that comprises 2 competing networks. A generator is tasked with creating DeepAC images, whereas a discriminator differentiates the DeepAC images from actual AC images. The process is repeated until the discriminator network is no longer able to differentiate real AC images from fake AC images. Importantly, physicians are able to better evaluate DeepAC SPECT images for potential artifacts and myocardial segmentation errors.
In this study, we compared image quantification of NC images to CT-based AC and DeepAC images. In an independent external dataset, we compared the diagnostic accuracy of quantitative perfusion analysis for obstructive CAD, DeepAC, NC, and CT-based AC imaging. We also performed a change analysis to better understand the potential improvement in DeepAC images compared with actual AC images.
MATERIALS AND METHODS
Patient Populations
We included 2 separate populations from separate centers. The model was trained with 4,886 patients (45% female) from a single center (Yale University) who underwent SPECT MPI with CTAC (details in Supplemental Table 1; supplemental materials are available at http://jnm.snmjournals.org). The model was then tested in an external population of 604 patients (48% male) from 2 different centers (University of Zurich and University of Calgary). All data and images were deidentified and transferred to Cedars–Sinai. The study protocol complied with the Declaration of Helsinki and was approved by the institutional review boards at each participating institution. The overall study was approved by the institutional review board at Cedars–Sinai Medical Center. Written informed consent or a waiver of consent was obtained at each institution.
SPECT Image Acquisition
All scans were performed per SPECT/CT MPI guidelines (7), and only stress images were used in the present analysis. In the training population, patients underwent stress–rest/stress-only (n = 4,112, 84%), rest–stress (n = 684, 14%), or 2-day (n = 90, 2%) imaging using 99mTc-tetrofosmin with a Discovery 570c or Discovery 530c scanner (GE Healthcare). In the external testing populations, patients underwent either a 99mTc-sestamibi rest–stress or a 99mTc-tetrofosmin stress–rest protocol with a Discovery 570c scanner (GE Healthcare). Weight-adjusted (±standard deviation) stress imaging doses of 403 ± 207 MBq (4.8 ± 2.5 MBq/kg, 10.9 ± 5.6 mCi) and 413 ± 157 MBq (5.0 ± 1.9 MBq/kg, 11.2 ± 4.2 mCi) were used in the training population and the external population, respectively. Stress images were acquired 15–60 min after stress over a total of 4–6 min (7). Patients underwent exercise or pharmacologic stress using standard clinical parameters. Details of the CT acquisitions and image quality control are available in the supplemental materials.
Model Architecture
The model architecture is outlined in Figure 1. The DeepAC model was developed using 4,886 (training, 4,398; validation, 488) pairs of NC and AC short-axis SPECT slices from stress acquisitions from a single site. Our proposed method focuses on CT-free direct estimation of SPECT AC generation and is independent of any imaging information from CT (8). Ground truth short-axis SPECT AC images (reconstructed at 4 × 4 mm with a slice thickness of 4 mm) were used to compare DeepAC. Additional details are available in the supplemental materials (9–14).

Model architecture for conditional generator adversarial network. First, generator network creates simulated AC images from NC images. Discriminator is tasked with differentiating actual AC images (real) from DeepAC images (fake). Generator is attention-gated 3D UNet, for which maximum pooling (MaxPool) downsamples features. Attention gate takes input from lower level (attention signal) with skipped connection; it includes rectified linear unit (ReLU) as nonlinear activation and generates attenuation map, which is concatenated to upsampled level. This helps generator network focus on essential image structures.
Processing Speed
Batch mode was used for model testing. Using a graphics processing unit (GeForce RTX 2080; NVIDIA Corp.), the mean time to generate DeepAC image volume from AC volume was 9 ms. Using a computer similar to a standard reporting workstation (AMD Ryzen 9 5950X 16-core processor, 64 Gb of random-access memory), the mean inference time was 66 ms.
Quantitative Image Analysis
All quantitative image comparisons were performed on the external testing population. Stress total perfusion deficit (TPD) was quantified with Quantitative Perfusion SPECT software (Cedars–Sinai Medical Center) (15). Quantification of TPD for DeepAC images was performed using existing sex-specific databases for AC studies. Additionally, we used change analysis, as implemented in clinical software to perform voxel-by-voxel comparisons among AC, NC, and DeepAC images (16). The change analysis allows derivation of the positive and negative count change between image pairs (sum of absolute voxel-by-voxel count changes in both directions) without normal databases. Positive change integrates image voxels with an increase in counts on AC images, and negative change integrates voxels for which AC images have decreased counts compared with NC images. Thus, positive change identifies perfusion defects that are corrected by the reference technique, and negative change identifies relative perfusion defects unmasked by the reference technique. Change analysis can be used clinically to detect subtle differences in image sets; for example, when comparing stress and rest images, it could be used to identify areas of ischemia (16). This analysis was also performed on a per-vessel basis.
Diagnostic Accuracy for Obstructive CAD
Diagnostic accuracy was assessed in patients with same-day SPECT and coronary CT angiography (n = 280) and a low likelihood of coronary disease (LLK) (n = 324). Patients from the University of Zurich underwent coronary CT angiography on the same day as SPECT MPI. Obstructive CAD was defined as any stenosis of at least 70% or at least 50% in the left main coronary artery. To ensure that the prevalence of obstructive CAD was similar to that seen in a suspected CAD referral cohort, the population was enriched with an LLK population from the University of Calgary. The LLK population included patients who did not undergo revascularization within 90 days of SPECT MPI and met the following criteria: low probability of CAD based on the Diamond–Forrester model (17), normal findings on expert visual interpretation of perfusion, coronary artery calcium score of 0, and left ventricular ejection fraction of more than 50%. We also evaluated diagnostic accuracy on a per-vessel basis, with left main disease attributed to both the left anterior descending and the left circumflex territories.
Statistical Analysis
Standard descriptive statistics were used. Normality for continuous variables was assessed with the Shapiro–Wilks test. Continuous variables were not found to have a normal distribution, and the difference in median was assessed using the Wilcoxon signed-rank test. The Pitman–Morgan test was used to compare variance between the differences in AC and DeepAC and AC and NC data. Diagnostic accuracy for obstructive CAD was assessed using area under the receiver-operating-characteristic curve (AUC). The DeLong test was used to evaluate for differences in AUC. Lastly, we evaluated normalcy rates in the LLK population, with abnormal quantitative perfusion defined as a stress TPD of more than 3% (integer) (4).
All statistical tests were 2-sided, with a P value of less than 0.05 considered significant. Statistical analyses were performed using R (version 4.1.2) and Stata/IC (version 14.2; StataCorp).
RESULTS
Population Characteristics
The characteristics of the training and external testing populations are shown in Table 1. Patients in the training population were older (median age, 64 vs. 60 y; P < 0.001) and more likely to be male (55% vs. 48%, P < 0.001) than patients in the testing population.
Characteristics of Training and External Testing Populations
Diagnostic Accuracy
Obstructive CAD was present in 64 of 604 (10.6%) patients in the external testing population, compared with 10.7% in a large randomized controlled trial (18). Diagnostic accuracy for obstructive CAD is shown in Figure 2. The AUC for DeepAC stress TPD (AUC, 0.79; 95% CI, 0.72–0.85) was higher than that for NC TPD (0.70; 95% CI, 0.63–0.78; P < 0.001). There was no difference between the AUC for DeepAC TPD and that for AC TPD (AUC, 0.81; 95% CI, 0.75–0.87; P = 0.196). At 80% sensitivity, the specificity of DeepAC TPD was 64% (cut point ≥ 3.6%), compared with 65% for AC TPD (cut point ≥ 3.3%) and 36% for NC TPD (cut point ≥ 2.0%). Using a standard previously established integer TPD threshold of more than 3% for abnormal, DeepAC had sensitivity of 80% and specificity of 63%, compared with sensitivity of 78% and specificity of 66% for AC TPD and sensitivity of 70% and specificity of 56% for NC TPD. The normalcy rate at this threshold in the LLK population was higher for DeepAC TPD (70.4%) and AC TPD (75.0%) than for NC TPD (54.6%, P < 0.001 for both).

Diagnostic accuracy of obstructive CAD. AUC for AC and DeepAC stress TPD was higher than for NC stress TPD. There was no significant (ns) difference between DeepAC stress TPD and AC stress TPD.
We also assessed diagnostic accuracy for obstructive CAD on a per-vessel level, with the results in Supplemental Table 2. The diagnostic accuracy for left anterior descending disease was significantly higher for DeepAC stress TPD (AUC, 0.77; 95% CI, 0.69–0.86) than for NC TPD (AUC, 0.69; 95% CI, 0.59–0.79; P = 0.007). Diagnostic accuracy was also higher for left circumflex disease for DeepAC stress TPD (AUC, 0.74; 95% CI, 0.60–0.88) than for NC TPD (AUC, 0.60; 95% CI, 0.45–0.76; P = 0.024).
Comparison of AC, NC, and DeepAC SPECT Images
The results of the change analysis are shown in Figure 3. Positive change was significantly lower, representing closer agreement, for AC versus DeepAC (median, 2.4; interquartile range [IQR], 1.3–4.2) than for AC versus NC (median, 9.4; IQR, 6.0–14.2; P < 0.001). However, negative change was similar for AC versus DeepAC (median, 2.0; IQR, 0.9–3.5) and AC versus NC (median, 2.0; IQR, 1.2–3.6, P = 0.935). Similar findings were seen in the subset of patients undergoing stress-first imaging for positive change (AC vs. DeepAC: median, 2.6; IQR, 1.6–4.9; AC vs. NC: median, 12.9; IQR, 8.5–17.8; P < 0.001) and negative change (AC vs. DeepAC: median, 2.7; IQR, 1.5–5.1; AC vs. NC: median, 2.5; IQR, 1.5–4.2; P < 0.001). Results of the per-vessel change analysis are shown in Supplemental Figure 1. Median positive change was significantly higher with AC versus NC than with AC versus DeepAC in the left anterior descending (2.61 vs. 2.02), left circumflex (4.22 vs. 0.32), and right coronary artery territories (18.96 vs. 1.18, P < 0.001 for all).

Change analysis (voxel-by-voxel analysis after subtraction of coregistered images). Actual AC images were reference image for comparisons of AC vs. DeepAC and AC vs. NC images. DeepAC was used as reference for DeepAC vs. NC. Negative change was not significantly different across all comparisons. However, positive change was significantly lower for AC vs. DeepAC than for AC vs. NC images (*P < 0.001).
Absolute differences between AC TPD and DeepAC TPD were lower than absolute differences between AC TPD and NC TPD (median, 1.2 vs. 2.3; P < 0.001) (Fig. 4). The Bland–Altman analysis for TPD is outlined in Supplemental Figure 2. Limits of agreement for AC TPD versus DeepAC TPD (bias, −0.2; 95% limits of agreement, −6.5 to 6.1; Spearman ρ = 0.78) were closer than for AC TPD versus NC TPD (bias, −1.0; 95% limits of agreement, −8.7 to 6.7; Spearman ρ =0.55; P < 0.001).

Absolute differences in stress TPD between AC, DeepAC, and NC values. Median absolute difference was lower for AC vs. DeepAC than for AC vs. NC or DeepAC vs. NC (*P < 0.001).
Case Examples
Cases illustrating AC, DeepAC, and NC images, as well as the concept of positive change analysis, are shown in Figures 5–7.

NC, AC, and DeepAC images from 53-y-old man with body mass index of 36. On short-axis images (top), vertical long-axis images (middle), and polar maps (bottom), there was defect in inferior wall on NC images only (white arrows), with evidence of adjacent radiotracer activity in abdomen. Standard quantification by stress TPD (sTPD) was 11% (abnormal). After AC correction, sTPD was 0%; DeepAC correction resulted in sTPD of 1% (both normal). There was positive change in inferior wall counts for AC vs. NC (red arrow). There was no change between AC and DeepAC images. Patient had no CAD on coronary CT angiography, and defect most likely represents diaphragmatic attenuation.

NC, AC, and DeepAC images from 63-y-old woman with body mass index of 32. On short-axis images (top), vertical long-axis images (middle), and polar maps (bottom), there was defect in anterolateral, inferolateral, and inferior walls on NC images (white arrows). Standard quantification by stress TPD (sTPD) was 21% (abnormal). After AC correction, sTPD was 17%; DeepAC correction resulted in sTPD of 18% (both abnormal). There was positive change in inferior and inferoseptal walls for AC vs. NC (red arrows). There was only small area of positive change in inferolateral wall for AC vs. DeepAC. Patient had 80% stenosis of proximal left circumflex coronary artery.

NC, AC, and DeepAC images from 62-y-old woman with body mass index of 29. On short-axis images (top), vertical long-axis images (middle), and polar maps (bottom), there was defect in inferior and inferoseptal walls on NC images only (white arrows). Standard quantification by stress TPD (sTPD) was 7% (abnormal). After AC correction, sTPD was 2%; DeepAC correction resulted in sTPD of 3% (both normal). There was positive change in inferior and inferoseptal wall counts for AC vs. NC (red arrow). There was no change between AC and DeepAC images. Patient had no CAD on coronary CT angiography.
DISCUSSION
We developed a conditional generative adversarial network deep learning model that directly generates DeepAC images, without CT, from NC images. It eliminates the possibility of CT misregistration, leverages optimized vendor-specific reconstruction algorithms for dedicated collimators and solid-state scanners, and allows physicians to evaluate full image sets for potential artifacts using the same approaches as they would for any other clinical study. The model generates DeepAC images in a fraction of a second on standard computer hardware and could readily be implemented in clinical workflows as an automatic preprocessing step.
Critically, for the first time, we demonstrated that the diagnostic accuracy of DeepAC was higher than that of NC using a large external testing population. Additionally, using clinical quantitative analysis, we conclusively demonstrated that DeepAC images are more similar to AC images than are NC images. The significant improvement in positive change suggests that DeepAC corrects attenuation artifacts relative to NC images. Importantly, similar findings were seen in the subset of patients undergoing stress-first imaging, which typically are noisier images. The absence of difference in negative change suggests that it is not inducing (or uncovering) defects in a manner that would not be expected with actual AC. DeepAC could be applied clinically in laboratories without dedicated SPECT/CT hardware (majority of SPECT MPI laboratories) to increase normalcy rates and diagnostic accuracy, without affecting existing imaging protocols.
Several AI approaches have been proposed recently to generate simulated AC SPECT MPI (9,19–21). Nguyen et al. developed a generative adversarial network to simulate AC images from non-AC data with data from 491 patients for training and 112 for testing, demonstrating a higher structural similarity index than for 3D UNet (19). Chen et al. proposed a dual squeeze-and-excitation residual dense network, trained and tested with 172 studies, using images from 3 scatter windows together with NC images to predict AC images (9). Yang et al. developed a convolutional network to generate simulated AC images directly from NC images using 100 paired datasets for training and testing and 10-fold cross-validation (20). In the only other study that evaluated the clinical impact of the deep learning AC, Hagio et al. developed a convolutional network that generates simulated AC polar maps from NC maps (rather than images) (21). The authors trained and tested the model in a population from a single center, demonstrating improvement in diagnostic accuracy for CAD either in patients with correlating angiography (n = 351) or in LLK cases (n = 327). Improvement in specificity was 26% (higher-quality studies) and 8% (lower-quality studies) in internal testing. However, none of these studies included external testing populations. In the present work, we showed higher diagnostic accuracy with DeepAC than with NC images and up to 28% higher specificity, in a large external testing population from 2 different sites using standard clinical quantification of SPECT MPI. We also showed improved similarity between AC and DeepAC SPECT images as compared with NC images.
There are several aspects of our work that are particularly relevant to future clinical application of the DeepAC model. Our model generates simulated SPECT short-axis images rather than corrected polar maps. This allows physicians to identify potential sources of artifacts such as excessive gut activity and potential errors in myocardial contours. We did not need to exclude cases with surface-mismatch or segmentation errors as was needed in previous polar map–based approaches (21). Our approach leverages existing vendor-specific reconstruction algorithms and could be implemented as a preprocessing step before interpretation with any SPECT MPI interpretation software (22). Importantly, in an independent population, we demonstrated that DeepAC improved diagnostic accuracy for obstructive CAD and normalcy rates, compared with NC SPECT. We used a very conservative definition of LLK, including a coronary artery calcium score of 0 (23), to minimize any chance of misclassifying the presence of obstructive CAD in the absence of defined coronary anatomy. We believe this is the first time the utility of simulated AC was demonstrated conclusively with independent, external testing—a critical step toward demonstrating the generalizability of the technique.
DeepAC could be applied clinically to correct for photon attenuation without the additional radiation exposure, cost, and space required for hybrid SPECT/CT. The algorithm could be applied to correct NC SPECT MPI in subsecond times, avoiding potential issues with image misregistration. Importantly, it could be combined with stress-first imaging. We have previously demonstrated that AI can identify low-risk patients for rest scan cancellation (24). DeepAC imaging could be used to further improve the accuracy of these algorithms.
Our study has a few important limitations. Validation of DeepAC on other SPECT camera systems is needed. Further improvements in diagnostic accuracy may be possible by applying dedicated DeepAC databases. Additionally, we did not assess the performance of the DeepAC model on rest images. Although DeepAC allows for soft-tissue AC, it does not provide the additional anatomic information available from CTAC, such as calcium. Therefore, the benefits of implementing this technique to reduce radiation exposure against the added clinical information available from continuing with CTAC imaging need to be carefully weighed (25). Lastly, whereas the population-level results show improved diagnostic accuracy, physicians will still need to review all available data to ensure that the DeepAC results make sense clinically.
CONCLUSION
We developed a deep learning model that generates DeepAC images from NC reconstructed short-axis slices. DeepAC images provide a quantitative assessment of perfusion which is more similar to actual AC images than NC images are. This translates into improved diagnostic accuracy for obstructive CAD in external testing. DeepAC may simplify the task of artifact identification for physicians compared with NC images alone and can be performed without the need for CTAC hardware.
DISCLOSURE
This research was supported in part by grants R01HL089765 and R35HL161195 from the National Heart, Lung, and Blood Institute/National Institutes of Health (principle investigator, Piotr Slomka). The content is solely the responsibility of the authors and does not necessarily represent the official views of the National Institutes of Health. Robert Miller has received consulting fees and research support from Pfizer. Daniel Berman and Piotr Slomka and Mr. Kavanagh participate in software royalties for Quantitative Perfusion SPECT software at Cedars–Sinai Medical Center. Daniel Berman is a consultant for GE Healthcare, and Edward Miller has served as a GE Healthcare consultant. Piotr Slomka has received research grant support from Siemens Medical Systems. No other potential conflict of interest relevant to this article was reported.
KEY POINTS
QUESTION: Can deep learning be used to generate AC SPECT images directly from non-AC images?
PERTINENT FINDINGS: We developed a method to generate simulated AC images (DeepAC) and compared them with actual AC and non-AC images using a large external testing population. DeepAC images were more similar to actual AC images than were non-AC images and had high diagnostic accuracy similar to that of actual AC images.
IMPLICATIONS FOR PATIENT CARE: The DeepAC model can be applied clinically to generate AC image sets for improved diagnostic accuracy on SPECT systems without CT capability or to help identify patients for rest scan cancellation.
Footnotes
Published online Sep. 22, 2022.
- © 2023 by the Society of Nuclear Medicine and Molecular Imaging.
REFERENCES
- Received for publication June 21, 2022.
- Revision received September 16, 2022.


