


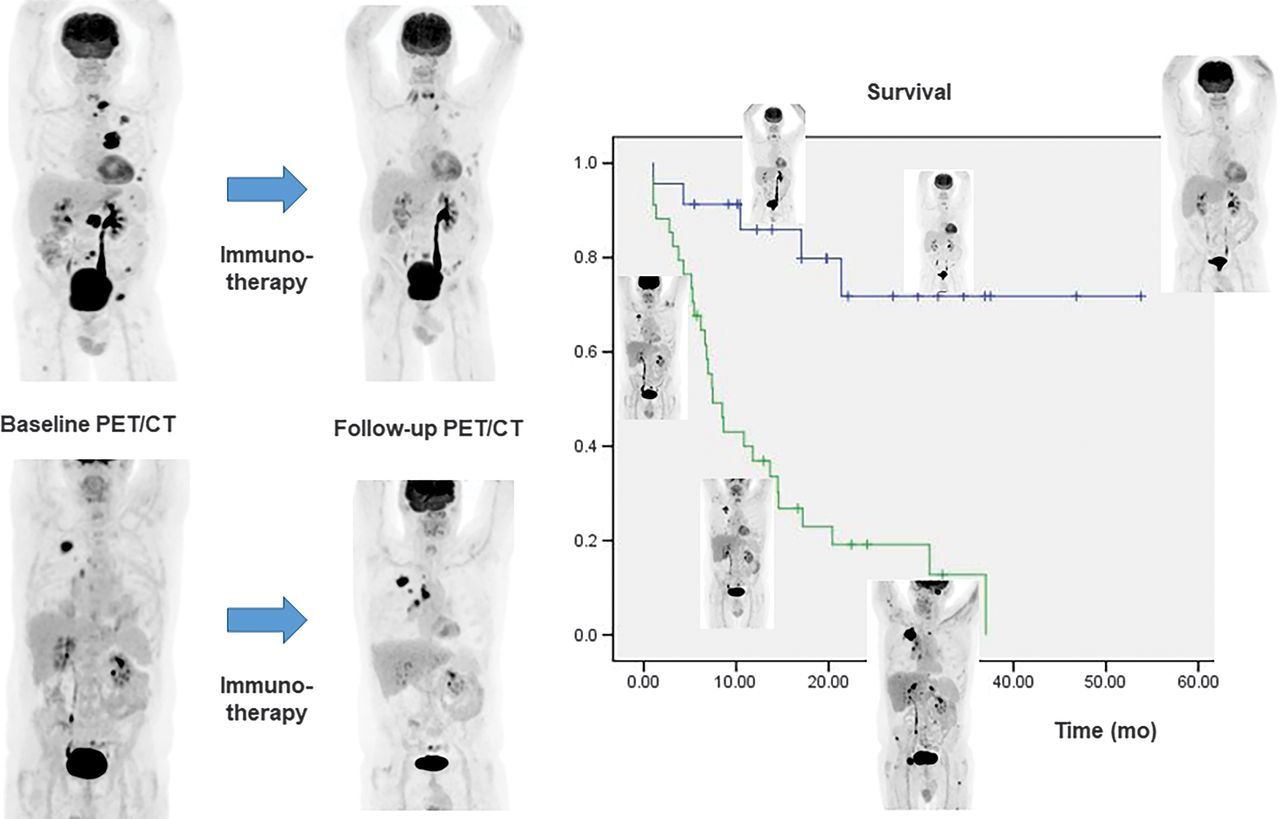
Visual Abstract

Abstract
Immunotherapy using programmed death-1 blockers is a promising modality for non–small cell lung cancer (NSCLC). Therefore, defining the most accurate response criteria for immunotherapy monitoring is of great importance in patient management. This study aimed to compare the correlation between survival outcome and response assessment by PERCIST, version 1.0; immunotherapy-modified PERCIST (imPERCIST); RECIST, version 1.1; and immunotherapy-modified RECIST (iRECIST) in NSCLC patients. Methods: Seventy-two patients with NSCLC who were treated with nivolumab or pembrolizumab and had baseline and follow-up 18F-FDG PET/CT data were analyzed. The patients were categorized into responders (complete or partial response) and nonresponders (stable or progressive disease) according to PERCIST1 and PERCIST5 (analyzing the peak SUV normalized by lean body mass [SULpeak] of 1 or up to 5 lesions), imPERCIST1, imPERCIST5, RECIST, and iRECIST. The correlation between achieved response and overall survival (OS) was compared. Results: The overall response rate and the overall disease control rate of the study population were 29% and 74%, respectively. The OS and progression-free survival (PFS) of patients with complete and partial response were statistically comparable. The OS and PFS were significantly different between responders and nonresponders (20.3 vs. 10.6 mo, P = 0.001, for OS and 15.5 vs. 2.2 mo, P < 0.001, for PFS, respectively). Twenty-three (32%) patients with progressive disease according to PERCIST5 had controlled disease according to imPERCIST5; follow-up of patients showed that 22% of these patients had pseudoprogression. The overall incidence of pseudoprogression was 7%. The response rate was 25% and 24% according to PERCIST1 and PERCIST5 (P = 0.2) and 32% and 29% according to imPERCIST1 and imPERCIST5 (P = 0.5), respectively, indicating no significant difference between analyzing the SULpeak of only the most 18F-FDG–avid lesion and analyzing up to the 5 most 18F-FDG–avid lesions. Conclusion: The achieved response by all conventional and immunotherapy-modified methods correlated strongly with patients’ survival outcome, with significantly longer OS and PFS in responders than in nonresponders according to all assessed definitions. The most 18F-FDG–avid lesion according to PERCIST and imPERCIST accurately reflects the overall metabolic response.
Programmed death-1 (PD-1) is one of the main tumor-mediated immune resistance pathways preventing T cell activation by tumor cells (1,2). The ability of PD-1 inhibitors to block the PD-1 pathway has resulted in a paradigm shift in the treatment of a variety of solid tumors (3–7). The accurate assessment of response to these therapies is of critical importance in making treatment decisions, as reported disease progression is equivalent to treatment failure and necessitates that patients discontinue the treatment and switch to an alternative therapeutic modality (2). However, because PD-1 inhibitors stimulate the host antitumor response, a favorable response may initially present not only with an increase in the size and metabolic activity of the existing tumoral lesions but also with the appearance of new inflammatory lesions that may appear to be due to progressive disease (PD) (1–3,8). To address this issue, immunotherapy-modified RECIST (iRECIST) and immunotherapy-modified PERCIST (imPERCIST) were introduced, aiming to assist with discrimination between disease progression and pseudoprogression (3,8–11). An ongoing clinical challenge is that although the conventional criteria are vulnerable to reporting pseudoprogression as disease progression, the new immunotherapy-modified classifications may have the drawback of missing on-time diagnosis of true disease progression (2,9). The clinical benefit of either of these response assessment methods is still under investigation. Although some studies have reported improved accuracy in response assessment using modified methods, the results of some clinical trials evaluating immune checkpoint inhibitors (ICIs) challenge the benefit of iRECIST and imPERCIST over RECIST and PERCIST because of the low incidence of immunotherapy-related pseudoprogression observed in these trials (1,12–15). Additionally, it is unclear whether the immune-related response to PD-1 inhibitors follows the same pattern in all solid tumors. These issues reflect the importance of confirming changes in response to immunotherapy in individual cancers.
This study aimed to evaluate the correlation between survival outcome and response assessment achieved by conventional (RECIST, version 1.1, and PERCIST, version 1.0) and immunotherapy-modified (iRECIST and imPERCIST) methods in patients with non–small cell lung cancer (NSCLC) treated with PD-1 inhibitors and to compare the accuracy of using the first or up to 5 of the most metabolically active lesions for overall metabolic response assessment.
MATERIALS AND METHODS
Patients
We retrospectively assessed the efficacy of anti-PD1 antibodies (nivolumab and pembrolizumab) as monotherapies in consecutively treated patients with NSCLC between January 2014 and August 2019 by conventional (RECIST and PERCIST) and immunotherapy-modified (iRECIST and imPERCIST) methods. Patients with more than a 12-wk interval between either baseline 18F-FDG PET/CT and the first dose of PD-1 or the last dose of immunotherapy and follow-up 18F-FDG PET/CT were excluded from the study. Additionally, patients with no lesion above the liver metabolic activity threshold as defined by PERCIST (1.5 × liver SULpeak + 2 SDs of liver SULpeak), a simultaneous active second malignancy, no extracranial lesion on baseline PET/CT, or less than 3 mo of follow-up after follow-up PET/CT were excluded (Fig. 1).
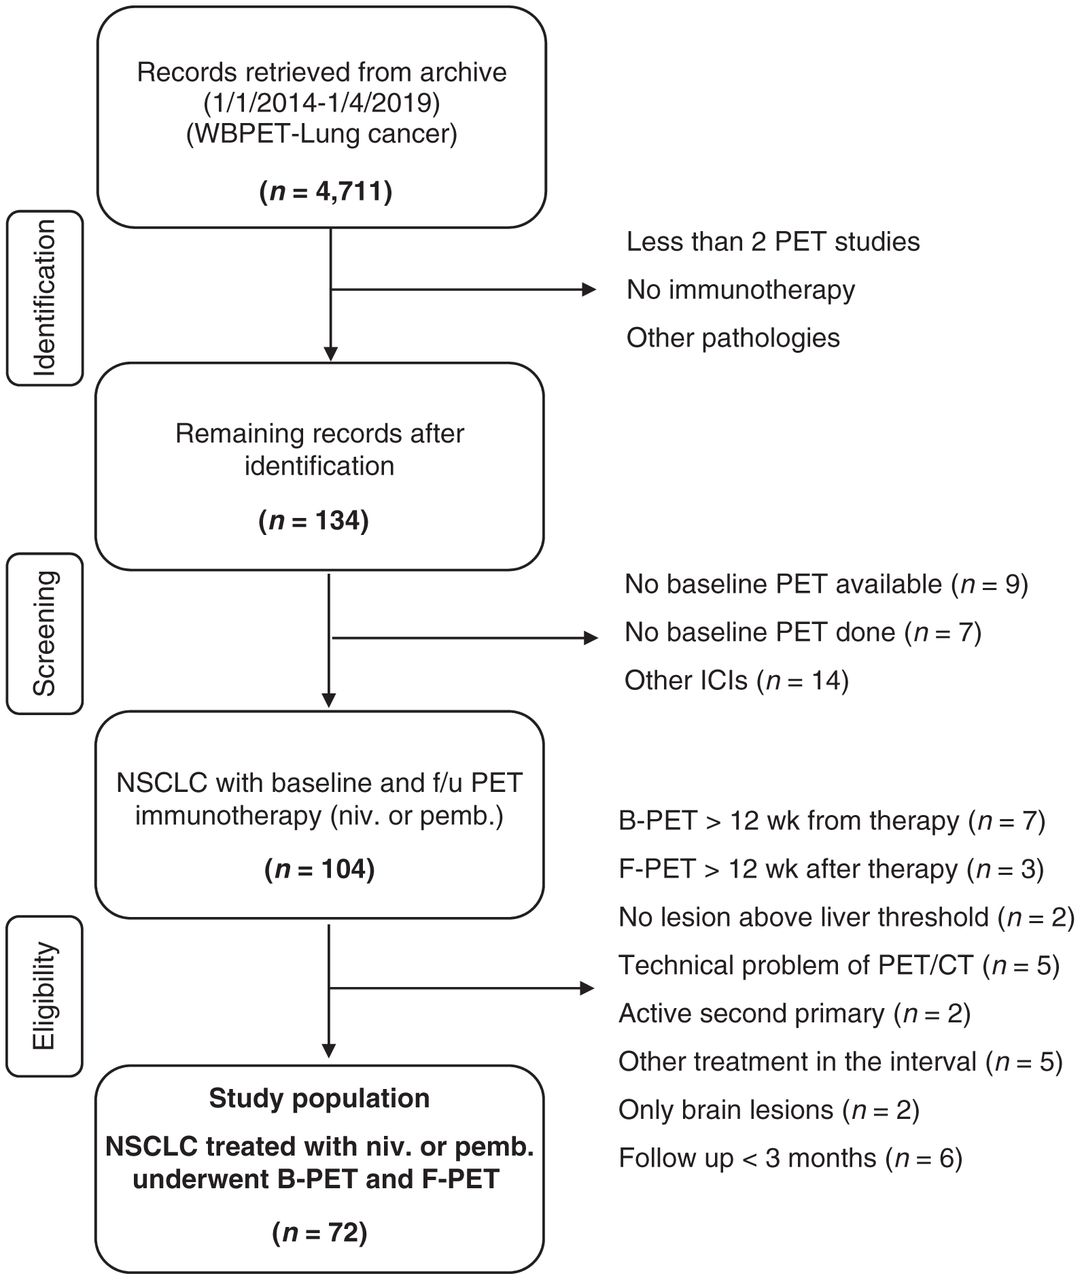
Flowchart of inclusion and exclusion criteria. B-PET = baseline PET; F-PET = follow-up PET; f/u = follow-up; niv. = nivolumab; pemb. = pembrolizumab; WBPET= whole-body PET.
The data collected included baseline demographics, Eastern Cooperative Oncology Group performance status, tumor characteristics and stage of disease, treatment details, and 18F-FDG PET/CT imaging data (Table 1). The dosing and treatment duration of pembrolizumab and nivolumab were decided according to standard guidelines and the treating physicians’ judgment. The endpoints evaluated were response rate, progression-free survival (PFS), and overall survival (OS). The study was approved by the Austin Health Human Research Ethics Committee (approval Austin-20/94).
General Characteristics of Patients, Tumor, Immunotherapy, and 18F-FDG PET/CT Studies
Imaging Protocol
All patients fasted for at least 6 h before the 18F-FDG PET studies. Blood glucose levels were checked intravenously before 18F-FDG injection. If the blood sugar level was less than 9 mmol/L, we proceeded with the study; for patients with blood sugar levels greater than 10.1 mmol/L, the assessment was rescheduled. Patients with blood sugar between 9.1 and 10 mmol/L were assessed on a case-by-case basis. The 18F-FDG dose was in the range of 220–300 MBq and was determined according to the patient’s body mass index.
Patients who had more than a 30-min difference in uptake time between baseline PET/CT and follow-up PET/CT were not included in the study. Both baseline and follow-up PET/CT studies were obtained from the skull vertex to the upper thighs on a Philips Ingenuity 128 time-of-flight PET/CT scanner. A low-dose CT scan (120 kVP; 30–50 mAs) was performed for attenuation correction and anatomic registration. Emission scans were performed for 2–3 min per bed position. An iterative reconstruction algorithm was applied for image reconstruction.
Image Analysis
Images were analyzed by 2 nuclear medicine specialists on a computer display using a dedicated software package (version 12.2.0; MedView Software Inc.). In addition, 2 radiologists masked to the PET/CT result assessed the patients’ diagnostic CT for RECIST and iRECIST response assessment. In the rare cases that diagnostic CT was not available, the low-dose CT component of the PET/CT study was used for the RECIST and iRECIST classification.
The peak SUV normalized by lean body mass (SULpeak) was determined by the software within the region of interest drawn on the liver and all metabolically active lesions. For the PERCIST and imPERCIST methods, the first and up to 5 lesions with the highest SULpeak (maximum, 2 lesions per organ) were selected for further analysis. The selection of lesions on follow-up PET/CT was based on SULpeak and was independent of the lesions selected on baseline PET/CT, and the same lesions were not necessarily identified.
Response Assessment
Comparing the baseline and follow-up PET/CT studies, we classified response to immunotherapy into 4 categories: complete metabolic response (CMR), partial metabolic response (PMR), stable metabolic disease (SMD), and progressive metabolic disease (PMD) according to PERCIST (13,14,16) and imPERCIST (16) recommendations (Table 2). This analysis was subclassified into PERCIST1 or imPERCIST1 (in case 1 lesion with the highest SULpeak was used) and PERCIST5 or imPERCIST5 (when up to 5 lesions with the highest SULpeak were analyzed). Similarly, using RECIST (9,11,13) and iRECIST (9,11,13) recommendations (Table 2), we categorized response to PD-1 inhibitor as complete response (CR), partial response (PR), stable disease (StD), or PD. The differences between the PERCIST and imPERCIST methods and the RECIST and iRECIST methods are shown in Table 2.
Summary of PET-Based and CT-Based Response Assessment Criteria for Immunotherapy Response Evaluation
Subsequently, the patients were classified as responders (CR/CMR and PR/PMR) or nonresponders (StD/SMD and PD/PMD) and as having controlled (CR/CMR, PR/PMR and StD/SMD) or uncontrolled (PD/PMD) disease using all investigated response assessment methods.
Statistical Analysis
Frequency statistics were obtained using frequency tables and descriptive analysis with SPSS software (version 26.0; SPSS Inc.). Quantitative variables were compared using independent t tests for independent groups and paired t tests for dependent variables. χ2 and McNemar tests were used for comparison of nominal variables between independent and dependent groups, respectively. Survival analysis was performed using the Kaplan–Meier method, and log-rank statistics were used for comparison. P values of less than 0.05 were considered significant in all comparisons.
RESULTS
In total, 134 patients were identified, of whom 72 were included in this study (Fig. 1). Baseline data are detailed in Table 1. The mean age was 65.8 y, most were male (63%), and all had an Eastern Cooperative Oncology Group performance status of at least 2. The median ICI cycles between PET studies was 4 for both nivolumab and pembrolizumab, the time from baseline PET/CT to the first ICI dose was 21.5 ± 20.7 d, and the time from the last ICI dose to follow-up PET/CT was 17 ± 8.19 d.
Correlation of Response Categories with OS and PFS
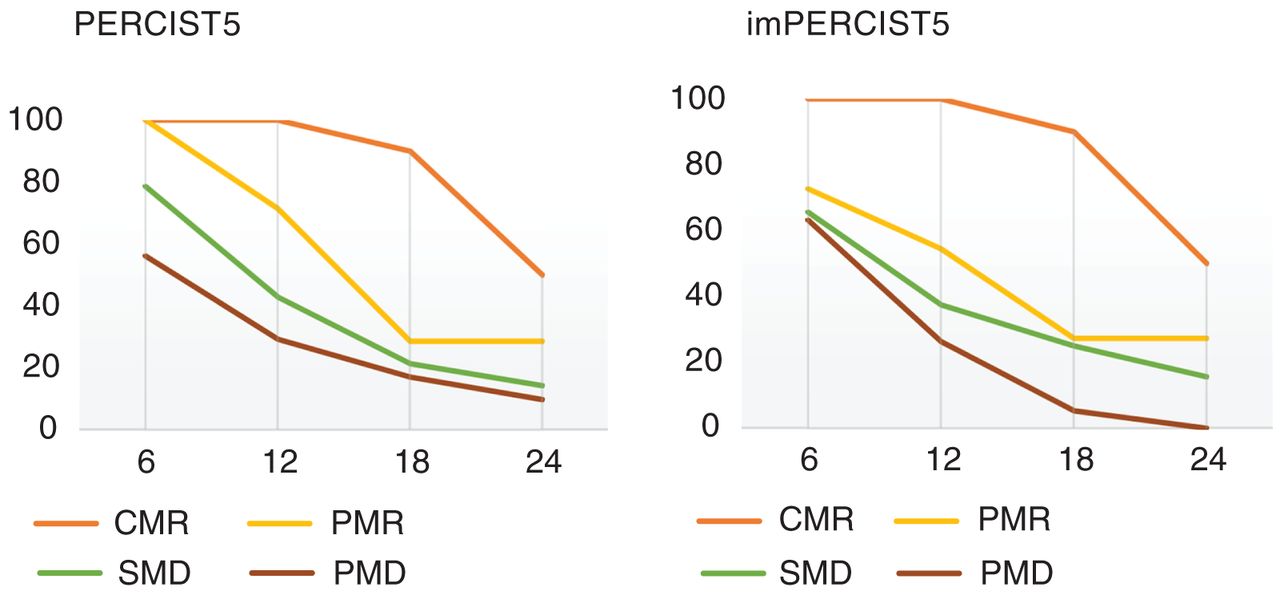
The mean OS of the study population was 13.7 ± 11.8 mo (range, 0.97 to 53.8 mo), with PFS of 6.39 ± 11.2 mo based on overall staging parameters. The 6-, 12-, 18-, and 24-mo OS rates were 71%, 46%, 29%, and 18%, respectively. Figure 2 demonstrates the OS rates in different response groups according to PERCIST5 and imPERCIST5 (Fig. 2). The overall response rate and the overall disease control rate were 29% and 74%, respectively.

OS rate in different response groups according to PERCIST5 (A) and imPERCIST5 (B).
The mean OS and PFS was statistically similar between the CR and PR groups according to any of the criteria. Comparing StD with PD groups, we found that OS was statistically similar in these 2 populations as well. Therefore, each pair was grouped together, resulting in 2 categories: responders (CR/CMR and PR/PMR) and nonresponders (StD/SMD and PD/PMD). According to imPERCIST, the mean OS was 20.3 ± 14.7 mo among responders and 10.6 ± 8.7 mo among nonresponders (P = 0.006), and the mean PFS was 15.5 ± 14.2 mo among responders and 2.2 ± 6.1 mo among nonresponders (P < 0.001). The PFS and OS were also significantly different between responders and nonresponders according to the other 5 evaluated methods. Tables 3 and 4 compare OS between patients with CR and PR and between patients with StD and PD according to all assessed criteria. The difference in OS between responders and nonresponders is illustrated in Figure 3.
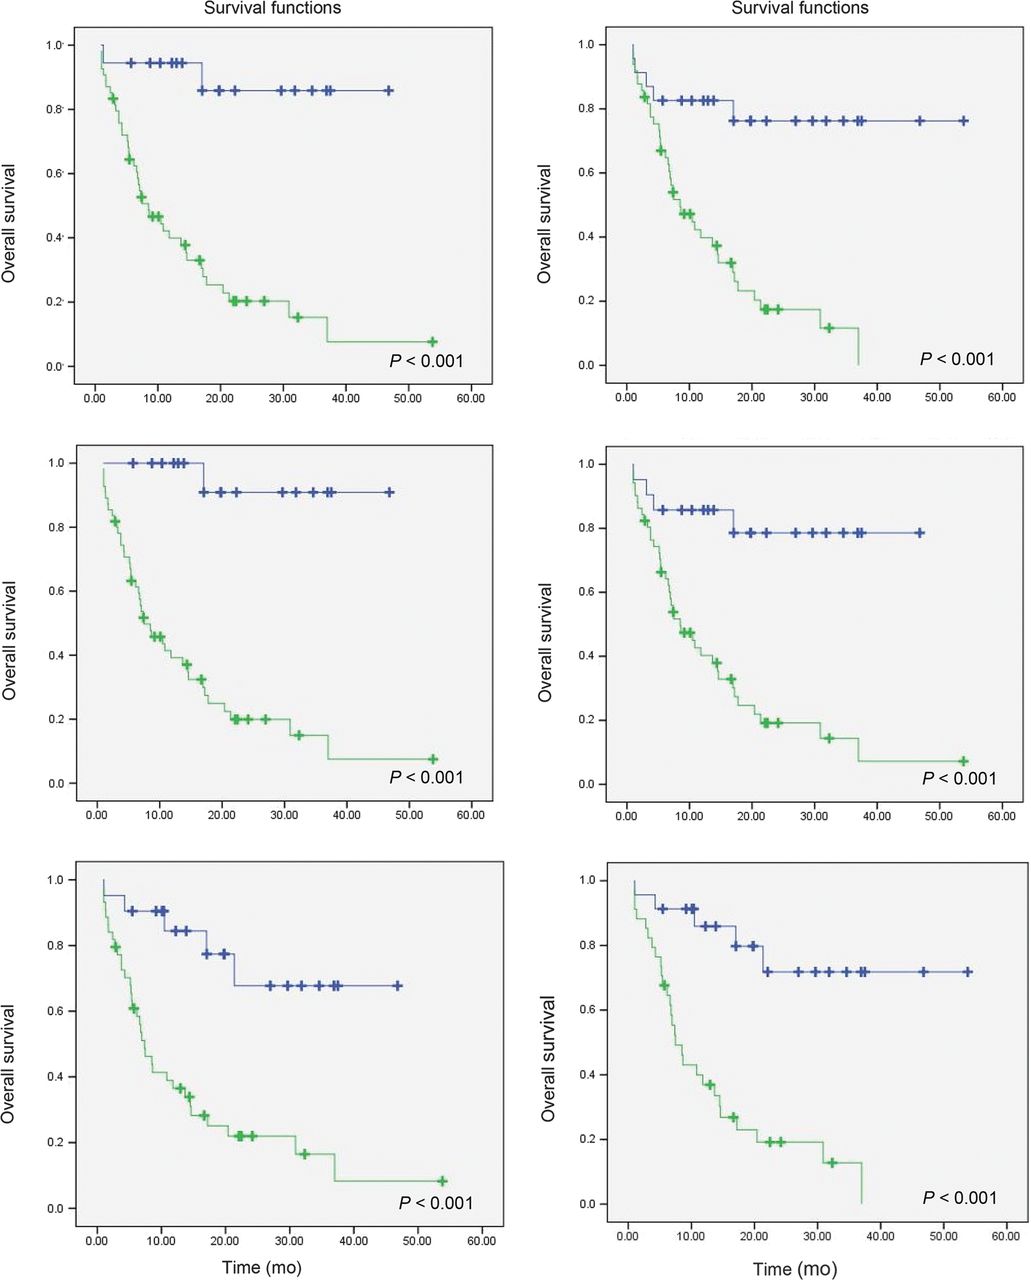
Survival curve of responders (blue line) vs. nonresponders (green line) using PERCIST1 (top left), imPERCIST1 (top right), PERCIST5 (middle left), imPERCIST5 (middle right), RECIST (bottom left), and iRECIST (bottom right).
Comparison of Mean Survival Between Patients with CR/CMR and PR/PMR and Between Patients with StD/SMD and PD/PMD
Comparison of Mean Survival Between Responders and Nonresponders According to Different Response Assessment Methods
Comparison of Conventional and Immunotherapy-Modified Methods Regarding Metabolic Response Assessment
In the comparison between PERCIST and imPERCIST, we noted that imPERCIST recategorized 5 nonresponders as responders (P = 0.06). This occurred in 4 patients when comparing PERCIST5 and imPERCIST5 (P = 0.12). All responders according to PERCIST were also responders according to imPERCIST regardless of the number of studied lesions. There was no statistical difference between conventional and immunotherapy-modified metabolic response assessment methods regarding the differentiation between responders and nonresponders to anti-PD1 therapy. However, when the patients were classified as having controlled (n = 31) or uncontrolled (progressive) disease (n = 41), more than half the patients (n = 23) with uncontrolled disease according to PERCIST were recategorized as having controlled disease using imPERCIST (P < 0.001). Follow-up of these patients showed that among these 23 patients who had PMD according to PERCIST and who were recategorized as having SMD (83%) and PMR (17%) according to imPERCIST, 5 (22%) had pseudoprogression due to immunotherapy-related inflammatory lesions on follow-up, whereas in 16 (70%) patients, the new lesions that appeared in the follow-up PET were true metastases. The nature of the new lesions in 2 of 23 patients remained unknown (Table 5). No inflammatory lesion had an SULpeak above 8.8. The incidence of pseudoprogression in the overall study population was calculated at 7%.
PD According to PERCIST1 That Recategorized to Other Response Categories by ImPERCIST1
Comparison of Metabolic Response Assessment Methods Using 1 or up to 5 Lesions
Using the SULpeak of the most 18F-FDG–avid lesion or up to 5 of the most 18F-FDG–avid lesions in both conventional and immunotherapy-modified criteria, there was no difference between PERCIST1 and PERCIST5 (P = 0.3) or between imPERCIST1 and imPERCIST5 (P = 0.5) with regard to differentiation between responders and nonresponders. Similarly, no statistically significant difference in the evaluation of the metabolic activity of 1 or up to 5 lesions was identified in the differentiation of patients with controlled disease from those with disease progression.
Comparison of Anatomic and Metabolic Response Assessment Methods
When comparing RECIST and iRECIST with PERCIST and imPERCIST, we noted no statistically significant difference between RECIST and PERCIST1 (P = 0.22) or between iRECIST and imPERCIST1 (P = 0.59) regarding response assessment.
DISCUSSION
Immunotherapy is one of the most promising therapeutic modalities in patients with solid tumors, and the interpretation of response in patients is vital to ensure that therapeutic response is accurately assessed (12,17–19). The present study showed comparable results using 1 or up to 5 lesions with the highest metabolic activity for both PERCIST and imPERCIST, suggesting that an interval change in the metabolic activity of the most 18F-FDG–avid lesion can accurately reflect the overall metabolic response to PD-1 inhibitors. To the extent of our knowledge, this is the first study to evaluate this issue in patients with NSCLC. However, similar observations have been reported previously on patients with metastatic melanoma treated with ICIs (16).
Our study showed longer OS and PFS in responders than in nonresponders according to all evaluated response assessment methods, with no statistically significant difference between conventional and immunotherapy-modified criteria. Because PD-1 inhibitors stimulate the host antitumor response, unusual response patterns on both anatomic and metabolic imaging assessments are expected (20) and make it increasingly challenging to evaluate the effectiveness of immunotherapy agents using imaging modalities accurately (Fig. 4).
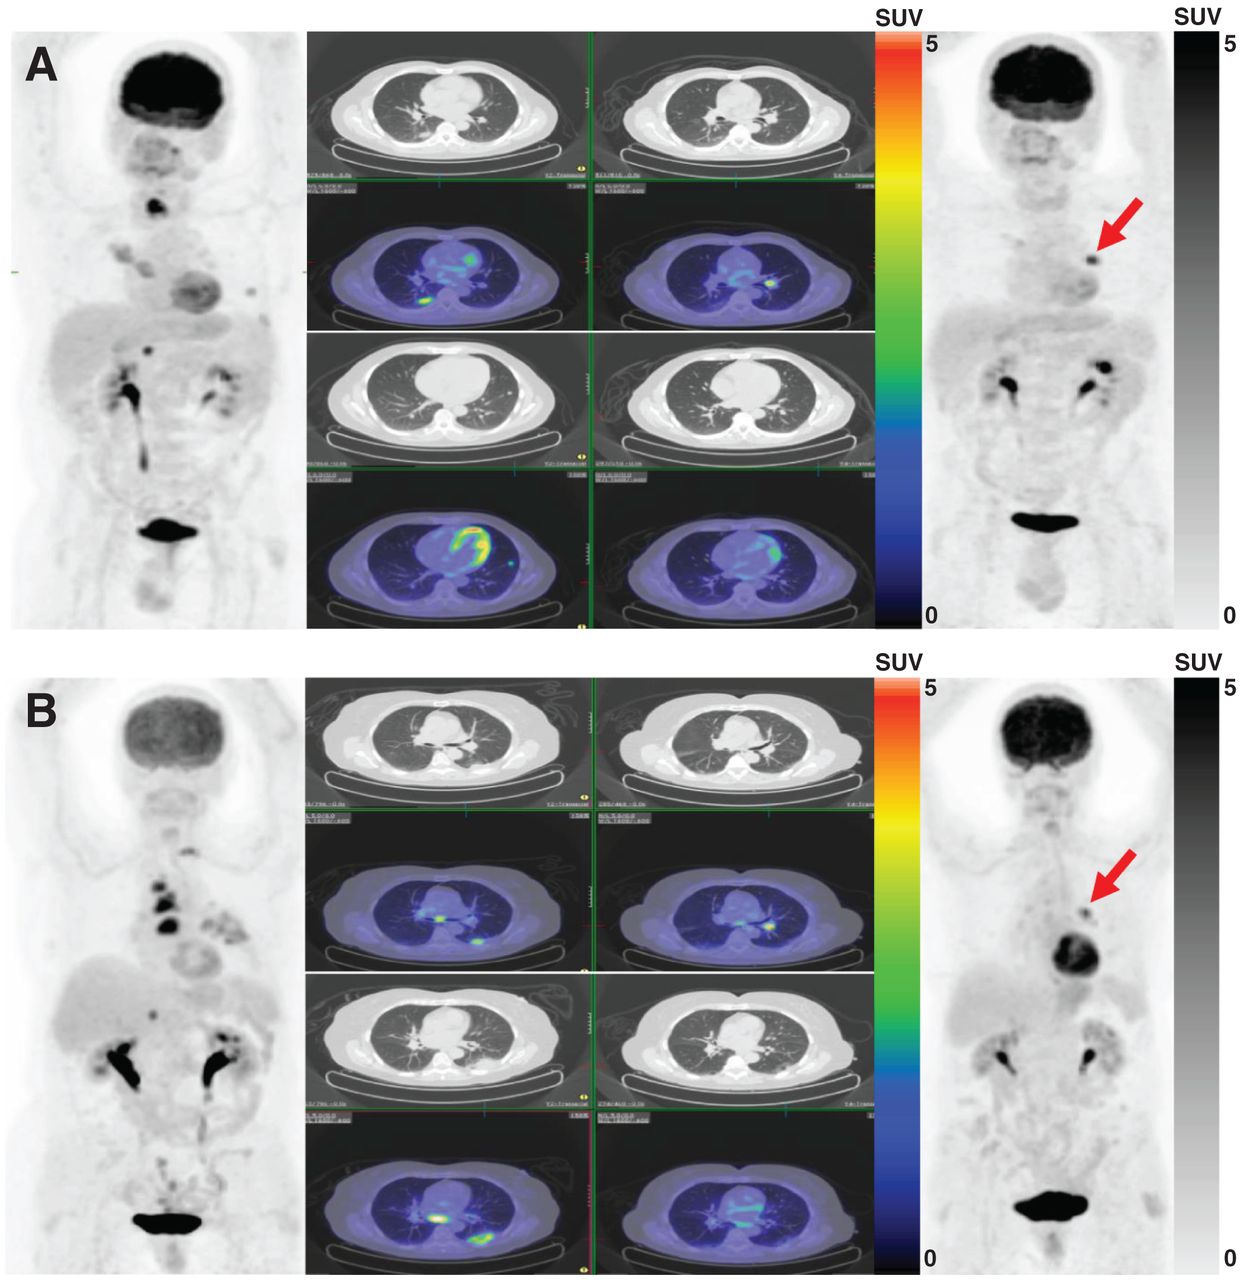
(A) A 54-y-old man with metastatic right-lower-lobe lung adenocarcinoma. Baseline PET/CT (left) demonstrates multiple pulmonary, thyroid, and right adrenal metastatic lesions. Highest SULpeak belongs to thyroid lesion (13.0). After 4 cycles of nivolumab, follow-up PET/CT (right) showed excellent metabolic response of previous lesions along with interval development of new left pulmonary hilar lesion (SULpeak, 7.8) (arrow). Response was assessed as PMD according to PERCIST and as PMR according to imPERCIST (SULpeak change, 39.9%). This hilar node spontaneously resolved after 2 mo, and disease has been in complete remission since then. (B) A 70-y-old man with metastatic left-lower-lobe lung adenocarcinoma. Baseline PET/CT (left) demonstrates multiple nodal, T2 vertebral, and right adrenal metastatic lesions. Highest SULpeak belongs to paratracheal nodal metastasis (10.7). After 6 cycles of nivolumab, follow-up PET/CT (right) showed excellent metabolic response of previous lesions along with interval development of new left pulmonary hilar lesion (SULpeak, 6.1) (arrow). Response was assessed as PMD according to PERCIST and as PMR according to imPERCIST (SULpeak change, 43.4%). Patient’s follow-up confirmed metastatic nature of hilar lymph node.
According to our results, there was no significant difference between conventional and immunotherapy-modified metabolic response assessment methods in differentiating between responders and nonresponders. However, when patients were categorized as controlled disease or PD, imPERCIST correctly recategorized into the controlled-disease category a fifth of patients with pseudoprogression categorized as PD.
Prior studies have demonstrated no significant improvement in response assessment using immune-modified methods (13,21). Consistent with these studies, we found that conventional and immunotherapy-modified methods of assessment did not significantly differ in categorizing the patients as responders and nonresponders, with only 7% and 4% of patients recategorized from nonresponders by PERCIST and RECIST to responders by imPERCIST and iRECIST, respectively. The best explanation is that most patients (19/23, 83%) with changes in response category after using immunotherapy-modified criteria transferred from the PD/PMD group into the StD/SMD group. Because the PD/PMD and StD/SMD groups are both subcategories of nonresponders, no statistically significant difference was seen between these 2 methods.
The mean OS of patients with PD/PMD who remained in the same group after using the immune-modified method was lower than that of patients who were recategorized into the StD/SMD or PR/PMR groups, favoring a better response evaluation using immunotherapy-modified methods in both anatomic and metabolic assessments. Similarly, Beer et al. evaluated 42 patients with NSCLC who underwent PD-1/PD ligand-1 inhibitor treatment and reported significantly longer median PFS and OS for responders than for nonresponders for both PET-based and CT-based criteria (18). On the other hand, Rossi et al. evaluated 48 patients with advanced NSCLC who were treated with immunotherapy (17), and low concordance was observed between the 18F-FDG PET–based (PERCIST and imPERCIST) and CT-based (RECIST and iRECIST) criteria—a finding that disagrees with our results, which showed a comparable OS prediction ability between metabolic and anatomic imaging (Table 3). Using a dual-time-point 18F-FDG PET/CT scan based on the iPERCIST and PERCIST methods in 28 NSCLC patients, Goldfarb et al. showed a longer OS in responders than in nonresponders (19.9 vs. 3.6 mo) and reclassification of 39% of patients using iPERCIST (22). These findings were in concordance with our results, which showed a 20.3- versus 10.6-mo OS in responders versus nonresponders based on imPERCIST and 32% reclassification of patients using immunotherapy-modified criteria.
In our study, the incidence rate of pseudoprogression in patients with NSCLC treated with immunotherapy was 7%, which is comparable to the 6.6% incidence of pseudoprogression in melanoma cases after immunotherapy observed by Chiou et al. (1) and the 8% pseudoprogression incidence reported by Martin-Romano et al. in solid tumors after immunotherapy (23).
There are certain limitations to this study. First, the fact that the design was retrospective may result in recruitment bias. For RECIST and iRECIST response assessment, we used the low-dose CT component of 18F-FDG PET/CT when diagnostic CT was not available, and the low-dose component may not be as accurate as diagnostic CT. Additionally, because of the limited number of patients treated with pembrolizumab, a comparison of different response criteria in patients treated with pembrolizumab and nivolumab was not performed. Finally, predictive biomarkers were not used for comparison with the results.
CONCLUSION
Both conventional and immunotherapy-modified anatomic and metabolic response assessment methods have a strong ability to discriminate between responders and nonresponders. The most 18F-FDG–avid lesion on PERCIST and imPERCIST accurately represents the overall metabolic response.
DISCLOSURE
No potential conflict of interest relevant to this article was reported.
KEY POINTS
QUESTION: What is the correlation between survival outcome and response assessment assessed by PERCIST, imPERCIST, RECIST, and iRECIST in NSCLC patients after PD-1 immunotherapy?
PERTINENT FINDINGS: In a retrospective study of 72 patients with NSCLC treated with nivolumab or pembrolizumab with baseline and follow-up 18F-FDG PET/CT data, the overall response rate and the overall disease control rate of patients with CR and PR were statistically comparable between groups, and there was no significant difference between analyzing the SULpeak of only the most 18F-FDG–avid lesion and analyzing up to 5 of the most 18F-FDG–avid lesions.
IMPLICATIONS FOR PATIENT CARE: These results indicate that the most 18F-FDG–avid lesion according to PERCIST and imPERCIST accurately reflects the overall metabolic response and might be used in assessing response to PD-1 immunotherapy in NSCLC patients.
Footnotes
Published online Nov. 27, 2020
- COPYRIGHT © 2021 by the Society of Nuclear Medicine and Molecular Imaging.
REFERENCES
- Received for publication July 29, 2020.
- Accepted for publication November 4, 2020.


Jump to section
Related Articles
Cited By...
- No citing articles found.