


Visual Abstract

Abstract
Sorafenib leads to clinical benefit in a subgroup of patients, whereas all are exposed to potential toxicity. Currently, no predictive biomarkers are available. The purpose of this study was to evaluate whether 11C-sorafenib and 15O-H2O PET have potential to predict treatment efficacy. Methods: In this prospective exploratory study, 8 patients with advanced solid malignancies and an indication for sorafenib treatment were included. Microdose 11C-sorafenib and perfusion 15O-H2O dynamic PET scans were performed before and after 2 wk of sorafenib therapy. The main objective was to assess whether tumor 11C-sorafenib uptake predicts sorafenib concentrations during therapy in corresponding tumor biopsy samples measured with liquid chromatography tandem mass spectrometry. Secondary objectives included determining the association of 11C-sorafenib PET findings, perfusion 15O-H2O PET findings, and sorafenib concentrations after therapeutic dosing with response. Results: 11C-sorafenib PET findings did not predict sorafenib concentrations in tumor biopsy samples during therapy. In addition, sorafenib plasma and tumor concentrations were not associated with clinical outcome in this exploratory study. Higher 11C-sorafenib accumulation in tumors at baseline and day 14 of treatment showed an association with poorer prognosis and correlated with tumor perfusion (Spearman correlation coefficient = 0.671, P = 0.020). Interestingly, a decrease in tumor perfusion measured with 15O-H2O PET after only 14 d of therapy showed an association with response, with a decrease in tumor perfusion of 56% ± 23% (mean ± SD) versus 18% ± 32% in patients with stable and progressive disease, respectively. Conclusion: Microdose 11C-sorafenib PET did not predict intratumoral sorafenib concentrations after therapeutic dosing, but the association between a decrease in tumor perfusion and clinical benefit warrants further investigation.
Since the discovery of rapidly accelerated fibrosarcoma (RAF) kinases in 1983 as oncoproteins involved in cancer proliferation, migration, and survival, protein kinase inhibitors have been developed in an attempt to inhibit these RAF kinases (1). Sorafenib was the first clinically successful RAF inhibitor (2). The molecular properties of sorafenib (∼637 Da) enable diffusion and transporter-mediated uptake into the cell. Sorafenib competes with adenosine triphosphate to occupy the hydrophobic pocket directly adjacent to its binding site, thereby trapping protein kinases in an inactive state (3). Apart from showing an affinity for RAF kinases, sorafenib has shown affinity for multiple other protein kinases, thereby suppressing angiogenesis and inducing apoptosis (4). Sorafenib has been approved for treatment of locally advanced and metastatic hepatocellular carcinoma, renal cell carcinoma, and iodine-refractory differentiated thyroid carcinoma (5–7). However, response to sorafenib is variable, resulting in clinical benefit for only a subgroup of patients, whereas all are exposed to potential toxicity (5–7). The most common side effects include gastrointestinal symptoms, fatigue, and hand–foot skin reactions (5–7). Currently, no biomarkers are available to identify which patients are likely to benefit from sorafenib.
The response to sorafenib is thought to be directly related to drug concentrations in tumor tissue (8). Noninvasive quantification of drug uptake in tumors and normal tissues at different time points using PET imaging may provide insight into tissue pharmacokinetics in relation to therapeutic effects. For some protein kinase inhibitors, such as 11C-erlotinib PET, this approach already has shown clinical relevance (9). PET is a highly sensitive method to detect tracer concentrations in the body at the lower picomolar range (10−12 mol/L) (10). This ability enables the use of a microdose drug tracer, that is, a drug dose less than 1% of the expected pharmacologically active concentration, avoiding toxicity from the studied drug (11). The tracer 11C-sorafenib has been developed without changing the molecular structure of the drug itself (12). In mice, 11C-sorafenib PET showed tumor uptake in the RAF-expressing human renal cell carcinoma xenograft RXF393 (12).
The purpose of the present study was to explore whether 11C-sorafenib uptake in tumors can be used as a potential biomarker for treatment efficacy. The primary objective was to assess whether microdose 11C-sorafenib PET uptake at baseline or a change in uptake after 14 d of treatment (steady state) could predict sorafenib concentrations after therapeutic dosing as measured in corresponding tumor biopsy samples. Secondary objectives were to investigate the effect of tumor perfusion on 11C-sorafenib delivery and to assess the antiangiogenic effects of sorafenib on tumor perfusion. Finally, we investigated whether 11C-sorafenib uptake and sorafenib concentrations in tumors, together with changes in tumor perfusion, are related to patient outcome.
MATERIALS AND METHODS
Study Design
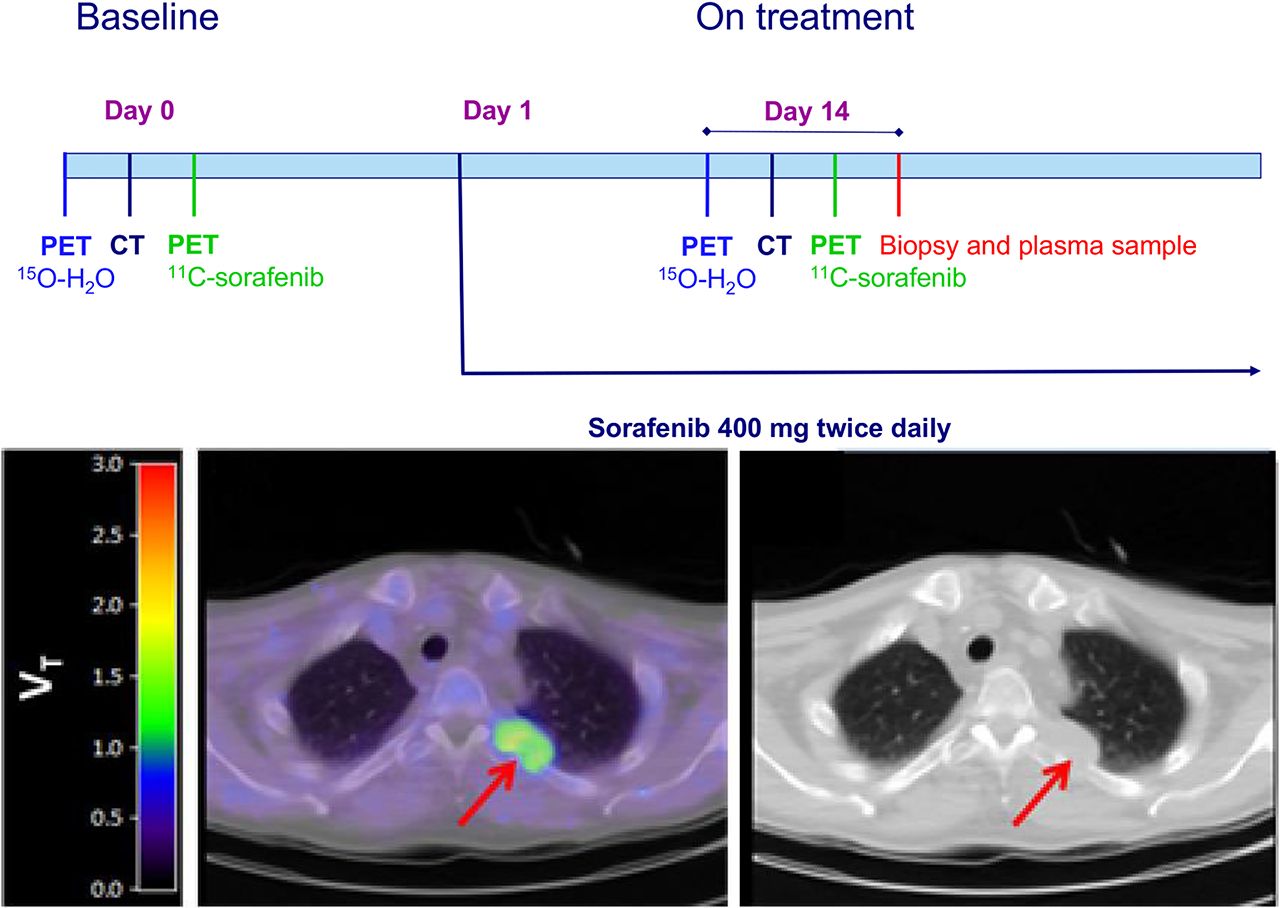
This prospective exploratory study, with a planned sample size of 8, was conducted at the Amsterdam University Medical Centers, location VUmc. Patients underwent dynamic microdose 11C-sorafenib PET scans before treatment (“baseline”) and after 2 wk of treatment with sorafenib, 400 mg twice daily, when steady state levels of sorafenib were reached (“on treatment”) (13). Within 2 h of the on-treatment 11C-sorafenib PET scan, a tumor biopsy sample and a venous blood sample were taken to measure unlabeled steady-state sorafenib concentrations during therapy. Before each 11C-sorafenib PET scan, a dynamic 15O-H2O PET scan was performed to measure tumor perfusion (Fig. 1). For all patients, sorafenib treatment was continued until progressive disease, severe toxicity, or refusal by the patient.
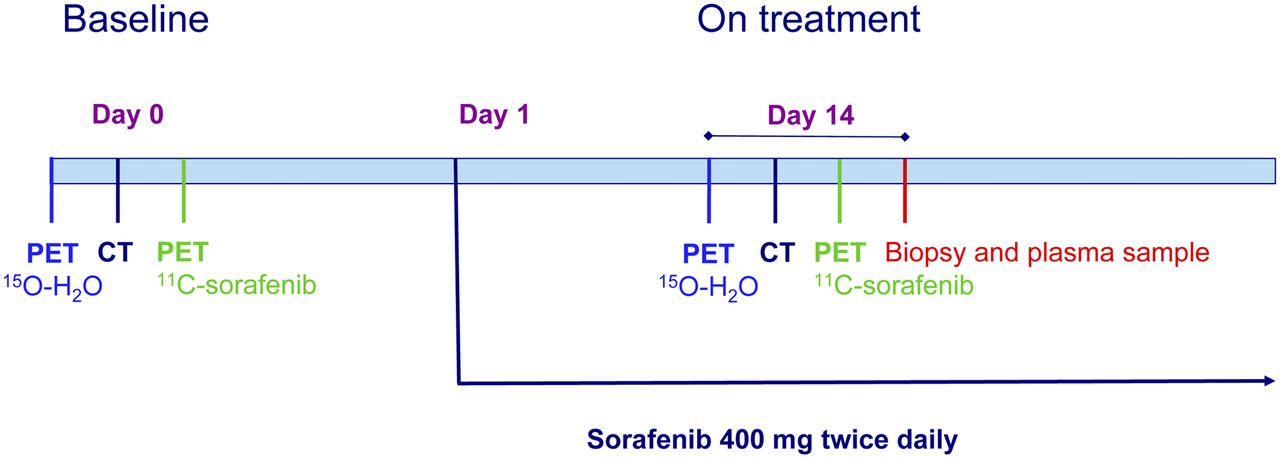
Study design.
Patient Population
We included adults with a histologically confirmed, biopsy-accessible metastatic solid malignancy (i.e., hepatocellular carcinoma, renal cell carcinoma, or iodine-refractory differentiated thyroid carcinoma) who were eligible for standard palliative treatment with sorafenib. Other inclusion and exclusion criteria are shown in Supplemental Table 1 (supplemental materials are available at http://jnm.snmjournals.org).
The study was approved by the Medical Ethics Review Committee (NCT02111889), and all subjects gave written informed consent.
Tracer Synthesis
11C-sorafenib and 15O-H2O were produced according to good-manufacturing-practice guidelines, as described previously (12,14). 11C was incorporated in the molecular structure of sorafenib at the terminal methylamide position.
PET Scanning
Scanning was performed using a Gemini TF-64 PET/CT device (Philips) with an 18.4-cm axial field of view divided into 45 contiguous planes. The patients received 2 venous catheters (one for tracer injection and the other for manual venous sampling) and an indwelling catheter in the radial artery for continuous blood sampling during PET/CT and were positioned supine on the scanner bed. Elastic body-restraining bandages were used to minimize movement during scanning. A CT-based topogram was performed to determine that both tumor and left ventricle were within the field of view of the scanner. Next, a 10-min dynamic scan was obtained, starting at the time of an intravenous injection of approximately 370 MBq of 15O-H2O (5 mL at a rate of 0.8 mL·s−1, followed by a 35-mL saline flush at a rate of 2.0 mL·s−1). Finally, a 60-min dynamic scan was acquired, starting at the time of an intravenous injection of approximately 370 MBq of 11C-sorafenib (5 mL at a rate of 0.8 mL·s−1, followed by a 35-mL saline flush at a rate of 2.0 mL·s−1). A 30-mAs low-dose CT scan was performed between the 11C-sorafenib and 15O-H2O dynamic PET scans for attenuation correction and segmentation purposes.
Using the 3-dimensional row-action maximum likelihood reconstruction algorithm, 15O-H2O scans were reconstructed into 26 frames (1 × 10, 8 × 5, 4 × 10, 2 × 15, 3 × 20, 2 × 30, and 6 × 60 s). 11C-sorafenib scans were reconstructed into 36 frames (1 × 10, 8 × 5, 4 × 10, 3 × 20, 5 × 30, 5 × 60, 4 × 150, 4 × 300, and 2 × 600 s). All data were normalized and corrected for dead time, decay, randoms, scatter, and attenuation. The resulting PET images consisted of 128 × 128 × 90 isotropic voxels, with a 4 × 4 × 4 mm voxel size and a final resolution of 5 mm in full width at half maximum.
Blood Sampling
During the 15O-H2O and 11C-sorafenib scans, arterial blood was withdrawn continuously at a rate of 300 mL·h−1 for the first 5 min and 150 mL·h−1 thereafter until the end of the scan, using an online detection system (Comecer) (15). In addition, 7-mL arterial and venous samples were collected manually in lithium heparin–containing tubes at 5, 7, and 9 min after injection of 15O-H2O and at 5, 10, 20, 30, 40, and 60 min after injection of 11C-sorafenib. After each sample, the line was flushed with 2 mL of saline. These venous samples were used for measuring plasma–to–whole-blood ratios, and for measuring plasma fractions of parent 11C-sorafenib and radiolabeled metabolites. The arterial samples were used for calibration of the continuous arterial input curve. Because of the invasive character of an arterial catheter, a noninvasive image-derived input function was also investigated (Supplemental Fig. 1).
Blood Radioactivity Concentrations of Tracer and Metabolites
Whole-blood and plasma radioactivity concentrations of the parent drug and its radiolabeled metabolites were determined in the blood samples using a well-counter, cross-calibrated against the PET scanner (Supplemental Table 2).
Volume-of-Interest (VOI) Definition
VOIs of tumor lesions were defined manually on low-dose CT scans, avoiding large blood vessels and normal liver tissue. In addition to the complete tumor volume, a separate VOI was defined for the rim of each tumor lesion using 2 voxels from the outer border of the tumor contour for comparison with tracer uptake in the whole-tumor VOI, as central tumor necrosis may affect tracer uptake. Next, low-dose CT VOIs were projected onto corresponding dynamic PET images to generate time–activity curves for 11C-sorafenib and 15O-H2O. In addition, VOIs were defined on normal organs for 11C-sorafenib biodistribution (16).
Analysis of Tumor Perfusion
Tumor perfusion (in mL/cm3/min) was analyzed by fitting each 15O-H2O time–activity curve to the single-tissue-compartment model in combination with the arterial input function, as described previously (17). This model was implemented in MATLAB software (version R2017B; MathWorks).
Biodistribution of 11C-Sorafenib in Healthy Tissues
The biodistribution of 11C-sorafenib in healthy tissues was measured during the 40- to 60-min interval of the dynamic PET scan and expressed as SUVmean, which is routinely used for evaluating the biodistribution in normal tissues (18).
11C-Sorafenib Pharmacokinetics in Tumors
Tumor time–activity curves derived from 11C-sorafenib scans at baseline and after 14 d of therapy were fitted to 3 different compartment models (i.e., 1-tissue, irreversible 2-tissue, and reversible 2-tissue models) using the arterial plasma input function, corrected for radiolabeled metabolites. All models included a blood volume parameter to account for intravascular activity. The optimal model for describing the time–activity curve data was based on Akaike information and Schwarz criteria (19,20).
Sorafenib Concentrations in Tumor and Plasma During Therapy
Using 14- to 16-gauge biopsy needles, experienced interventional radiologists obtained tumor biopsy samples. In cases of central necrosis, as seen on CT, samples were taken from the rim of the tumor. Samples were snap-frozen within 1 min of the biopsy, followed by storage under −80°C conditions. Both plasma and tumor tissue samples were obtained within 2 h of the on-treatment 11C-sorafenib PET scan. Liquid chromatography tandem mass spectrometry (LC-MS/MS) was used as a reference method to measure sorafenib concentrations, as described previously (21).
Safety and Response Evaluation
Safety was evaluated in all patients, with grading of adverse events according to the National Cancer Institute Common Terminology Criteria for Adverse Events, version 4.0. Tumor response was evaluated every 2 mo during sorafenib therapy according to RECIST, version 1.1 (22).
Statistical Analysis
Statistical analyses were performed using SPSS software (version 22.0; SPSS Inc.) for Microsoft Windows. Tumor uptake of 11C-sorafenib (both at baseline and in on-treatment PET scan) was compared with corresponding tumor and plasma sorafenib concentrations and with the calculated tumor-to-plasma concentration ratio of sorafenib after therapeutic dosing. PET measures are presented as mean ± SD. Correlations were explored using the Spearman correlation coefficient (rS). The Wilcoxon signed-rank test was used to compare PET measures before and after 14 d of sorafenib treatment and to compare whole tumor and tumor rim values. A 2-tailed probability value of less than 0.05 was considered significant.
RESULTS
Patient Characteristics
Eight patients were included (Table 1) between September 2013 and November 2015. There were no side effects during tracer injection or imaging procedures. The patients received 100% of the therapeutic dose during sorafenib treatment, except for patient 4. This patient had to leave the study within 2 wk of treatment because of an unexpected rapid clinical progression. In the other patients, at least 1 contrast-enhanced CT scan was obtained for response evaluation. Five patients had progressive disease at the first evaluation, and 2 patients had stable disease for 20 and 44 wk.
Tumor and Plasma Sorafenib Concentrations Measured with LC-MS/MS and 11C-Sorafenib Tumor VT on Days 0 and 14
Biodistribution of 11C-Sorafenib
The highest 11C-sorafenib accumulation was in the liver (SUVmean, 10.4 ± 3.3 at baseline and 6.4 ± 1.6 on treatment), whereas concentrations in the skin were lowest (SUVmean, 0.3 ± 0.1 at baseline and 0.01 ± 0.01 on treatment) (Fig. 2).
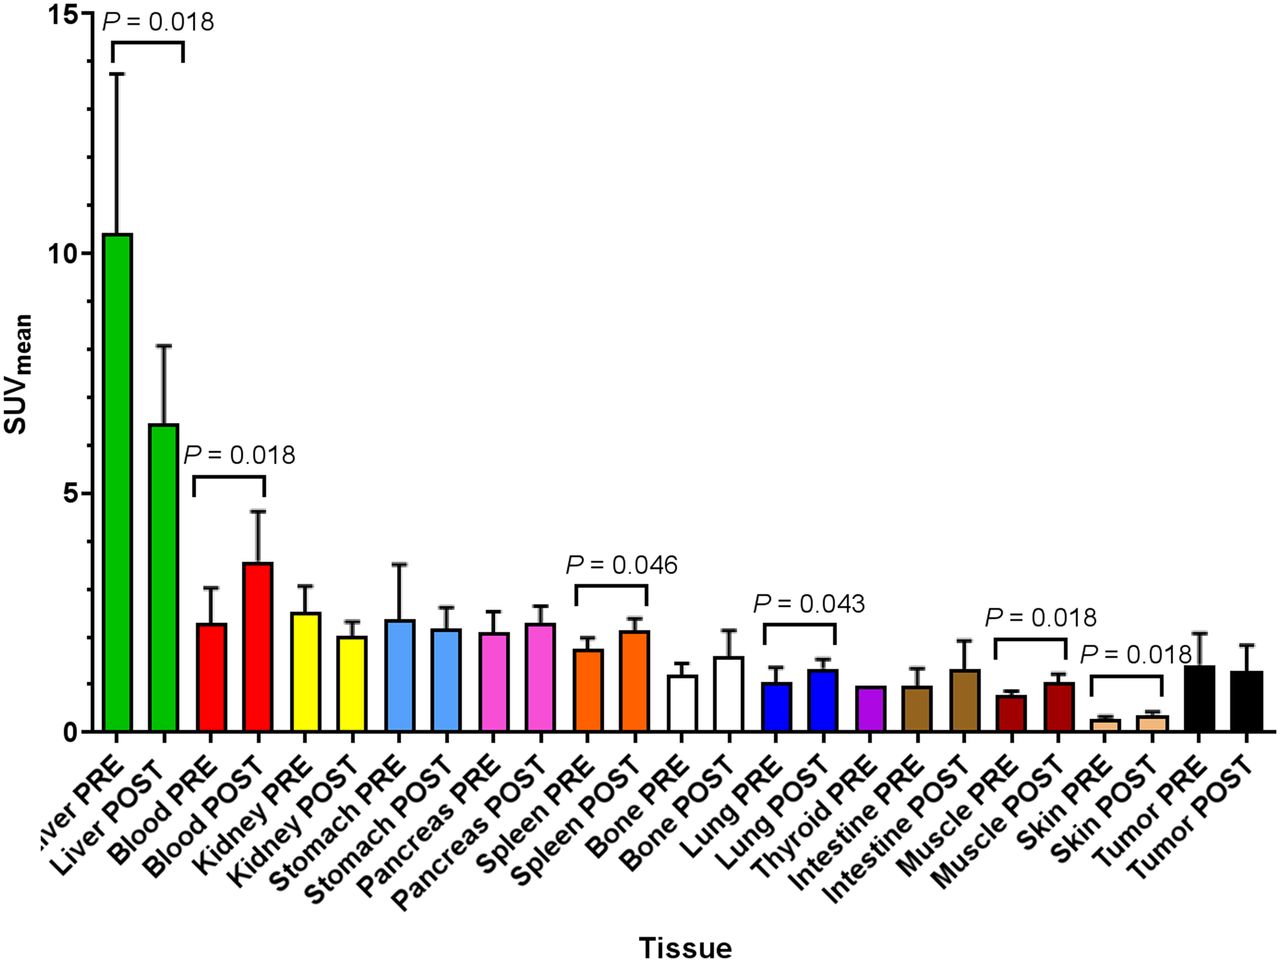
Biodistribution of 11C-sorafenib in different healthy tissues and tumor tissue. PRE = baseline; POST = after 14 d of sorafenib therapy.
Comparison of 11C-sorafenib uptake at baseline with that on treatment showed the largest differences in the liver, with an SUVmean decrease from 10.4 to 6.4 (P = 0.018), and in blood, with an SUVmean increase from 2.3 to 3.6 (P = 0.018).
No association was seen between the biodistribution of 11C-sorafenib and treatment-related toxicities.
Quantitative Analysis of 11C-Sorafenib Uptake in Tumors
In total, 15 lesions could be evaluated. Tumor volumes were highly variable, with a median size of 10 cm3 and a range of 4–2,527 cm3. Patient 4 had only a baseline 11C-sorafenib scan because of early clinical deterioration.
A PET tracer dose of 347 ± 66 MBq of 11C-sorafenib was given, with a specific activity of 35,350 ± 9,929 MBq/μmol of sorafenib. As the molecular weight of sorafenib is 464.8 μg/μmol, this dose corresponded to 4.9 ± 1.6 μg of unlabeled sorafenib. After injection, 11C-sorafenib was quite stable, with only less than 5% labeled metabolites formed during the 60-min scan. The reversible 2-tissue-compartment model with 4 rate constants and an additional blood volume parameter best described 11C-sorafenib tumor kinetics (Supplemental Fig. 2). Therefore, the total volume of distribution (VT) = K1/k2 × (1 + k3/k4) was used as the outcome parameter, which represents the tumor-to-plasma ratio of 11C-sorafenib at equilibrium.
At baseline, 3 of 8 patients had a tumor VT of more than 1; that is, 11C-sorafenib accumulation was higher in the tumor than in plasma (Fig. 3). After 14 d of treatment, no patients were left with a tumor VT of more than 1. Overall, tumor VT values of 11C-sorafenib were higher at baseline than at day 14 of treatment (0.68 ± 0.55 vs. 0.29 ± 0.20, P = 0.007).

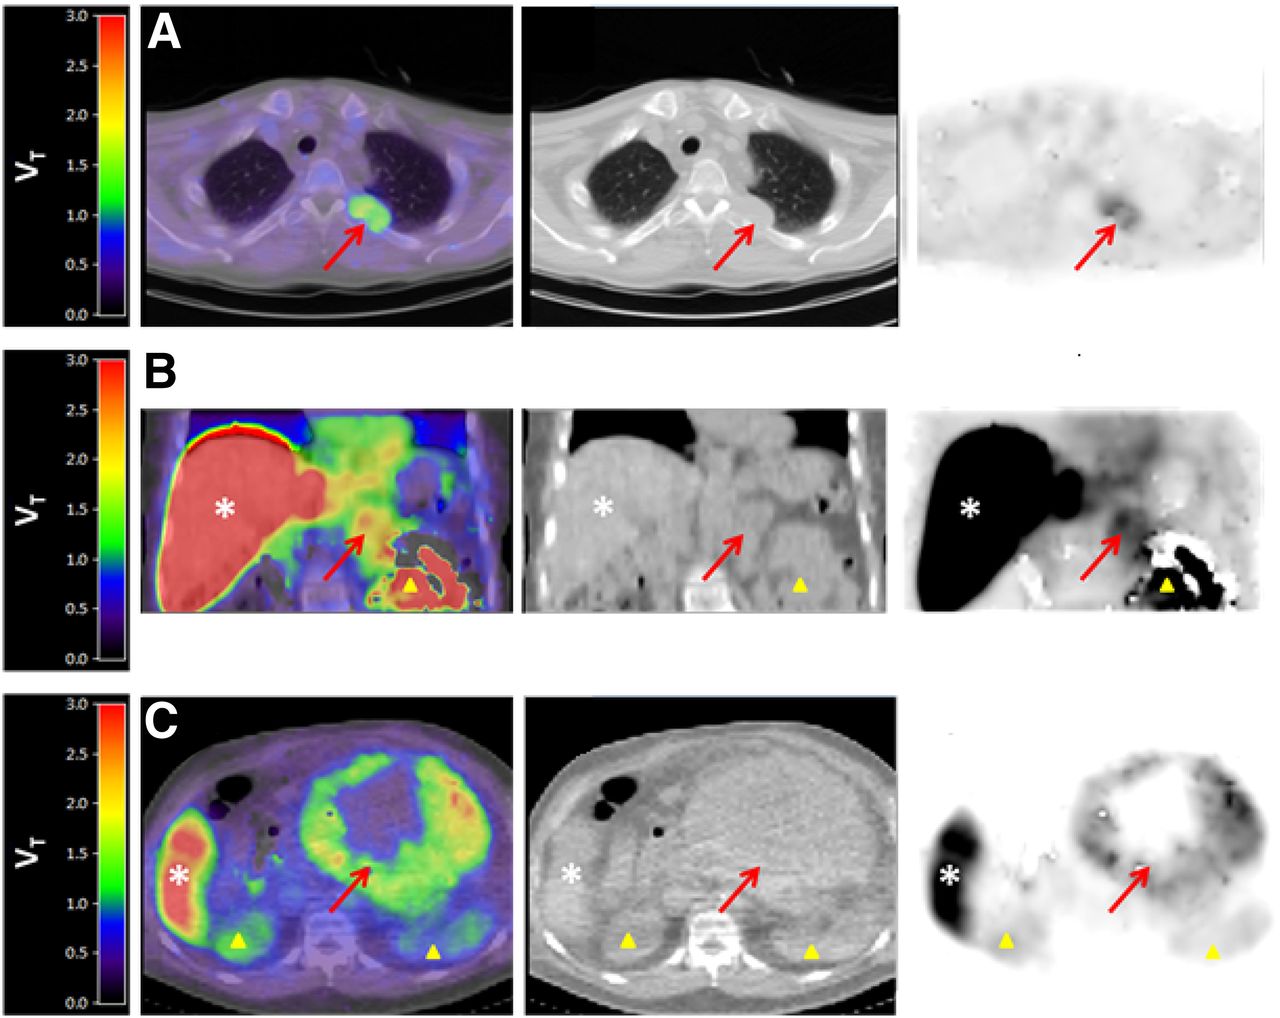
Fusion 11C-sorafenib PET/CT (sum, 40–60 min), low-dose CT, and PET images from 3 patients showing 11C-sorafenib uptake in tumor lesions (arrows). Patient A, with hepatocellular carcinoma, has metastasis in left costa 4; patient B, with renal cell carcinoma, has metastasis in left adrenal gland; and patient C, with hepatocellular carcinoma, has large intraabdominal metastasis. Physiologic uptake can be seen in liver (*) and kidneys (Δ).
No significant differences in 11C-sorafenib VT were established between whole tumor and outer tumor rim (P = 0.944 at baseline and P = 0.138 at day 14). In addition, total tumor volume did not correlate with the amount of tracer uptake (rS = 0.196, P = 0.483, at baseline; rS = −0.134, P = 0.713, at day 14). Surprisingly, patients with clinical benefit had a lower tumor 11C-sorafenib VT than patients with progressive disease at baseline (0.34 ± 0.08 vs. 0.92 ± 0.61) as well as after 14 d of treatment (0.13 ± 0.05 vs. 0.37 ± 0.18) (Figs. 4A and 4B). In contrast, the percentage decrease in 11C-sorafenib VT between baseline and on-treatment scans was not associated with clinical outcome (stable disease, −58% ± 26%, vs. progressive disease, −34% ± 55%).

Tumor 11C-sorafenib VT on days 0 (A) and 14 (B) in lesions of patients with progressive disease (PD) and stable disease (SD).
Comparison of LC-MS/MS and 11C-Sorafenib PET Results
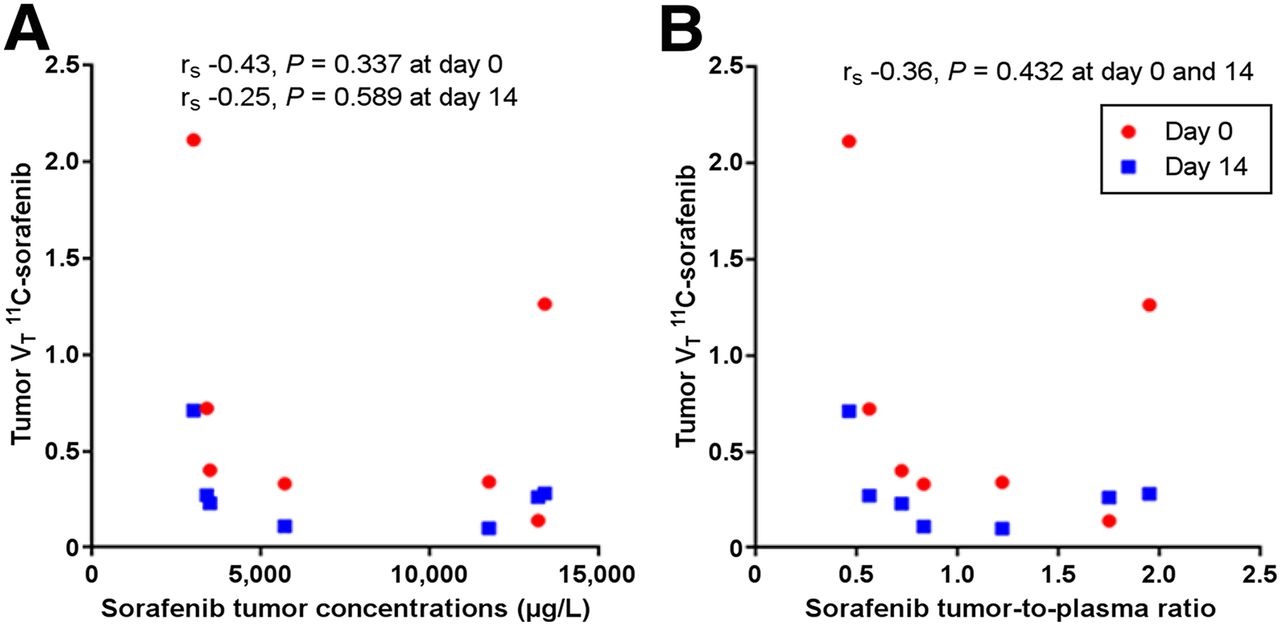
Sorafenib concentrations in tumor biopsy samples and plasma after 2 wk of treatment as measured using LC-MS/MS are presented in Table 1. In plasma, the median sorafenib concentration was 6,680 μg·L−1 (range, 4,860–9,610 μg·L−1). The median sorafenib concentration in tumor biopsy samples was 5,700 μg·L−1 (range, 3,000–13,400 μg·L−1), which was lower than in plasma in 4 of 8 patients. There was no correlation between plasma and tumor sorafenib concentrations (rS = 0.607, P = 0.148). PET-derived tumor 11C-sorafenib VT both at baseline and during therapy did not correlate with corresponding LC-MS/MS–measured sorafenib concentrations in tumor biopsy samples (rS = −0.429, P = 0.337, at baseline; rS = −0.250, P = 0.589, at day 14) (Fig. 5A). In addition, the calculated tumor-to-plasma concentration ratio of sorafenib after therapeutic dosing was not related to 11C-sorafenib VT (baseline and day 14, rS = −0.357, P = 0.432) (Fig. 5B). Also, the percentage difference in VT between baseline and on-treatment PET did not correlate with sorafenib concentrations in tumor biopsy samples (rS = −0.500, P = 0.267) or with the calculated tumor-to-plasma concentration ratio of sorafenib after therapeutic dosing (rS = −0.321, P = 0.498). Moreover, plasma and tumor concentrations of sorafenib measured with LC-MS/MS during treatment were not associated with treatment outcome (plasma concentrations of 8,245 ± 1,930 μg/L vs. 6,807 ± 1,483 μg/L and tumor concentrations of 8,725 ± 4278 μg/L vs. 7,294 ± 5,486 μg/L for stable vs. progressive disease, respectively).

Correlation between tumor 11C-sorafenib VT and tumor sorafenib concentration (A) or sorafenib tumor-to-plasma ratio (B) measured with LC-MS/MS.
Tumor Perfusion Effects Measured Using 15O-H2O PET
Tumor perfusion, measured using 15O-H2O PET, at baseline could be compared with that after 14 d of treatment in 5 of 8 patients. In the other patients, only 1 15O-H2O PET scan was performed, because of technical problems (n = 2) or early study dropout (n = 1). Higher perfusion of the tumor rim at baseline and after 14 d of treatment was associated with higher 11C-sorafenib VT in the tumor (baseline rS = 0.671, P = 0.020; day 14 rS = 0.641, P = 0.025) (Fig. 6A). However, no significant correlation between 11C-sorafenib uptake and total tumor perfusion at baseline and after 14 d of treatment was observed (baseline rS = 0.574, P = 0.056; day 14 rS = 0.485, P = 0.058).
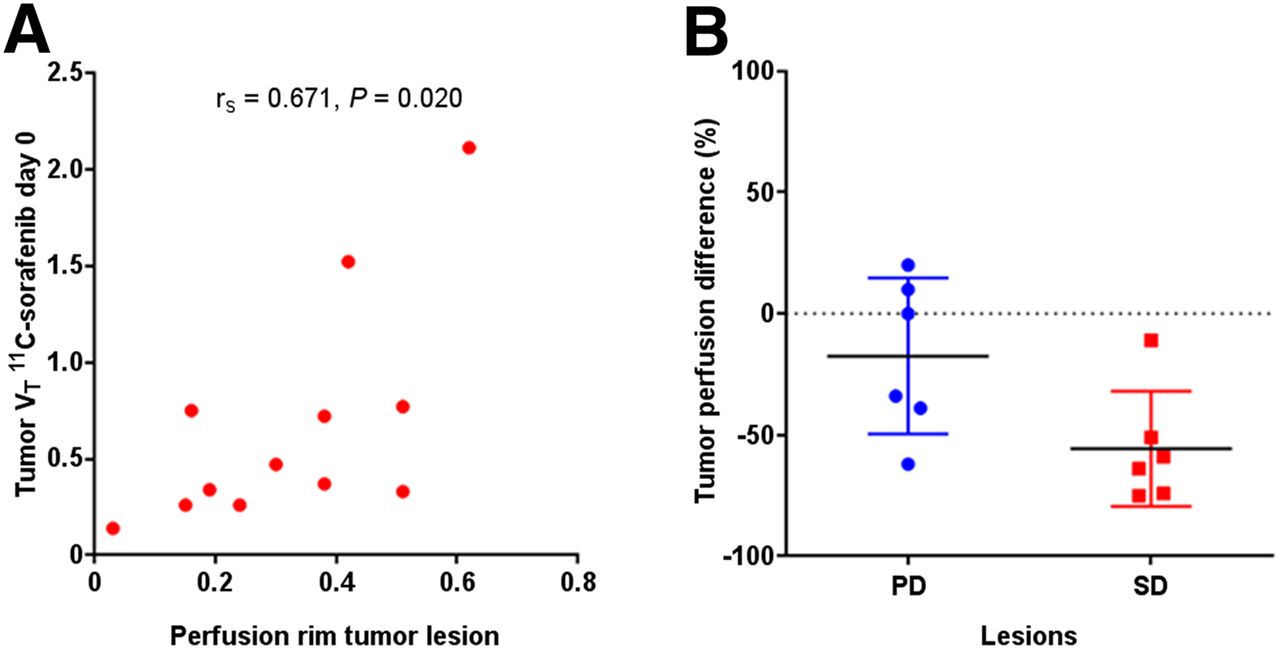
(A) Correlation between tumor 11C-sorafenib VT and perfusion of tumor rim. (B) Tumor perfusion difference after 14 d of sorafenib treatment in patients with PD and SD.
Analysis of tumor perfusion and clinical response revealed that patients with stable disease had a larger decrease in total tumor perfusion (56% ± 23%) after 14 d of sorafenib treatment than did patients with progressive disease (18% ± 32%) (Fig. 6B).
DISCUSSION
To the best of our knowledge, this was the first clinical study directly comparing tracer uptake with drug concentrations after therapeutic dosing measured with LC-MS/MS in corresponding tumor biopsy samples. Against expectations, this study showed that sorafenib concentrations in tumors during treatment could not be predicted by microdose 11C-sorafenib PET findings. Both LC-MS/MS and PET are very accurate for quantification of drug concentrations, with low test–retest variability in the range of 5%–10% (10,21,23,24). However, there are biopsy- and tracer-dependent factors that may explain the observed discrepancies between LC-MS/MS and PET.
Biopsies provide only 1 sample of the tumor lesion. In cases of intratumor heterogeneity, having only a single sample may lead to an under- or overestimation of sorafenib concentrations in the whole tumor. Overall, no significant intralesional heterogeneity of 11C-sorafenib uptake between the whole tumor and its outer rim was established in this study. However, in larger tumors, regional differences in 11C-sorafenib uptake were seen (Fig. 3), supporting sample effects as a potential contributing factor to the discrepancies observed between LC-MS/MS and PET.
Another reason for discrepancies between LS/MS-MS and PET may be tracer dependency. Linearity in tumor pharmacokinetics—in other words, dose proportionality—between microdose 11C-sorafenib and standard-dose sorafenib therapy was not observed in this study (Table 1). Nonlinearity has been reported in 27% of the ascending drug dose studies by comparison of plasma drug concentrations, as can be due to the levels of drug transporters, metabolic enzymes, and drug–target occupation (25,26).
First, drug-transporting systems may become partially saturated after prolonged exposure to therapy in comparison to the tracer dose. Sorafenib is a substrate for organic anion and cation transporters, but uptake depends mostly on passive diffusion into cells (27,28). In addition, sorafenib is a substrate for efflux transporters, in particular breast cancer resistance protein (ABCG2) and P-glycoprotein (ABCB1). Sorafenib has demonstrated a capacity to inhibit breast cancer resistance protein and P-glycoprotein in a dose-dependent manner (29,30). This capacity could potentially result in less tumor efflux of higher concentrations of sorafenib. However, the affinity of sorafenib for these efflux transporters has been shown to be weak, and tumor accumulation is therefore not likely influenced by transporter-mediated alterations (27). In this study, the 11C-sorafenib VT, which did not increase after 14 d of treatment, was consistent with this possibility (Table 1).
Second, sorafenib is metabolized in the liver by uridine diphosphoglucose-glucuronosyltransferase 1A9 to sorafenib glucuronide and by cytochrome P450 3A4 to the active metabolite sorafenib N-oxide (31). Saturation of these enzymes could add to the nonlinearity. 11C-sorafenib accumulated predominantly in the liver; however, metabolite release to the bloodstream was very low (<5%) as a result of rapid biliary excretion (31). Although therapeutic administration of sorafenib significantly reduced tracer uptake in the liver (P = 0.018) and increased available 11C-sorafenib in the blood pool (P = 0.018), these factors did not result in increased tumor accumulation of 11C-sorafenib after 14 d. In fact, tracer uptake decreased in most tumor lesions at day 14 (P = 0.007), most probably because of competition of the microdose with the much higher concentrations of unlabeled sorafenib after therapeutic dosing.
Finally, another potential cause for the different results between tracer uptake and sorafenib concentrations after therapy may be the complex drug–target binding characteristics of this multikinase inhibitor with fast reversible as well as slow reversible or irreversible target binding sites. Previously, the target binding kinetics have been shown to be slower for sorafenib than for sunitinib and lenvatinib, for example, and therefore the 1-h scanning time may have been too short to reflect drug–target occupation after 14 d of continuous sorafenib treatment (32,33). Overall, sorafenib showed a low accumulation in tumors. A recent study on mice also demonstrated that sorafenib had significantly less intratumoral drug accumulation than did other antiangiogenic drugs (8), as may in part be attributed to sorafenib’s higher protein-bound fraction in blood (>99%) and its strong binding affinity for albumin, because it is assumed that only the free (unbound) drug can induce a pharmacologic effect (34,35). In only 3 of the 8 patients was 11C-sorafenib accumulation higher in tumors than in plasma, and this finding correlated with increased perfusion of the tumor rim (for the whole tumor, this increase was only borderline-significant, presumably as a result of central tumor necrosis).
A higher 11C-sorafenib accumulation in tumors at baseline or after 14 d of sorafenib treatment did not relate to treatment benefit. On the contrary, clinical benefit was associated with lower 11C-sorafenib uptake in tumors, as may be a result of the lower tumor perfusion observed in these patients. This is a prognostic rather than a predictive imaging finding and in line with previous studies showing that higher expression of proangiogenic factors such as vascular endothelial growth factor, vascular endothelial growth factor receptors 1–3, and increased tumor vascularity were associated with poorer prognosis in patients with hepatocellular carcinoma, renal cell carcinoma, and follicular thyroid carcinoma (36–39). Some other microdose drug tracers, such as 11C-erlotinib and 11C-docetaxel, showed that higher tracer accumulation in tumors did in fact correlate with treatment benefit (9,40). The tracer signal of 11C-sorafenib is more complex because it binds to multiple pharmacologic targets with different affinities and because the signal may be dominated by some targets whereas other targets with less affinity may lead to stronger antitumor effects, and these target effects may also differ between different tumor types (41,42). In addition, neither LC-MS/MS–measured sorafenib concentrations in plasma nor tumor biopsy samples during therapy were useful predictors of clinical response in this exploratory study, possibly because the current tumor concentrations achieved with sorafenib therapy already induce sufficient protein kinase inhibition (42). However, another explanation may be that tumor concentrations reached with the current therapeutic schedule are in fact too low, resulting in overall marginal clinical activity. Consequently, even higher tumor concentrations may be necessary to improve the anticancer effects of sorafenib. Preclinical and clinical studies have indeed shown that higher levels of sorafenib exposure, in comparison with the levels reached with standard sorafenib dosing, are associated with improved antitumor activity, but dose escalation is limited by the toxicity of sorafenib (43–45).
The current exploratory study showed preliminary evidence that 15O-H2O PET has value in early prediction of response to sorafenib treatment. After only 2 wk of treatment, tumor blood flow decreased more in patients with clinical benefit than in patients with progressive disease (56% vs. 18%). Although these results are limited by the small cohort of this study, they are in line with other angiogenesis inhibitors. For example, early reduction in tumor perfusion as shown with 15O-H2O PET was also associated with clinical benefit in patients treated with bevacizumab and sunitinib (46,47). Thus, an early decrease in tumor perfusion may have predictive value for the outcome of sorafenib treatment. Given the potential benefit to patients of early response prediction, this finding warrants further investigation.
CONCLUSION
Microdose 11C-sorafenib PET findings were not useful for prediction of intratumoral sorafenib concentrations measured with LC-MS/MS during treatment. However, there was preliminary evidence for an association between a decrease in tumor perfusion after only 2 wk of sorafenib therapy and clinical benefit. This evidence warrants further investigation to assess its value as an early biomarker for sorafenib efficacy.
DISCLOSURE
Financial support was received from the Roche Innovation Fund (WP28389). No other potential conflict of interest relevant to this article was reported.
KEY POINTS
QUESTION: Do 11C-sorafenib and 15O-H2O PET have value for early evaluation of sorafenib therapy in patients with advanced solid malignancies?
PERTINENT FINDINGS: In this prospective exploratory study, 11C-sorafenib uptake in tumors at baseline and day 14 of treatment were not predictive for sorafenib concentrations after therapeutic dosing as measured in corresponding tumor biopsy samples using LC-MS/MS. There was preliminary evidence that a decrease in tumor perfusion measured with 15O-H2O PET after only 14 d of therapy correlated with clinical benefit, with a decrease in tumor perfusion of 56% ± 23% (mean ± SD) versus 18% ± 32% in patients with stable and progressive disease, respectively.
IMPLICATIONS FOR PATIENT CARE: Our results support that a larger prospective study is warranted to evaluate whether a decrease in tumor perfusion measured with 15O-H2O PET can indeed be used as an early therapeutic biomarker of sorafenib efficacy.
Footnotes
Published online Oct. 30, 2020.
- © 2021 by the Society of Nuclear Medicine and Molecular Imaging.
REFERENCES
- Received for publication July 26, 2020.
- Revision received October 8, 2020.


Jump to section
Related Articles
Cited By...
- No citing articles found.