


Visual Abstract

Abstract
Cyclooxygenase-2 (COX-2) is present in a healthy brain at low densities but can be markedly upregulated by excitatory input and by inflammogens. This study evaluated the sensitivity of the PET radioligand [11C]-6-methoxy-2-(4-(methylsulfonyl)phenyl)-N-(thiophen-2-ylmethyl)pyrimidin-4-amine ([11C]MC1) to detect COX-2 density in a healthy human brain. Methods: The specificity of [11C]MC1 was confirmed using lipopolysaccharide-injected rats and transgenic mice expressing the human COX-2 gene, with 120-min baseline and blocked scans using COX-1 and COX-2 selective agents. Twenty-seven healthy participants were injected with [11C]MC1. Ten of these participants received 2 PET scans: a baseline study followed by blockade with celecoxib (600 mg orally), a preferential COX-2 inhibitor. Seventeen participants underwent test–retest imaging. All scans included concurrent arterial sampling. The tissue-to-plasma ratio at equilibrium (i.e., total distribution volume) was determined using a 2-tissue compartment model (2TCM). Results: In humanized transgenic COX-2 mice, 70%–90% of [11C]MC1 brain uptake was blocked by nonradioactive MC1 and celecoxib (a COX-2 selective inhibitor) but not by PS13 (a COX-1 selective inhibitor), thereby confirming specific binding to human COX-2. Radioactivity in the human brain peaked at a concentration of about 4.0 SUV, indicating good passage through the blood–brain barrier. Values for the total distribution volume achieved stability after 80 min, indicating no radiometabolite contamination. Celecoxib reduced radioligand binding in neocortical areas by 25% but had little or no effect in subcortical regions and the cerebellum, which correlated with COX-2 messenger RNA expression levels. Binding site occupancy by celecoxib was virtually complete, as determined by the Lassen plots. Test–retest reliability was moderate (intraclass correlation coefficient, 0.65) but had relatively large variability (absolute retest variability, 20%). Reference tissue methods yielded results comparable to those of 2TCM but reduced retest variability by up to 75% and reduced intersubject variability (coefficient of variation) by about half. Thus, compared with 2TCM, which requires arterial blood, the reference tissue method is expected to significantly reduce the sample sizes required to detect statistically significant differences between groups. Conclusion: [11C]MC1 has adequate sensitivity to measure the low density of COX-2 in a healthy human brain, suggesting it can also quantify the COX-2 elevations expected in human disorders associated with neuroinflammation.
Both cyclooxygenase-1 (COX-1) and cyclooxygenase-2 (COX-2) convert arachidonic acid to a common precursor, prostaglandin H2, which is then converted by cell-specific enzymes to numerous prostanoids that have diverse functions (1). In the periphery, COX-1 generates prostanoids involving homeostatic functions, such as maintaining proper pH in the stomach and optimal platelet aggregation. In contrast, COX-2 is found in inflammatory myeloid cells, is markedly upregulated by inflammatory stimuli, and generates proinflammatory cytokines, and its inhibition is used as antiinflammatory therapy. The roles of these 2 enzymes are at least partially reversed in the brain (1). COX-1 is abundant in the brain, is primarily located in inflammatory cells (i.e., microglia and astroglia), and generates proinflammatory cytokines, and its inhibition is antiinflammatory. COX-2 has sparse density in the brain, is preferentially located in neurons, and its functions are largely unknown (2). However, as in the periphery, COX-2 in the brain can be markedly upregulated by inflammatory stimuli (3) and by neuroexcitation, including that associated with electroconvulsive seizures (4). Thus, the density of COX-2 in the brain may be a biomarker and effect of inflammation, even if it is not a mediator of the inflammatory process.
Our laboratory recently developed 6-methoxy-2-(4-(methylsulfonyl)phenyl)-N-(thiophen-2-ylmethyl)pyrimidin-4-amine (MC1), a COX inhibitor with higher selectivity and affinity for COX-2 in humans (inhibitory concentration of 50%, 3.0 ± 0.2 nM) than for COX-1 (inhibitory concentration of 50%, >1,000 nM) (5). The radioligand [11C]MC1 (Fig. 1) was found to lack the sensitivity to measure the low density of COX-2 in a healthy monkey brain but could do so if COX-2 was upregulated 1 d after intracerebral injection of the inflammogen lipopolysaccharide (3). In the same study, [11C]MC1 successfully visualized elevated COX-2 levels in the symptomatic joints of 2 individuals with rheumatoid arthritis. Taken together, the results demonstrated a preliminary way in which [11C]MC1 was sensitive enough to detect COX-2 in humans, that is, when levels were elevated to the high densities found in rheumatoid joints (3). However, the ability of [11C]MC1 to measure COX-2 in the human brain, particularly under healthy baseline conditions when COX-2 levels are minimal, remains to be established.

Coronal views of COX-2 staining in rat brain tissue collected 24 h after intracranial administration of 50 µg of lipopolysaccharide (LPS; A) and in healthy rat brain tissue (B). 3-mm scale bar is provided for reference. (C–F) Magnified views (×50) of various cortical and subcortical regions from both LPS-injected and healthy rat brains, showing LPS-injected right striatum (C), control striatum (D), LPS-injected right cortex (E), and control cortex (F). 100-µm scale bar is provided for reference; arrows point to COX-2–positive cells. (G) Relative COX-2 expression determined by comparing regional total number of COX-2–positive cells to area of region of interest (ROI) and normalizing against that of left subcortical (L_Subcortical) control region. ROIs are illustrated as follows: left cortical (L_Cortical) in green, L_Subcortical in gray, right cortical (R_Cortical) in purple, and right subcortical (R_Subcortical) in yellow. Error bars represent mean ± SD (n = 6).
This study evaluated the ability of [11C]MC1 to measure COX-2 levels in the healthy human brain. To assess [11C]MC1’s affinity for human COX-2, PET imaging was conducted in rats injected with lipopolysaccharide and in humanized transgenic COX-2 (hCOX-2) mice. Subsequently, healthy human volunteers were imaged under 3 conditions: first, to identify the optimal imaging duration and measurement technique; second, to assess pharmacologic specificity by blocking with celecoxib, a COX-2 selective inhibitor; and third, to assess reliability and variability in a test–retest study.
MATERIALS AND METHODS
The supplemental materials contain details on radiochemistry (3), stereotactic injection of the rats, horseradish peroxidase staining of COX-2, human and rodent data acquisition, radiometabolite plasma analysis (6,7), quantitative analysis and test–retest reliability, RNA extraction, and volumetric and surface-based PET protein atlases (supplemental materials are available at http://jnm.snmjournals.org) (8,9).
Healthy Participants
Ten healthy volunteers (5 men and 5 women, 39 ± 12 y, 72 ± 12 kg) underwent 2 120-min brain PET scans, 2 h apart: 1 at baseline and 1 after blockade with celecoxib (600 mg orally). A second group of 17 healthy volunteers (7 men and 10 women, 33 ± 7 y, 74 ± 13 kg) participated in a 90-min test–retest imaging study. Participants were screened for medical and psychiatric illnesses, determined via medical history, physical examination, electrocardiogram, and laboratory blood tests. None of the participants had taken nonsteroidal antiinflammatory drugs during the prior 2 weeks. This study was approved by the National Institutes of Health Institutional Review Board (NCT03912428 and NCT04396873). All participants provided written informed consent.
Data Sharing
Data were organized using the brain imaging data structure standard (10) with the extension for PET data (11,12). Primary reported data from all participants are freely available via OpenNeuroPET (accession number ds004869) ; animal data are also available via OpenNeuroPET (accession number ds005605). Primary data include PET and MR images, plasma measurements, and a detailed description of acquisition. The data are provided under a Creative Commons Zero license that allows anyone to use them at any time for any purpose without written agreement.
RESULTS
Lipopolysaccharide-Injected Rat Brain and hCOX-2 Mice
Horseradish peroxidase staining revealed pronounced upregulation of COX-2 expression in the brains of rats administered lipopolysaccharide compared with healthy control rats (Figs. 1A and 1B). The increase in COX-2 was extensive, showing an approximately 8-fold rise in the right striatum (the site of the lipopolysaccharide injection) and an approximately 5-fold increase in the cortical region of the same hemisphere. COX-2 levels were also elevated in the left hemisphere, reaching levels that were approximately 4-fold higher in the subcortical region and approximately 2-fold higher in the cortical region (Figs. 1C–1G). However, PET imaging of these injected rats detected no COX-2–specific signal in any region, because celecoxib (0.3 mg/kg intravenously) was unable to block brain uptake of the radioligand (Fig. 2). An ex vivo study showed that 98.5% of the radioactivity in a rat brain 30 min after administration of [11C]MC1 was from the parent compound, compared with 99.8% in an in vitro control (Supplemental Table 1). In contrast, hCOX-2 mice showed a robust PET signal that could be blocked by nonradioactive MC1 (−92%) and celecoxib (−74%; Figs. 2A and 2B); hCOX-2 mice are transfected with the human COX-2 gene, which is formally called prostaglandin-endoperoxidase 2 (PTGS2). However, the COX-1 inhibitor PS13 could not block brain uptake (Fig. 3), indicating that [11C]MC1 does not bind to COX-1. Furthermore, hCOX-2 mice expressed elevated levels of human COX-2 messenger RNA (mRNA) transcript PTGS2 but still maintained native mouse Ptgs2 levels comparable to those of wild-type mice (Fig. 2C).

(A) [11C]MC1 uptake in hCOX-2 mouse brain displayed prominent radioactivity blockable with 0.3 mg/kg nonradioactive MC1 or 0.3 mg/kg celecoxib; in contrast, there was minimal uptake in wild-type (WT) mouse brain. (B) PET-derived whole-brain time–activity curves for WT and hCOX-2 mice after intravenous administration of [11C]MC1, both at baseline and after administration of 0.3 mg/kg cold MC1 or celecoxib. (C) Elevated human PTGS2 expression was observed in hCOX-2 mouse brain, whereas mouse Ptgs2 expression was similar between WT and hCOX-2 mouse brains; humanized mice still expressed native COX-2. Relative PTGS2 expression was measured with β-actin as reference. Quantitative polymerase chain reaction analysis of PTGS2 expression in mice performed by Epigen DX. Error bars represent mean ± SD (n = 3 mice/group).
Healthy Human Brain
Both participant groups (baseline–blocked, n = 10; test–retest studies, n = 17) received comparable doses of radioligand in terms of injected activity, high molar activity, and low carrier mass (Supplemental Table 2 shows group values). No pharmacologic effects were noted during the PET scans, as indicated by subjective reports, blood pressure, pulse rate, temperature, respiratory rate, and electrocardiogram readings.
Plasma and Brain Kinetics
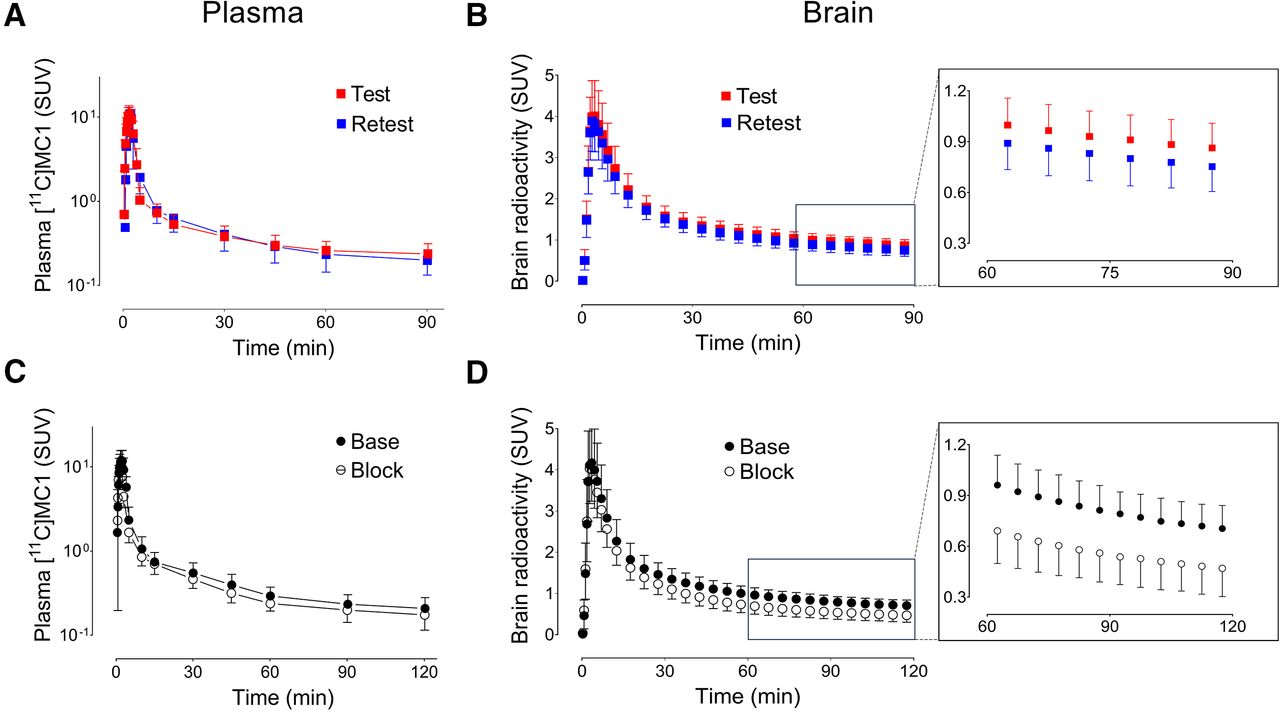
The plasma parent concentration of the radioligand peaked approximately 3 min after administration of [11C]MC1 and was followed by sharp decline (Fig. 3A). The plasma concentrations of the parent radioligand were similar in test and retest conditions (Fig. 3C), as well as in baseline and blocked conditions.

(A and B) Test–retest studies of 17 healthy human volunteers. (C and D) Baseline and blocked scans (after celecoxib, 600 mg orally; n = 10). (A and C) Concentration of parent radioligand [11C]MC1 in arterial plasma measured ex vivo with radio–high-performance liquid chromatography. (B and D) Concentration of radioactivity in occipital cortex measured with PET. Inserts show later points of brain time–activity curves, which tend to reflect receptor or enzyme density better than early points. Mean brain time–activity curves suggest that COX-2 density was slightly decreased on retest (B, insert) and more substantially decreased by celecoxib (D, insert). However, these mean values may be misleading, and more accurate quantitation requires individual analysis. Mean VT was insignificantly affected on retest but was significantly reduced by ketoprofen in region-selective manner (Table 1). Unit of concentration is SUV. Symbols and error bars represent mean and SD, respectively.
After intravenous administration, [11C]MC1 rapidly entered the brain; peaked around 4 min with an average concentration of 4.1 ± 0.9 SUV across 27 scans, which included 10 baseline and 17 test scans; and then sharply decreased (Figs. 3B and 3D). [11C]MC1 radiometabolites were all less lipophilic than the parent compound and reached 50% of all plasma radioactivity around 1 h (Fig. 4).

(A) Brain time–activity curves fit well with 2TCM but not with 1TCM. 2TCM assumes that radioligand has both high-affinity (specific) and low-affinity (nondisplaceable) binding in brain. Concentration in human occipital cortex at baseline was expressed as SUV. Symbols and error bars represent mean and SD (n = 10), respectively. (B) Representative PET images show distribution of radioactivity in healthy human brain. Selective COX-2 ligand celecoxib (600 mg orally) was taken 1 h before [11C]MC1 blocked scan. Highest specific binding was observed in occipital cortex, insula, and prefrontal cortex. Conc = concentration.
The brain and plasma time–activity curves (Fig. 3) were analyzed individually using compartmental modeling to calculate the tissue-to-plasma ratio at equilibrium (total distribution volume [VT]) in various brain regions. Brain time–activity curves were better fitted by a 2-tissue compartment model (2TCM) than by 1TCM (Fig. 4A). Thus, 2TCM was chosen for subsequent analyses. VT corrected for the free parent fraction in plasma (VT/fP) was determined with good identifiability, because the SE was less than 10% across all brain regions. Results from the Logan plot based on the individual’s arterial input function were consistent with those from 2TCM, deviating slightly with a minor negative bias of less than 3%.
The results in this paper were the same whether the data were expressed as VT or VT/fP—that is, corrected for plasma protein binding. VT/fP is reported here because it is theoretically more accurate, even though it has greater variability than VT. The effects of test–retest and blockade on fP values are presented in the supplemental materials.
Specific binding of [11C]MC1 to COX-2 was confirmed through blocking studies with celecoxib. Visual inspection of the brain images indicated that celecoxib predominantly displaced radioactivity in the neocortex, including the frontal, cingulate, temporal, parietal, and occipital cortices, as well as the insula (Fig. 4B). This visual inspection was confirmed with quantitative measures. Celecoxib decreased VT/fP by about 25% in neocortical regions but had no significant effects in subcortical areas, including the cerebellum and basal ganglia (∼3%; Fig. 5A; Table 1; Supplemental Table 3). This difference between cortical and subcortical areas aligns with higher PTGS2 mRNA transcript levels in the human neocortex (Fig. 5B). The blockade quantified by the Logan plot (−20%) was consistent with that observed with 2TCM (Table 1).

(A) Correlation between SRTM-derived BPND and VT/fP with Pearson coefficient of r = 0.78 (R2 = 0.6). (B) Correlation between Logan-RTM–derived distribution volume ratio (DVR) and VT/fP with Pearson coefficient of r = 0.98 (R2 = 0.97). (C) Correlation between SUVR, derived from 60–90-min PET frames, and VT/fP with Pearson coefficient of r = 0.92 (R2 = 0.85). For all panels, dots represent regional averages for 10 baseline and 17 test scans from retest study.
Four Methods to Quantify [11C]MC1 Binding in Brains of 10 Healthy Volunteers at Baseline and After Blocking with 600 mg of Celecoxib Given Orally
A 600-mg dose of celecoxib achieved more than 99% occupancy across all brain regions, as determined by Lassen plots using VT/fP from baseline–blocked scans (Fig. 6). Nondisplaceable distribution volume corrected for fP was inferred from the x-intercepts of the Lassen plots and was 83.4 mL·cm−3. These values were well identified individually, because the average linear regression had an R2 value of 0.89.

Analysis of time stability for VT of radioactivity within 4 brain regions during baseline (A) and blocked (B) scans. VT was determined using 2TCM and normalized to its terminal value at 120 min. Symbol and error bars denote mean and SD from 10 healthy volunteers, respectively.
The test–retest evaluation of regional VT/fP values showed moderate reliability but poor absolute retest variability. The intraclass correlation coefficient (ICC), which reflects reliability, was 0.65 across brain regions, which is considered moderately good (13). In contrast, the retest variability of VT/fP was 20% across all brain regions (Supplemental Tables 4 and 5); consensus suggests that a good value of variability would be less than 10%. Similar test–retest results were achieved with the Logan plot (Supplemental Table 6).
Quantification Using Reference Tissue Models
Three methods were used to calculate the ratio of specific to background uptake at equilibrium, also called the nondisplaceable binding potential (BPND): the simplified reference tissue model (SRTM), Logan reference tissue model (Logan-RTM), and SUV ratio (SUVR). Cerebellar gray matter was chosen as the reference region, because it had negligible specific binding (Fig. 5A; Supplemental Table 3). BPND calculated using SRTM from 27 PET scans (i.e., 10 baseline and 17 test scans from the retest study) was only weakly correlated with the 2TCM values of VT/fP (R2 = 0.6); this was attributed to poor model fitting in several regions and to the presence of some extreme outlier values (Fig. 5A). Applying SRTM2 did not significantly improve these correlations (data not shown). In contrast, the distribution volume ratio, which equals BPND + 1 and is obtained using Logan-RTM, was more strongly correlated with VT/fP (R2 = 0.97; Fig. 5B). SUVRs derived from the PET frames between 60 and 90 min also significantly correlated with VT/fP (R2 = 0.85; Fig. 5C).
Given these observations, further noninvasive quantification focused on Logan-RTM and SUVR. Pharmacologic blockade led to a decrease in the distribution volume ratio estimated by Logan-RTM of 30% and a reduction in SUVR by 32% in cortical regions (Table 1). In the test–retest dataset, Logan-RTM markedly decreased retest variability (7% vs. 20% with 2TCM) and slightly decreased reliability (ICC, 0.47 vs. 0.65 with 2TCM). The variability and reliability of SUVR (retest variability, 5%; ICC, 0.58) were better than those of Logan-RTM. However, both SUVR and Logan-RTM showed decreased ICC compared with 2TCM (0.65) or Logan plot (0.64; Supplemental Table 6).
The improved retest variability of SUVR compared with 2TCM presumably helped to decrease intersubject variability. For all 27 participants who had a baseline scan, the intersubject variability of VT/fP from 2TCM was an 18% coefficient of variation, whereas that from SUVR was only a 7% coefficient of variation. A sample size evaluation showed that SUVR requires only 14% of that using 2TCM to detect a 5% difference with an 80% power level and a 0.05 significance threshold (Supplemental Table 6).
Time Stability of VT
Regional VT values for all brain regions asymptotically approached their terminal values in both baseline and blocked scans (Fig. 6). The average VT values for all brain regions had stabilized to within 10% of their final values by 80 min, suggesting no significant accumulation of radiometabolites during the terminal portion of the scan (80–120 min).
Volumetric and Surface-Based PET Protein Atlases
Volumetric and surface-based PET protein atlases were constructed as previously described (9,14,15) to provide high-resolution surface and volumetric representations of the data using various PET imaging metrics (as shown in the supplemental materials). The patterns observed in the protein atlases for VT, specific distribution volume, BPND, ICC, retest variability, and between-subject variability (estimated as the coefficient of variation percentage) were found to align with results derived from 2TCM, underscoring the robustness of the findings (Fig. 7). The surface-based PET protein atlases showed increased ICC estimates compared with the volumetric analyses (Fig. 7C), suggesting that these analyses substantially improve the reliability and detectability of effects in the neocortex. This is because surface-based analyses respect the cortical geometry by smoothing the PET data along surfaces (9). The PET protein atlases will provide a resource for future studies, such as multimodal integration with other neuroimaging modalities (e.g., functional MRI and diffusion MRI).

PET protein atlases for various [11C]MC1 positron PET imaging metrics targeting COX-2. (A and B) VT (A) and BPND (B) through volume-based analysis (left) and surface-based analysis (right) tailored to respect cortical geometry of brain to enhance precision. (C) Between-subject variability for total COX-2 uptake, quantified as coefficient of variation, contrasting volumetric analysis (left) and surface-based analysis (right). Surface-based analysis respects unique cortical geometry of individual participants (left), thereby reducing partial-volume effects. Moreover, surface-based approach mitigates increased between-subject variability observed using volumetric analysis, which is exacerbated by differences in anatomy that lead to edge or boundary effects. By respecting cortical geometry, surface-based analysis reduces between-subject variability in cortex, consequently lowering number of participants needed in group analysis to detect similar statistical significance.
DISCUSSION
The present study documents the ability of [11C]MC1 to image human COX-2 in the healthy human brain. [11C]MC1 efficiently crossed the blood–brain barrier, bound to its designated target, demonstrated high specificity for human COX-2, and had a moderate ratio of specific to background uptake binding potential (BPND, ∼0.4) in cortical regions. VT of [11C]MC1 was reliably quantified using compartmental modeling and arterial plasma concentrations of the radioligand. The value of VT stabilized around 80 min after injection, suggesting an absence of radiometabolite accumulation in the brain. The absolute test–retest variability of VT/fP across brain regions averaged 20%, which is less than optimal. In contrast, the SUVR method, which does not require arterial blood sampling, provided a measure of receptor density absolute retest variability of only 5%, suggesting it will have good sensitivity to detect COX-2 density differences in healthy individuals.
This study examined both lipopolysaccharide-injected rats and hCOX-2 mice that express the human COX-2 gene. Despite a significant surge in COX-2 expression in lipopolysaccharide-injected rats, as indicated by horseradish peroxidase staining, PET imaging with [11C]MC1 showed negligible specific binding. This discrepancy appears to have been caused by a lower affinity of [11C]MC1 for rodent than for human COX-2, because the transgenic hCOX-2 mouse had robust and subtype selective binding to COX-2 that was completely blocked by celecoxib (0.3 mg/kg intravenously; Fig. 2).
In humans, [11C]MC1 effectively identified COX-2 expression. Celecoxib administration revealed specific binding predominantly in the neocortex (BPND, ∼0.4), aligning with previous studies (16,17) and presumably reflecting the low constitutive expression of COX-2 in cortical neurons (1,18). A BPND value of more than 0.5 is generally preferred for PET brain imaging; thus, a radioligand with higher affinity than that of MC1 would be useful. Here, regional values of [11C]MC1 were correlated with that of COX-2 mRNA expression. Although this provides supporting evidence for the tracer’s specificity, mRNA expression does not always correlate directly with protein expression.
Reference tissue models streamline the data acquisition process and avoid invasive arterial sampling, thus improving feasibility in clinical settings. The cerebellar gray matter, with minimal specific binding, was identified as a suitable reference region for [11C]MC1, a finding supported by blockade studies and mRNA expression analyses. SRTM showed poor correlation with 2TCM values of VT/fP and was therefore not explored further. The poor results may have been caused by the cerebellum containing minor specific binding. Consequently, SRTM results may be unpredictably biased (19). Logan-RTM, despite needing an appropriate reference region, avoids nonlinear fitting and offers more robust quantification. At the price of comparable reliability, Logan-RTM displayed lower variability, underscoring its usefulness as a viable and noninvasive alternative to compartmental modeling. Similarly, SUVR is not only noninvasive but also allows shorter acquisition. Furthermore, SUVR results were significantly less variable than those obtained with 2TCM but had similar reliability; this lower variability was likely due to avoiding input function noise and curve fitting errors. The low variability and stable quantification of these models ensured consistent and dependable imaging outcomes of [11C]MC1. Their noninvasive nature and ease of use make them especially suitable for longitudinal studies and extensive clinical trials, which is likely to enhance participant adherence and study feasibility. The implications of these benefits are far-reaching, because they may potentially speed up the application of neuroimaging findings to clinical practice, thereby enhancing both diagnostic precision and treatment strategies for neuroinflammatory and other neurologic conditions. Finally, to achieve the same level of statistical significance, a power analysis showed that SUVR requires 14% of the sample size needed using 2TCM. Our results indicate that reference tissue methods are adequate for detecting the low-level expression of COX-2 in healthy participants. However, these findings require validation in patient populations, where there may be a more widespread increase in target expression.
In assessing [11C]MC1 versus 18-kDa translocator protein (TSPO) PET, each tracer has distinct advantages, depending on the context. [11C]MC1 rapidly responds to inflammation, potentially offering earlier detection of acute inflammatory processes than TSPO PET, which tends to increase days after inflammation onset and peaks around 7–10 d (20). However, [11C]MC1 cannot be used in rodent models because of its negligible affinity for rodent COX-2. This study used transgenic mice to confirm the selectivity of [11C]MC1 for human COX-2; nevertheless, hCOX-2 mice cannot be used to study neuroinflammation, because the gene is constitutively expressed and not under the control of typical regulators of inflammation (C57BL/6-Tg(Thy1-PTGS2)303Kand/J). In contrast, TSPO PET can be used in various species to track inflammation over time, providing a broader picture of disease progression. Although neither tracer can be considered superior, the choice between [11C]MC1 and TSPO PET should be guided by the specific needs of the research, such as the phase of inflammation studied and the model used.
CONCLUSION
This study found that the PET radioligand [11C]MC1 had adequate sensitivity to quantify COX-2 expression in the healthy human brain, making it a promising biomarker of neuroinflammation. Our results confirmed that [11C]MC1 binding is specific to COX-2, based on selective pharmacologic blockade in hCOX-2 mice and by significant blockade by celecoxib in the human neocortex. Quantitation of COX-2 was accomplished with both gold-standard methods, which require arterial blood sampling, and reference tissue methods, which do not require blood sampling and increase the sensitivity to detect changes in the neocortex. These findings strongly support the notion that [11C]MC1 has adequate sensitivity to detect elevated COX-2 levels that may occur in various brain disorders.
DISCLOSURE
This study was funded by the Intramural Research Program of the NIMH/NIH (ZIAMH002852, ZIAMH002793, NCT03912428, and NCT04396873). No other potential conflict of interest relevant to this article was reported.
KEY POINTS
QUESTION: Does the PET radioligand [11C]MC1 have adequate sensitivity to detect the low density of COX-2 in a healthy human brain?
PERTINENT FINDINGS: Both a test–retest study and a blockade by celecoxib showed that [11C]MC1 could quantify the density of COX-2, which was almost exclusively located in the neocortex.
IMPLICATIONS FOR PATIENT CARE: [11C]MC1 has adequate sensitivity to measure the low density of COX-2 in a healthy human brain and thus potentially elevated densities in neuroinflammatory disorders.
ACKNOWLEDGMENTS
We thank the Human Brain Collection Core (NIMH) for providing human brain tissue samples and Ioline Henter (NIMH) for invaluable editorial assistance.
Footnotes
Published online Jan. 23, 2025.
- © 2025 by the Society of Nuclear Medicine and Molecular Imaging.
REFERENCES
- Received for publication July 31, 2024.
- Accepted for publication November 19, 2024.
In this issue


Jump to section
Related Articles
Cited By...
- No citing articles found.