


Abstract
Most clinical trials exploring various combinations of chemo- and immunotherapy rely on serial biopsy to provide information on immune response. The aim of this study was to assess the value of 18F-arabinosyl guanine (18F-AraG) as a noninvasive tool that profiles tumors on the basis of the key player in adaptive antitumor response, CD8+ cells, and evaluates the immunomodulatory effects of chemotherapy. Methods: To evaluate the ability of 18F-AraG to report on the presence of CD8+ cells within the tumor microenvironment, we imaged a panel of syngeneic tumor models (MC38, CT26, LLC, A9F1, 4T1, and B16F10) and correlated the signal intensity with the number of lymphocytes found in the tumors. The capacity of 18F-AraG to detect immunomodulatory effects of chemotherapy was determined by longitudinal imaging of tumor-bearing mice (MC38 and A9F1) undergoing 2 types of chemotherapy: oxaliplatin/cyclophosphamide, shown to induce immunogenic cell death, and paclitaxel/carboplatin, reported to cause immunogenically silent tumor cell death. Results: In the tumor panel, 18F-AraG revealed strikingly different uptake patterns resembling cancer-immune phenotypes observed in the clinic. A statistically significant correlation was found between the 18F-AraG signal and the number of PD-1–positive CD8+ cells isolated from the tumors (r 2 = 0.528, P < 0.0001). In the MC38 model, paclitaxel/carboplatin did not result in an appreciable change in signal after therapy (1.69 ± 0.25 vs. 1.50 ± 0.33 percentage injected dose per gram), but oxaliplatin/cyclophosphamide treatment led to close to a 2.4-fold higher 18F-AraG signal (1.20 ± 0.31 vs. 2.84 ± 0.93 percentage injected dose per gram). The statistically significant increase in signal after oxaliplatin/cyclophosphamide was also observed in the A9F1 model (0.95 ± 0.36 vs. 1.99 ± 0.54 percentage injected dose per gram). Conclusion: The ability of 18F-AraG PET to assess the location and function of CD8+ cells, as well immune activity within tumors after immune priming therapy, warrants further investigation into its utility for patient selection, evaluation of optimal time to deliver immunotherapies, and assessment of combinatorial therapies.
Tumor microenvironment (TME) consists of multiple, mutually interacting components that collectively form an immunosuppressive, tumor-promoting environment that affects the tumor’s aggressiveness, metastatic potential, and response to therapy (1). The impressive clinical successes achieved with checkpoint inhibitors convincingly illustrate the importance of TME modulation in cancer treatment (2). However, objective and durable responses have, to date, been attained in only a relatively small fraction of patients with solid tumors. Although the exact reasons for low response rates are yet to be defined, the evidence supports the significance of weak immune activity within tumors. A robust intratumoral infiltration by immune cells has been correlated with a good clinical outcome in colorectal cancer, melanoma, and cancers of the breast, bladder, ovary, and lung, among others (3). Of the 3 basic cancer-immune phenotypes found across different tumor types—immune-inflamed, immune-excluded, and immune-desert—inflamed tumors show the best response to immunotherapy (4).
To enable successful immunotherapy in a larger population of patients, many novel therapies aim to create a hot immune environment conducive to successful immunotherapy (5). The discovery of the immune response that results from chemotherapy-induced tumor cell death, termed immunogenic cell death (6), has sparked interest in harnessing chemotherapy’s immunomodulatory effects for possible synergistic combinations with immunotherapeutics (7,8). Immunogenic cell death is signified by a series of processes that allow chemotherapeutics to act as an in situ vaccine, generating innate and adaptive immune responses. Cell-surface translocation of proteins associated with dying cells, such as calreticulin and heat shock proteins, as well as the release of other danger-associated molecular patterns, such as high-mobility group box 1 and adenosine triphosphate, stimulate mobilization of dendritic cells, engulfment of apoptotic cells, processing and presentation of antigens, and activation of T cells (8).
The number of trials that test programmed cell death 1 (PD-1) and programmed cell death ligand 1 (PD-L1) checkpoint inhibitor therapy in combination with chemotherapy far exceeds immunotherapy combination trials with any other type of cancer treatment (9). Most of these trials rely on multiple biopsy specimens acquired before and during chemoimmunotherapy to provide information on the changes in the immune contexture (10). However, invasiveness and sampling variability diminish the utility of serial biopsy in immunomonitoring. Herein, we assess the value of using 18F-arabinosyl guanine (18F-AraG), a PET agent relatively specific for activated T cells (11–13), as a noninvasive tool that profiles tumors on the basis of the key player in adaptive antitumor response, CD8+ cells, and evaluates the immunomodulatory effects of chemotherapy.
MATERIALS AND METHODS
Cell Lines and Tumor Models
Lewis lung carcinoma (LLC), colon adenocarcinoma (MC38), colorectal carcinoma (CT26), melanoma (B16F10), and mammary (4T1) cell lines were purchased through ATCC. With the help of Dr. Esteban Celis (Augusta University, Augusta, GA), LLC subclone (A9F1) cells were obtained from Dr. Lea Eisenbach (Weizmann Institute of Science, Rehovot, Israel) (14). A9F1, LLC, MC38, and B16F10 cells were cultured in Dulbecco modified Eagle medium (GE Healthcare–HyClone) with 10% fetal bovine serum (GE Healthcare) and 1% penicillin:streptomycin solution (GE Healthcare). CT26 and 4T1 cells were cultured in RPMI 1640 (GE Healthcare) containing 10% fetal bovine serum, 1% minimum essential medium nonessential amino acids (Corning), 1% sodium pyruvate (Corning), and 0.5% polyacrylamide gel electrophoresis β-mercaptoethanol. Tumor volume was determined by measuring 2 opposing diameters and using the formula V = π/6(length × width)3/2.
Six- to 8-wk-old C57BL/6 (n = 16) and BALB/C (n = 8) (Jackson Laboratory) mice were shaved at the left flank 2 d before injection and monitored for irritation. C57BL/6 mice were subcutaneously injected into the left flank with the following: 2 million A9F1 cells, 0.5 million MC38 cells, 0.3 million LLC cells, and 0.5 million B16F10 cells. BALB/C mice were subcutaneously injected into the left flank with 0.75 million CT26 cells and 0.5 million 4T1 cells.
All animal care and experiments were conducted at University of California, San Francisco, facilities accredited by the American Association for Accreditation of Laboratory Animal Care. All animal studies were performed with the approval of the institutional animal care and use committee.
18F-AraG Imaging of Tumor Model Panel
Tumor-bearing mice (MC38, CT26, LLC, A9F1, 4T1, and B16F10; n = 4 for each group) were imaged 14 d after tumor implantation. All images were obtained using a dedicated small-animal PET/CT device (Inveon; Siemens Medical Solutions). 18F-AraG (5.5–7.4 MBq within 100–200 μL of sterile saline) was administered intravenously to all animals via the tail vein under anesthesia (2%–2.5% isoflurane). An uptake time of 60 min was allowed before the start of every scan. During the uptake time, the animals were kept awake within their cages over a temperature-controlled heating pad at 37°C, as necessary. Fifteen minutes of static PET data were acquired for all animals, followed by CT to provide an anatomic reference. Region-of-interest analysis of the PET/CT data was performed using VivoQuant software (version 3.5; Invicro). For the lymph nodes, the regions of interest were defined by placing a fixed-volume sphere at the anatomically correct location. Partial-volume correction was not performed. The percentage injected dose per gram was calculated for each region of interest.
18F-AraG Imaging of Tumor-Bearing Mice Undergoing Chemotherapy
Mice carrying MC38 (n = 8), A9F1 (n = 8), and 4T1 (n = 8) tumors were split into 2 sets. One group of mice (n = 4) was treated with oxaliplatin (2.5 mg/kg of body weight) and cyclophosphamide (50 mg/kg of body weight), and the other set was treated with paclitaxel (10 mg/kg of body weight) and carboplatin (10 mg/kg of body weight). All drugs were purchased from TCI America. The mice were imaged periodically over the course of 2 wk: 1 d before the start of therapy, then 3 and 6 d after the first chemotherapy administration, and 3 d after the second chemotherapy administration (Supplemental Fig1; supplemental materials are available at http://jnm.snmjournals.org). PET imaging and analysis were performed the same as for the tumor model panel.
Fluorescence-Activated Cell-Sorting Analysis
The mice were euthanized 24 h after the last imaging time point. Tumors were excised and single-cell suspensions were prepared using a gentleMACS Octo Dissociator (Miltenyi Biotec) according to the manufacturer’s instructions. Tumors were dissociated by a combination of mechanical dissociation and enzymatic digestion (mouse tumor dissociation kit, 130-096-730, MACs; Miltenyi Biotec). After dissociation, samples were passed through 70- and 30-μm cell strainers to remove any remaining larger particles from the single-cell suspension. For flow cytometry, an aliquot of each sample, containing 1 million cells, was transferred into a 12 × 75 mm polystyrene tube, and TruStain FcX (common epitope of CD16/CD32; BioXcell) was added to block nonspecific binding. Cell-surface staining with fluorescently labeled antibodies for various markers was performed in a staining buffer (phosphate-buffered saline containing 0.5% bovine serum albumin and 0.02% sodium azide) for 30 min at 4°C. For FoxP3 staining, the cells were washed with staining buffer, fixed and permeabilized (Foxp3 transcription factor staining buffer kit; eBioscience), and intracellularly stained with FoxP3 antibody. Cell viability for fluorescence-activated cell sorting was determined by staining primary isolated cells with an amine reactive dye (violet Live/Dead viability kit; Thermo Fisher) with 405-nm/450-nm excitation/emission maxima. The data were collected on a FACSAria II or III (BD Biosciences) and analyzed using FlowJo software.
Additional information on the antibodies used is provided in Supplemental Table 1.
RESULTS
18F-AraG Reveals Distinct Patterns of Uptake in Different Tumor Types
To mimic the variations in cancer-immune phenotypes observed in the clinic, we created 6 syngeneic tumor models reported to have different immune contextures (15,16): colon (MC38 and CT26), LLC and A9F1 (an immunogenic Lewis lung clone), breast (4T1), and melanoma (B16F10). 18F-AraG accumulation in tumors and in tumor-draining lymph nodes (TDLN) varied not only among different tumor types but also among individual mice of the same tumor type (Fig. 1). Qualitatively, 18F-AraG revealed strikingly different intratumoral uptake patterns (Fig. 1A): signal in the tumor core (MC38 and A9F1), signal encircling the tumor (CT26), signal at the tumor margin (half-moon signal in LLC and patchy signal in B16F10), and absence of signal (4T1).

18F-AraG imaging of different syngeneic tumor models. (A) Both intratumoral (arrowheads) and intranodal (encircled) signal varied among different tumor types. Location of intratumoral signal showed several patterns, from signal present in core (MC38 and A9F1) through halolike (CT26) to signal present only at margin (LLC, B16F10). Ring effect as observed in bladder signifies saturated signal. (B) Intratumoral signal intensity showed variation among different tumor types and among individual mice of same tumor type. Signal in TDLNs was higher than signal in tumors and showed variability among different tumor types and individual mice (n = 4 for each tumor type; error bars represent SD). LN = lymph node; T = tumor; %ID = percentage injected dose.
Intratumoral signal intensity showed an expected variation among tumor types and individual mice (Fig. 1B). The lowest signal was observed in 4T1 tumor–bearing mice, whereas mice carrying MC38, CT26, and A9F1 tumors showed the highest signal intensity. The differences in 18F-AraG accumulation were also observed in the TDLNs (Fig. 1B). Although some mice showed a strong intranodal signal (MC38 and A9F1), others (4T1 and B16F10) showed only a faint signal in the TDLNs.
Syngeneic Tumor Model Panel Captures Heterogeneity in CD4+ and CD8+ Contexture
To evaluate CD4+ and CD8+ contexture, tumors were excised 1 d after imaging and immune infiltrates were isolated and analyzed. Similar to the immune variations observed in the clinic, the immune contexture in these preclinical models varied not only among different tumor types but also among individual mice with the same tumor type (Fig. 2). Because the sizes varied among different tumor types (Supplemental Fig. 2), the models were compared in terms of both the number of cells per gram of tumor (Fig. 2A) and the number of cells found in each tumor (Fig. 2B). The highest density of total lymphocytes, as well as CD4+ and CD8+ cells, believed to be crucial for tumor control, was found in the smallest tumors, A9F1 (Fig. 2A). In contrast, the highest number of lymphocytes was isolated from the largest tumors, 4T1 (Fig. 2B). Interestingly, although abundant in 4T1 tumors, only a fraction of CD8+ cells expressed PD-1 (Fig. 2C). In LLC and A9F1 tumors, over 97% of CD8+ cells were found to be PD-1–positive, whereas in 4T1 tumors, less than 30% of CD8 cells expressed PD-1. Although PD-1 expression alone cannot distinguish between exhausted and functional CD8 cells, in the context of rapidly growing tumors such as 4T1, the lack of PD-1 expression suggests impaired T-cell activation rather than antigen clearance (17).
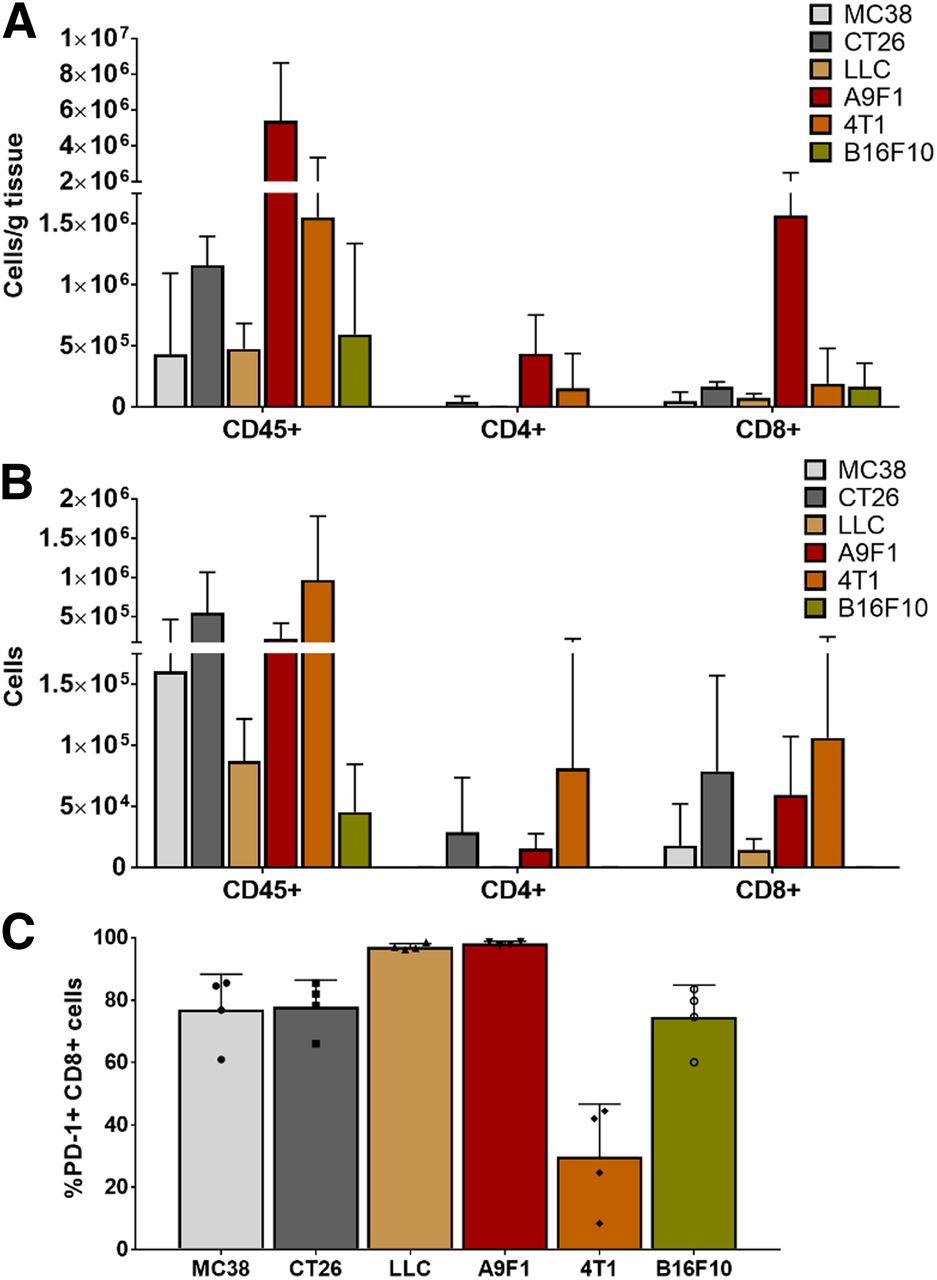
Evaluation of different syngeneic tumor models. (A) Highest density of total lymphocytes, CD4+, and CD8+ cells was found in smallest tumors, A9F1. (B) Highest number of lymphocytes was isolated from largest tumors, 4T1. (C) Percentage of CD8 cells that expressed PD-1 varied among different tumor types. In LLC and A9F1 tumors, over 97% of CD8 cells were found to be PD-1–positive, whereas in 4T1 tumors less than 30% of CD8 cells were positive for PD-1 (n = 4 for each tumor type; error bars represent SD); symbols within bars represent individual mice).
18F-AraG Signal Correlates with Number of PD-1–Positive CD8 Cells
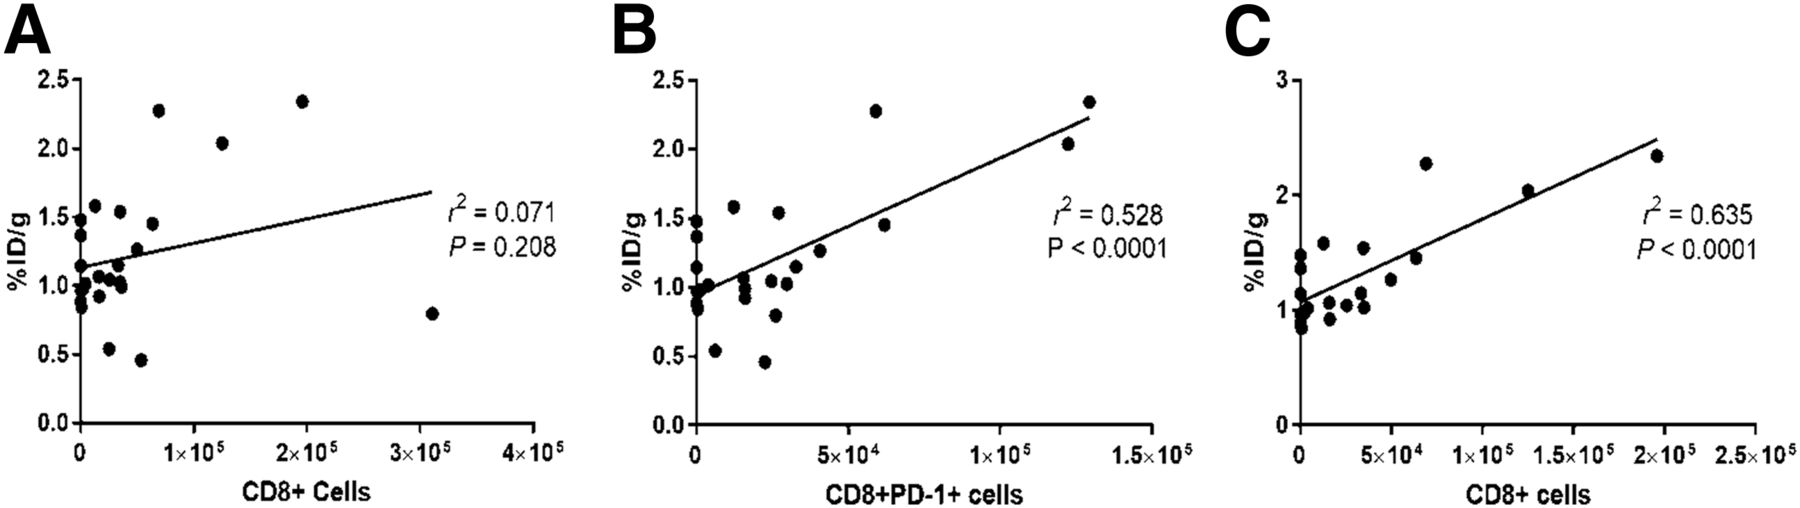
To evaluate the ability of 18F-AraG to report on the presence of CD8+ cells within the TME, the signal intensity was correlated with the number of lymphocytes found in the tumors (Fig. 3). Although 18F-AraG intensity did not correlate with the number of total CD45+, CD11b+ (Supplemental Fig. 3), or CD8+ cells (Fig. 3A) found in the tumor, a statistically significant correlation was found with the number of PD-1–positive CD8+ cells (Fig. 3B). It is interesting to note that excluding data from 4T1 tumors that showed low PD-1 expression indicative of dysfunction of T-cell activation resulted in a statistically significant correlation between the signal and the number of CD8+ cells (Fig. 3C).

Correlation of 18F-AraG signal with number of CD8 cells present in TME. (A) 18F-AraG signal showed no correlation with number of intratumoral CD8+ cells. (B) 18F-AraG signal showed statistically significant correlation with number of CD8+PD-1+ cells. (C) Exclusion of 4T1 cells for which PD-1 expression indicated dysfunction led to statistically significant correlation between 18F-AraG signal and number of CD8+ cells. %ID = percentage injected dose.
18F-AraG Can Evaluate Immunomodulatory Effects of Chemotherapy
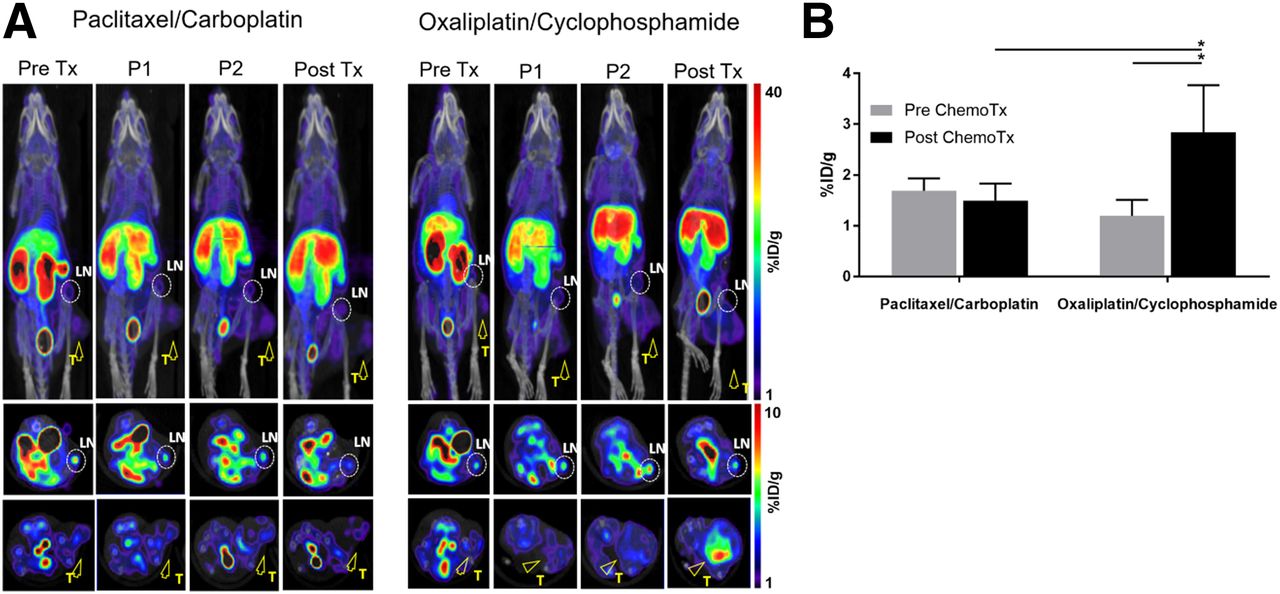
To assess the ability of 18F-AraG to detect the immunomodulatory effects of chemotherapy, we performed longitudinal imaging of MC38 mice undergoing 2 types of chemotherapy, oxaliplatin/cyclophosphamide (known to induce immunogenic cell death) and paclitaxel/carboplatin (reported to cause immunogenically silent tumor death) (Supplemental Fig. 1) (18). Although the signal did not change significantly after the first administration of either of the 2 chemotherapy combinations (Fig. 4A, panels P1 and P2), the second treatment with the oxaliplatin/cyclophosphamide combination resulted in a dramatic change in the 18F-AraG signal (Fig. 4A, posttherapy panel). Although in the paclitaxel/carboplatin group the signal did not change appreciably after therapy (1.69 ± 0.25 vs. 1.50 ± 0.33 %ID/g), oxaliplatin/cyclophosphamide treatment led to close to a 2.4-fold higher 18F-AraG signal (1.20 ± 0.31 vs. 2.84 ± 0.93 %ID/g) (Fig. 4B).

18F-AraG longitudinal imaging of MC38-bearing mice undergoing chemotherapy. Chemotherapy was administered once weekly for 2 wk. Mice were imaged 1 d before start of therapy (Pre Tx) and then 3 d (P1) and 6 d (P2) after first chemotherapy administration and 3 d after second chemotherapy administration (Post Tx). (A) Paclitaxel/carboplatin treatment did not lead to appreciable changes in signal intensity. Dramatic increase in signal intensity was detected after 2 oxaliplatin/cyclophosphamide injections. Encircled areas are TDLNs; arrowheads point to tumors. (B) 18F-AraG signal detected after oxaliplatin/cyclophosphamide treatment was significantly different from pretherapy signal as well as signal after paclitaxel-carboplatin treatment (n = 4 for each group; error bars represent SD). LN = lymph node; T = tumor; %ID = percentage injected dose. *P < 0.05.
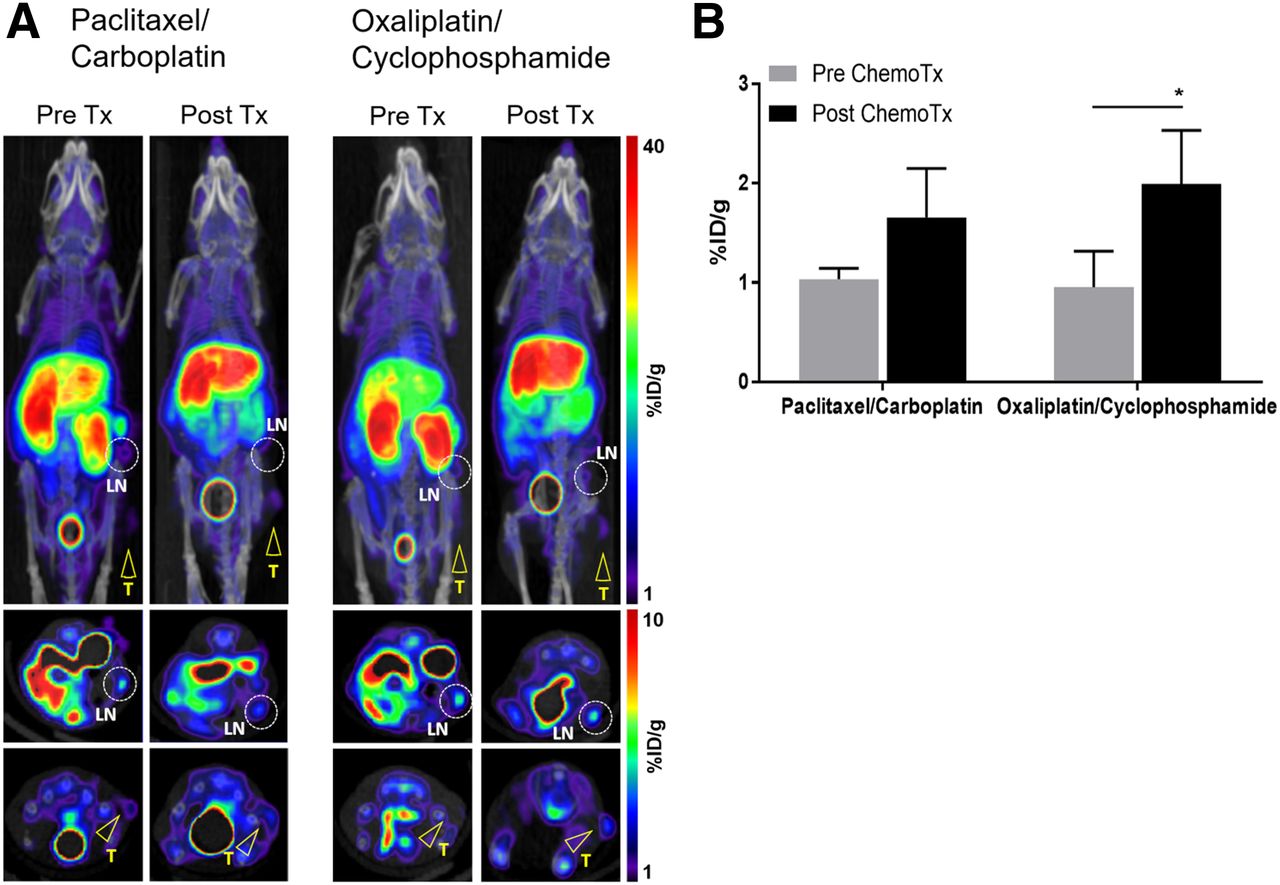
The increase in signal after chemotherapy was also observed in A9F1-bearing mice (Fig. 5A). Although both chemotherapy regimens led to an increase in signal, only oxaliplatin/cyclophosphamide led to a statistically significant signal change (Fig. 5B).

18F-AraG imaging of A9F1-bearing mice undergoing chemotherapy. (A) Paclitaxel/carboplatin treatment showed trend toward increase in signal. Oxaliplatin/cyclophosphamide treatment led to increase in intratumoral signal. Encircled areas are TDLNs; arrowheads point to tumors. (B) Signal detected after oxaliplatin/cyclophosphamide treatment was significantly different from pretherapy signal but not from signal after paclitaxel-carboplatin treatment (n = 4 for each group; error bars represent SD). LN = lymph node; T = tumor; %ID = percentage injected dose. *P < 0.05.
In contrast to the changes observed in MC38 and A9F1 tumors, the posttherapy 18F-AraG signal in 4T1 tumors did not differ from the baseline signal for either of the 2 chemotherapy regimens (Supplemental Fig. 4).
Change in Immune Contexture Corresponds to Observed Changes in 18F-AraG Signal
One day after the final 18F-AraG scan, MC38 and A9F1 tumors were excised and tumor-infiltrating lymphocytes isolated and characterized. Compared with paclitaxel/carboplatin, oxaliplatin/cyclophosphamide therapy led to an increase in total lymphocytes in both MC38 and A9F1 tumors. However, the effect on the number of CD4+ and CD8+ cells was different in these 2 tumor types. In the MC38 model, treatment with oxaliplatin/cyclophosphamide resulted in an increase in CD8+ cells, whereas in A9F1 tumors it had a larger effect on the number of CD4+ cells (Fig. 6A). However, although the number of CD4+ cells in MC38 tumors was found to be similar in both treatment groups, further analysis of the CD4 cell subset revealed a lower intratumoral abundance of regulatory CD4+FOXP3+ cells in mice treated with oxaliplatin/cyclophosphamide. Consequently, the ratio of effector CD8+ cells to regulatory CD4+FOXP3+, found to have prognostic significance (19), was 27-fold higher in the oxaliplatin/cyclophosphamide group than in paclitaxel/carboplatin-treated mice (Fig. 6B). This striking difference in immune contexture agrees well with the statistically significant difference in signal between the groups of mice treated with different chemotherapy drugs (Fig. 4B). Furthermore, in the A9F1 model, in which the difference between the 2 chemotherapy groups was not statistically significant (Fig. 5B), no changes in the ratio of CD8+ to CD4+FOXP3+ were recorded (Supplemental Fig. 5).

Lymphocyte profile of MC38 and A9F1 tumors after chemotherapy. (A) In MC38 tumors, oxaliplatin/cyclophosphamide treatment led to increase in total lymphocytes and number of CD8+ cells. In A9F1 tumors, oxaliplatin/cyclophosphamide treatment led to increase in total lymphocytes and number of CD4+ cells. (B) In MC38 tumors, ratio of CD8+ to CD4+FOXP3+ cells in oxaliplatin/cyclophosphamide group was 27 times higher than in paclitaxel/carboplatin-treated mice. (n = 4 for each group; error bars represent SD). *P < 0.05.
DISCUSSION
In contrast to the impressive strides in the development of novel immunotherapeutic approaches, immune biomarkers that enable patient selection, evaluation of therapy response, and the optimal time to start immunotherapy remain unsolved clinical challenges. As a noninvasive, whole-body technique that can track biologic processes, PET provides a strong framework for development of imaging biomarkers capable of evaluating complex immunologic interplays.
Many efforts in the development of imaging biomarkers focus on T cells, in particular CD8+ cells, because they play a central role in adaptive immune response and their presence in the TME largely indicates a positive prognosis (3). We and others have reported several T-cell–based imaging biomarkers showing promise in predicting immunotherapy response (13,20–23). Here, we assessed the ability of 18F-AraG, a PET agent that preferentially accumulates in activated CD8+ T cells, to report on the CD8+ profile of tumors before starting any therapy and to track immunomodulation of the TME during immune priming by chemotherapy.
The 6 syngeneic models chosen to represent variations in cancer immune microenvironment observed in the clinic showed the expected immunologic heterogeneity. Tumors differed in terms of the size, number, and density of CD4+ and CD8+ cells. 18F-AraG imaging was able to successfully capture the diversity among tumor models. Interestingly, the patterns of signal location within tumors were highly reminiscent of the 3 basic cancer immune phenotypes: immune-inflamed, with signal in the core; immune-excluded, with signal at the margin; and immune-desert, with signal void. This capacity to report on the location of the immune infiltrates within tumors could allow noninvasive assessment of cancer immune phenotype, akin to immunoscore (24), and evaluation of T-cell migration after therapy. Importantly, 18F-AraG scans agreed well with the CD8+ profile of the tumors. The lack of PD-1 expression isolated from 4T1 tumors well infiltrated with CD8+ cells, suggestive of the activation dysfunction, was reflected in the low signal in the tumor and the primary site of antigen presentation, TDLN. On the other hand, A9F1 tumors, abundant in PD-1–positive CD8+ cells, showed a high intratumoral and intranodal signal. The holistic assessment of not only the presence but also the functional status of lymphocytes in both tumors and TDLNs may provide clues into different factors that can affect therapy outcome, such as metabolism or antigen recognition, and thus help in rational selection of combinatorial therapies (25,26).
The ability of 18F-AraG to provide the CD8+ status of tumors was demonstrated by correlating the tracer’s intratumoral uptake with the number of CD8+ cells isolated from the tumors. A statistically significant correlation was found between the signal and the number of CD8+ PD-1+ cells but not with the number of all lymphocytes isolated from the tumors. Although the correlation seems to be only moderate (r 2 = 0.528, P < 0.0001), this is anticipated, because the accumulation of 18F-AraG in T cells rests on its phosphorylation by kinases, whose activity depends on the functional state of T cells (11,13,27). A metaanalysis of studies correlating tumor cell proliferation with 18F-FDG uptake, whose mechanism of accumulation in cancer cells parallels that of 18F-AraG in activated T cells, found a similar level of correlation for many tumor types (28). The correlation between 18F-AraG signal and intratumoral CD8+ PD-1+ cells could have significant clinical implications. A study investigating the PD-1 expression of intratumoral CD8+ cells in a small cohort of patients with non–small cell lung cancer found the presence of tumor-infiltrating lymphocytes with high PD-1 expression to be strongly predictive of response to PD-1 therapy and survival, thus indicating that the quantification of this CD8+ subset may serve as a promising proxy for the antitumor T-cell potential (29).
Longitudinal imaging of chemotherapy clearly demonstrated the ability of 18F-AraG to evaluate the immunomodulatory effect of chemotherapy. Oxaliplatin/cyclophosphamide treatment led to statistically significant increases in signal in MC38- and A9F1-bearing mice. Interestingly, there were notable differences between the 2 models. In the MC38 model, the striking 2.4-fold increase in posttherapy signal was observed only in mice treated with oxaliplatin/cyclophosphamide, whereas the signal after paclitaxel/carboplatin therapy did not change appreciably. In the A9F1 model, both chemotherapy combinations led to a change in the signal, but only oxaliplatin/cyclophosphamide treatment resulted in a statistically significant, 2-fold signal increase.
These imaging results corresponded to the differences in the TME that were detected among chemotherapies and tumor models. Oxaliplatin/cyclophosphamide resulted in the increase in lymphocytes for both tumor types, but the effect on the CD4 and CD8 subsets depended on the tumor type. In the MC38 colon cancer model, oxaliplatin/cyclophosphamide led to a 27-fold increased ratio of CD8+ to CD4+FOXP3+ cells compared with paclitaxel/carboplatin, indicating a more immune-active TME. Supportive of these findings, in metastatic colorectal cancer patients low-dose cyclophosphamide induced regulatory T-cell depletion and boosted antitumor immunity (30).
CONCLUSION
Our data suggest that 18F-AraG PET is a promising tool for CD8 profiling of tumors and evaluation of chemotherapy-based immune induction strategies. The findings raise the question of what threshold signal or signal change is needed for adequate immune priming. That question, along with the relevance of the type of cellular changes occurring in the TME to the immune priming, will be addressed in future studies. One of the limitations of the study is the narrow focus on CD8+ cells, which neglects the complexity of immune contexture and the sometimes contradictory roles it may have on progression and rejection of different tumor types. Nonetheless, by focusing on activated T cells, 18F-AraG may indirectly report on the behavior of other major players and thus the immune activity of the TME, especially in tumor types for which strong evidence supports the positive predictive value of CD8+ cells, such as breast cancers and head and neck cancers. The ability of 18F-AraG PET to assess the location and function of CD8+ cells, as well as immune activity within tumors, after immune priming therapy warrants further investigation into its utility for patient selection, evaluation of optimal time to deliver immunotherapies, and assessment of combinatorial therapies.
DISCLOSURE
This work was supported by National Institutes of Health grant NCI SBIR HHSN261201800024C (Jelena Levi). Jelena Levi, Samuel Goth, Lyna Huynh, Tina Lam, and Juliet A. Packiasamy are or were employed by CellSight Technologies. CellSight Technologies Inc. is commercializing 18F-AraG as a PET tracer for evaluation of immune response in immunotherapy. No other potential conflict of interest relevant to this article was reported.
KEY POINTS
QUESTION: Can 18F-AraG PET be used to profile the CD8 status of tumors and evaluate immunomodulation caused by chemotherapy?
PERTINENT FINDINGS: In a panel of syngeneic tumor models, a statistically significant correlation was found between the intratumoral 18F-AraG signal and the number of CD8+ PD-1+ cells. In addition, a statistically significant increase in signal after immune-priming oxaliplatin/cyclophosphamide treatment was observed in MC38 and A9F1 models.
IMPLICATIONS FOR PATIENT CARE: The ability of 18F-AraG PET to assess the location and function of CD8+ cells, as well as immune activity within tumors after immune priming therapy, may prove useful in patient selection, evaluation of optimal time to deliver immunotherapies, and assessment of combinatorial therapies.
Footnotes
Published online Nov. 6, 2020.
- © 2021 by the Society of Nuclear Medicine and Molecular Imaging.
REFERENCES
- Received for publication May 6, 2020.
- Accepted for publication August 2, 2020.


Jump to section
Related Articles
Cited By...
- Approaches to Imaging Immune Activation Using PET
- [18F]F-AraG Uptake in Vertebral Bone Marrow May Predict Survival in Patients with Non-Small Cell Lung Cancer Treated with Anti-PD-(L)1 Immunotherapy
- Total-Body Dynamic Imaging and Kinetic Modeling of [18F]F-AraG in Healthy Individuals and a Non-Small Cell Lung Cancer Patient Undergoing Anti-PD-1 Immunotherapy
- Total-body Dynamic Imaging and Kinetic Modeling of 18F-AraG in Healthy Individuals and a Non-Small Cell Lung Cancer Patient Undergoing Anti-PD-1 Immunotherapy
- Imaging of Activated T Cells
- Longitudinal Imaging of T Cells and Inflammatory Demyelination in a Preclinical Model of Multiple Sclerosis Using 18F-FAraG PET and MRI