


Abstract
This review explores the role of PET in imaging immune activation, particularly in oncology. 18F-FDG is widely used for assessing treatment response to immunotherapies and can demonstrate unique response patterns as well as immune-related adverse events. However, because of the limited specificity of 18F-FDG, newer PET radiopharmaceuticals targeting specific cellular or subcellular components of the immune system have been developed that can provide more precise information. The development of immune-specific PET radiopharmaceuticals offers significant potential for improving immune monitoring in both clinical practice and research.
The immune system plays a key role in both oncologic and nononcologic diseases, with insufficient function promoting cancer and overactivity, leading to autoimmune disorders (1). Advances in treatments targeting the immune systems, especially immune checkpoint inhibitors, have revolutionized cancer treatment and improved outcomes for select patients (2). Alongside these therapies, imaging has become critical for assessing the state of the immune system and its activation, including for initial evaluation, treatment planning, and response monitoring (3–7).
PET, as a noninvasive imaging modality, has proven to be valuable for longitudinal assessment of immune activity, leveraging a variety of radiopharmaceuticals to visualize metabolic changes as well as specific molecular targets associated with immune cells (4,5). The most widely used PET radiopharmaceutical, 18F-FDG, is the mainstay of clinical imaging of immune activation due to its ability to detect increased glucose metabolism in the activated immune cells in the local tissue microenvironment. As the nearly ubiquitous radiopharmaceutical in oncologic PET imaging, 18F-FDG has been increasingly used in patients receiving immune-targeting treatments for which it is used to image the tumor microenvironment (TME), track responses to immunotherapy, and monitor for the relatively unique immune-related adverse events (irAEs) (8,9). Additionally, 18F-FDG PET/CT has a proven utility in imaging infections and autoimmune diseases, for which local or systemic immune-cell activation and proliferation are central to the pathogenesis (10–12).
However, 18F-FDG PET has certain inherent limitations, including a lack of specificity. As increased glycolytic activity is common in both malignancies and virtually every acute infectious or inflammatory process, isolating the signal from immune activation can be a challenging and often impossible task on a single–time-point 18F-FDG PET/CT. This has prompted interest in developing alternative PET tracers that target specific components of the immune system, including cellular and subcellular molecular targets. These emerging radiopharmaceuticals hold promise for providing more detailed insights into immune activation and its spatial distribution, particularly in the setting of cancer immunotherapy. This review focuses on the current state and future directions of PET imaging for immune activation in oncology.
18F-FDG PET/CT IN IMMUNE ACTIVATION
Mechanism of 18F-FDG Uptake
18F-FDG has been widely used in PET/CT imaging as a marker of glucose metabolism. 18F-FDG takes advantage of the Warburg effect, in which cells undergoing rapid proliferation (or activation in case of immune cells) switch to anaerobic glycolysis, even in the presence of oxygen, leading to increased glucose uptake and metabolism (13). On activation, macrophages and T-cells upregulate glucose transporters (mainly GLUT1) on their cell surfaces to meet their increased energy demands. This allows 18F-FDG to enter the cells via GLUT1, where it undergoes phosphorylation by hexokinase to 18F-FDG-6-phosphate, which cannot be further metabolized and remains trapped intracellularly. Consequently, 18F-FDG accumulates in cells, making areas of cellular proliferation or activation visible on PET imaging (Fig. 1). Activated macrophages and T-cells (both cytotoxic and helper subtypes) are particularly prominent in the TME, contributing to the inflammatory response to tumors and exhibit increased glucose metabolism when engaged in immune responses, such as those mounted against cancer cells or infections (14).

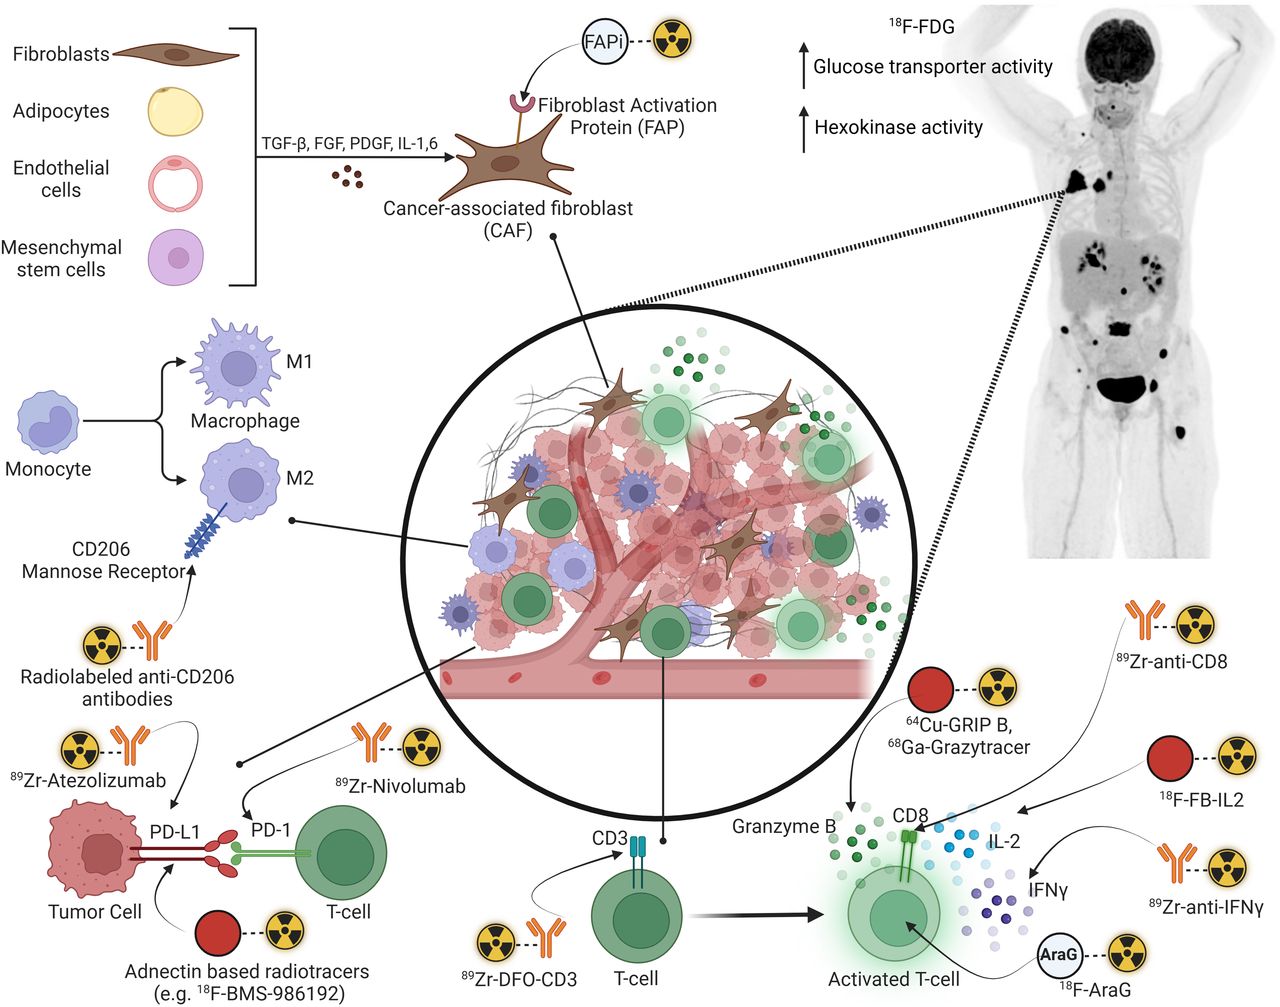
Overview of PET-based imaging approaches to TME. FAPI = fibroblast activation protein inhibitor; FGF = fibroblast growth factor; PDGF = platelet-derived growth factor; TGF-β = transforming growth factor β.
Applications in Oncology
The role of immune activation in oncology is pivotal, with the immune system being both a natural barrier to cancer progression and a therapeutic target. 18F-FDG PET/CT has become an essential tool in visualizing immune responses within the TME and tracking the effects of immune-targeting therapies.
Assessment of Treatment Response
18F-FDG PET/CT is commonly used for staging and assessment of treatment response in several malignancies (9). Response assessment criteria such as the Lugano criteria for lymphomas and adaptations of PERCIST for solid tumors are used for interpretation in the setting of conventional therapies such as cytotoxic chemotherapies and radiation therapy (15–19). However, there are challenges to assessing response to immunotherapies as they may be associated with certain unique response patterns due to the underlying mechanisms of action of the therapeutic agent (4). Other than the standard response patterns seen with conventional therapies, immunotherapies have additional imaging patterns such as pseudoprogression and hyperprogression.
Pseudoprogression refers to the apparent impression of progressive disease by increasing size or metabolic activity of preexisting lesions or the appearance of new lesions with otherwise clinical improvement. However, when these patients are followed up without a change in therapy, subsequent imaging, typically obtained 6–8 wk after therapy, shows overall regression of the disease (Fig. 2). This pattern is relatively more common with cytotoxic T-lymphocyte–associated antigen 4 inhibitors, such as ipilimumab, compared with the anti–programmed death protein 1 (PD-1) and its ligand, programmed death ligand 1 (PD-L1) inhibitors, and is seen more often with combination immunotherapies than with single-agent immunotherapy (20). The underlying mechanism of this imaging pattern is postulated to reflect the increased infiltration and activation of immune cells in the TME, promoting cytokine release and local edema, which manifests as an increase in the size of the lesions on imaging. Further, the increased and activated immune-cell population leads to an overall increase in the glucose metabolism in the TME, manifesting as increasing SUVs on an 18F-FDG PET/CT image. Even previously undetectable sites of disease may now be apparent because of this increased immune-cell infiltration and activation (9,21). Over time, these activated immune cells exert their cytocidal effects, leading to an overall reduction in the size and metabolic activity of the tumors, which can then be captured on a follow-up 18F-FDG PET/CT. It is therefore important to not directly attribute such imaging appearances to progressive disease and remain cognizant of pseudoprogression, which should be further confirmed or excluded on a follow-up 18F-FDG PET/CT scan. In contrast, the prevalence of pseudoprogression is typically around 10%, which implies that most progressive disease patterns seen on imaging still represent a true progressive disease, especially with clinical decline (2,22–24).

63-y-old woman with urethral melanoma being treated with pembrolizumab developed metastatic right pulmonary nodule (black arrow), and her treatment was changed to combination ipilimumab (Ipi) and nivolumab (Nivo). Her follow-up 18F-FDG PET/CT at 2.5 mo showed new lymphadenopathy involving bilateral axillary, retroperitoneal, iliac and inguinal stations (red arrows), new 18F-FDG uptake in endometrium (blue arrow) in addition to enlarging pulmonary nodule (black arrow). There was also increased 18F-FDG uptake in spleen and bilateral renal cortices (brown arrows). Taken together, these findings were suggestive of immunoreactive process contributing to pseudoprogressive pattern, with immunotherapy-related nephritis and likely endometrial inflammation. Patient continued treatment, and pseudoprogression was confirmed on follow-up 18F-FDG PET/CT obtained 6 wk later and ongoing complete response 18 mo later.
Hyperprogression represents a markedly rapid and fulminant disease progression with clinical worsening in patients being treated with immune-targeted therapies (Fig. 3) (25). Although there are varying definitions of hyperprogression, the common elements include the rate and degree of tumor growth. The pathogenesis of hyperprogression is incompletely understood, but proposed mechanisms include the modulation of TME with activation of the regulatory T-cells and macrophage subtypes to promote a locally immunosuppressed environment (26,27). Identification of hyperprogression is important, as these patients need to be switched to alternative treatments with cessation of immunotherapy. Hyperprogression has also been associated with poor overall survival, worse than that seen with conventional progressive disease (28). The incidence of hyperprogression has varied across studies, mainly due to nonuniform definitions, and a metaanalysis reported an incidence ranging from 5.9% to 43.1% across 24 studies with 3,109 patients (25).
Despite these atypical response patterns with immunotherapy, response assessment using 18F-FDG PET/CT continues to be a robust predictor of patient outcomes, and multiple response criteria have been proposed to tackle these challenges (Table 1) (6,29). PET-derived quantitative parameters such as metabolic tumor volume, total lesion glycolysis, and SUV ratios, measured at baseline and follow-up, have been associated with overall survival of patients with metastatic melanoma receiving immunotherapy (6,29). 18F-FDG PET/CT has also been applied for response assessment with immunotherapy in a neoadjuvant setting, and although the literature is currently immature, the results seem promising (30,31). The use of 18F-FDG PET/CT at baseline, during therapy (interim assessment), and at the end of therapy is also recommended by the joint European Association of Nuclear Medicine/Society of Nuclear Medicine and Molecular Imaging/Australian and New Zealand Society of Nuclear Medicine procedure standards (32–34). These guidelines also recommend extraction of volumetric parameters as previously described, which can aid in the assessment of response and have important prognostic value.

71-y-old woman with previously excised left lower extremity melanoma developed hepatic metastases (red arrow), left inguinal lymph nodes (black arrow), and subcutaneous deposits. Around 3 wk later, with 1 cycle of relatlimab and nivolumab therapy completed, patient worsened clinically, with abdominal pain and distention, increased fatigue, and dyspnea. Follow-up 18F-FDG PET/CT showed marked increase in hepatic disease burden (red bracket). Hyperprogression was suggested, and immunotherapy was discontinued. Patient declined additional therapy and unfortunately died approximately 10 mo later. During 4-wk period between 2 18F-FDG PET/CT studies, her hepatic metabolic tumor volume had 5-fold increase (baseline, 466 cm3; follow-up, 2,703 cm3). Note also reduced FDG uptake in brain (brown arrow), likely secondary to tumor sink-effect.
18F-FDG PET–Based Modified Response Assessment Criteria for Patients Receiving Immunotherapy
irAEs
Immune-targeting therapies are associated with certain adverse effects, termed irAEs, several of which produce characteristic imaging patterns on 18F-FDG PET/CT (Table 2) (35–37). Recognition of these irAEs is useful as they may impact management, including additional treatment with corticosteroids, and temporary or even permanent cessation of immunotherapy based on the severity of the effect. Occasionally, irAEs may manifest at a subclinical stage on 18F-FDG PET/CT, preceding any clinical signs or symptoms. Thus, familiarity with the imaging manifestations is important, so that these findings can be communicated promptly and appropriate management instituted to potentially reduce the severity or prevent the occurrence of the clinically manifest event (Figs. 2 and 4).

Key manifestations of irAEs on 18F-FDG PET/CT. (A) Immune-related thyroiditis in patient with metastatic melanoma treated with immune checkpoint inhibitors (ICIs) presenting as diffuse increased 18F-FDG uptake in thyroid with resolution 3 mo later. (B) Immune-related sarcoidlike reaction in patient with metastatic melanoma treated with ICIs, presenting with new and worsening 18F-FDG–avid symmetric mediastinal and bilateral hilar lymphadenopathy with resolution of known disease sites, and spontaneous resolution on follow-up 18F-FDG PET/CT 5 mo later. (C) Immune-related colitis in patient with metastatic melanoma treated with ICIs presenting with new diffuse increased 18F-FDG uptake in colon and multiple episodes of diarrhea, with spontaneous resolution 2 mo later. (D) Immune-related hypophysitis in patient with metastatic melanoma presenting as diffuse increased 18F-FDG uptake in the sella, correlating with new enlargement of pituitary on MRI and resolution after treatment with prednisone. (E) Immune-related pneumonitis in patient with metastatic melanoma presenting as diffuse increased 18F-FDG uptake throughout both lungs, necessitating cessation of ICI and initiation of steroids, which led to resolution 5 mo later. (F) Immute-related cholangitis presenting as new, increased 18F-FDG uptake along bile ducts that appear dilated and thickened on MRI in patient treated with ICIs. (G) Immune-related arthritis: 2 examples of hip and knee arthritis, with new diffuse increased 18F-FDG uptake at hip (left panel) and knee (right panel) joints after initiation of ICIs and correlating with new and increasing pain at these sites. Ipi = ipilimumab; Nivo = nivolumab.
Limitations of 18F-FDG for Imaging of Immune Activation
Although 18F-FDG PET has broad applications in imaging immune activation, it is limited by a lack of specificity as the antitumorigenic effector T-cells and the immunosuppressive regulatory T-cells and M2 macrophages share the common glucose metabolic pathway as the tumor cells. This has led to the development of alternative PET tracers that target more specific aspects of immune activation, offering a more detailed view of the immune landscape, with some currently being explored in research settings (Fig. 1; Table 3).
Key Radiopharmaceuticals for Targeted PET Imaging of Immune System
ALTERNATIVE RADIOPHARMACEUTICALS FOR PET IMAGING OF IMMUNE ACTIVATION
Overview of the TME
The TME consists of a complex network of cells and extracellular components that form the immediate local environment surrounding the tumor cells. TME plays a crucial role in cancer progression, metastasis, and in modulation of the immune response to tumors. Understanding and imaging the TME has become increasingly important for the success of immunotherapy, as the interaction between immune cells and tumor cells within the TME can dictate treatment outcomes (Fig. 1).
The TME contains various immune-cell populations, including T-cells, natural killer cells, dendritic cells, and tumor-associated macrophages (38). Tumor-associated macrophages can either support immune responses or promote immunosuppression depending on their polarization (antitumorigenic M1 vs. protumorigenic M2 macrophages) (39). Tumor-infiltrating lymphocytes, including CD8+ cytotoxic T-cells, are often crucial for an effective antitumor immune response. TMEs with a broad population of immune cells that lack cytotoxic T-cells are termed infiltrate-excluded. These TMEs have cytotoxic T-cells restricted to the margins of the tumor that cannot mount an antitumor immune response (38). In tumors such as colorectal cancer, pancreatic adenocarcinoma, and melanoma, the tumor-associated macrophages prevent the infiltration of cytotoxic T-cells in the TME, leading to a poorly immunogenic environment (40–42). Conversely, the infiltrate-inflamed TMEs are enriched with the cytotoxic T-cells and have a strong antitumor immune response once the immune checkpoint blockade is relieved (using anti–PD-1/PD-L1 checkpoint inhibitors) (38).
Fibroblasts and endothelial cells in the TME are also important components of the tumor stroma. Cancer-associated fibroblasts contribute to immune evasion and create a fibrotic barrier, seen as the desmoplastic reaction on imaging, that hampers immune-cell infiltration (43). Cancer-associated fibroblasts can originate from various sources such as resident fibroblasts, mesenchymal stem cells, or epithelial cells undergoing epithelial-to-mesenchymal transition and remodeling the extracellular matrix, facilitating a protumorigenic environment for tumor growth and invasion (43). Cancer-associated fibroblasts have several secretory products, including growth factors such as transforming growth factor-β, vascular endothelial growth factor, chemokines such as CXCL12, and cytokines such as interleukin (IL)-6, further promoting tumor proliferation, neoangiogenesis, and distant spread (44).
In addition to these constituents of the TME, other factors contribute to tumor growth and affect response to treatments, such as regional oxygenation, hypoxia-inducible factors, and alterations in the metabolic pathways of nutrients such as glucose and lipids (45).
Approaches to Targeting Specific Immune Cells
Immune Cells
T-lymphocytes, a central component of the adaptive immune response, play a crucial role in recognizing and attacking pathogens, tumors, and other abnormal cells and are a key effector in the cellular antitumor response. Given their significance, developing specific radiopharmaceuticals to track their activation, migration, and proliferation noninvasively can provide valuable insights for predicting response to therapy and longitudinal tracking of spatial changes in the T-cell population (46).
The approaches to image T-cells include radiolabeled antibodies, antibody fragments, and other small molecules designed to bind specifically to surface markers or subcellular components of T-cells (47,48). As a T-cell surface marker, CD3 is a global imaging marker for the total T-cell population. Thus, noninvasive anti-CD3–targeted imaging can partly segregate the T-cells enriched (irrespective of the type) from T-cell–poor TMEs. CD3-targeting PET imaging using 89Zr-DFO-CD3 has been used in models of colon cancer to predict response to anticytotoxic T-lymphocyte–associated antigen 4 immunotherapy noninvasively (49). A limitation of this approach is that pan-T-cell markers such as CD3 do not provide adequate information about the cellular subtypes and their functional status within the TME. For example, regulatory T-cells are involved in immune-modulatory pathways that promote cytotoxic T-cell exhaustion, promoting a protumorigenic environment. This information cannot be reliably captured with imaging of surface markers such as CD3, in the absence of more specific markers of the T-cell subtype (50). Antibody or antibody fragment–based targeting of the CD8 receptor (e.g., with 89Zr-Df-IAB22M2C) can help in the visualization of CD8+ T-cell infiltration in the TME, thus informing on the downstream response to immunotherapy (51). The main drawbacks of this imaging technique include the ubiquitous presence CD8+ T-cells in lymphoid tissues and the inability to differentiate activated from exhausted T-cells.
Immune Cell Function
As T-cells are distributed throughout the body, imaging techniques have been developed to capture intracellular signaling molecules that indicate T-cell activation. Granzyme B, a serine protease released by activated CD8+ T-cells and natural killer cells, is a potent driver of apoptosis, and its imaging has been evaluated in preclinical and clinical models (48,52). Granzyme B PET imaging allows for the early detection of T-cell activation and has shown potential in predicting antitumor responses to immune checkpoint inhibitor therapies (53). Preliminary clinical data show that 68Ga-grazytracer PET/CT (targeting Granzyme B) shortly after initiating immune checkpoint inhibitor therapy can predict response to treatment. Patients with a positive 68Ga-grazytracer PET/CT showed a more favorable response to therapy compared with those with a negative scan (53). In addition, a preclinical study demonstrated that Granzyme B–targeted PET imaging could noninvasively detect irAEs, potentially improving the diagnosis and management of these toxicities (54). Another study using 68Ga-NOTA-GZP PET/CT for imaging of Granzyme B in mice models of inflammatory bowel disease showed that the tracer activity was high in animals with active inflammation versus those without and declined over time in responders after administration of tumor necrosis α inhibitor (55). Another approach to imaging activated T-cells is using 2′-deoxy-2′-[18F]fluoro-9-β-d-arabinofuranosyl guanine (18F-AraG), a radioactive analog of arabinosyl guanine, which is a substrate for deoxynucleotide kinases and thus accumulates preferentially in activated T-cells (56). The nucleoside salvage pathways, mediated by deoxycytidine and deoxyguanosine kinases, are crucial for replenishing the nucleotides in activated and proliferating T-cells, and thus, AraG is preferentially taken up by these cells (57). 18F-AraG has been shown to delineate activated CD8+ T-cells in animal tumor models after initiating immune-priming chemotherapies (57). Clinical trials are under way to further study the changes in the biodistribution of 18F-AraG before and after initiation of treatment in patients with various malignancies with the broad goal of predicting treatment outcomes (NCT04678440, NCT03142204).
Interferon-γ (IFN-γ) and IL-2 are cytokines released by several T-cell subtypes. IL-2, a cytokine central to T-cell proliferation and activation, has been a target of interest for imaging because it reflects the activity of activated T-cells (58). The binding of IL-2 to its receptor leads to the activation and differentiation of T-cells; thus, imaging this axis is of clinical relevance (58). Radiolabeled IL-2, such as 18F-FB-IL2, has been investigated for tracking T-cell activation in vivo, especially in cancer immunotherapy (59). Although imaging was safe and feasible, serial 18F-FB-IL2 PET/CT in a small set of patients with metastatic melanoma did not predict response to immune checkpoint inhibitor therapy (59). Similarly, IFN-γ, a key cytokine secreted by activated T-cells (type 1 T-helper cells and cytotoxic T-cells) and natural killer cells, plays a crucial role in antitumor immunity and host defense against infections (60). 89Zr-anti-IFN-γ PET in mice models has been shown to characterize the status of T-cells in the TME, with increased tracer accumulation correlating with a strong antitumor immune response and, conversely, a low tracer activity correlating with a dysfunctional and exhausted T-cell population with increased expression of PD-1 on the tumor cells (50).
PET imaging of cancer-associated fibroblasts using radiolabeled fibroblast activation protein inhibitors has shown clinical promise in various oncologic and nononcologic inflammatory diseases (61). Similarly, PET imaging of tumor-associated macrophages by targeting CD206, a mannose receptor expressed on the immunosuppressive M2-like macrophages, can predict response to immunotherapy, with a high PET signal indicating a poor outcome (62).
Immune Checkpoints as Targets
Immune checkpoint proteins, such as PD-1, PD-L1, and cytotoxic T-lymphocyte–associated antigen 4, are intricately involved in maintaining an immunosuppressive, protumorigenic TME. Therapeutic inhibition of these proteins using immune checkpoint inhibitors has led to significant improvements in clinical outcomes of patients with several different malignancies, and thus, noninvasive imaging of these targets has been of clinical interest (5,7). PD-1 is expressed most prominently on the surface of activated T-cells and to a lesser extent in other immune cells, such as natural killer cells, macrophages, and dendritic cells. PD-L1 is also expressed on the surface of immune cells but is also expressed by tumor cells as a mechanism of evading immune surveillance. In vivo characterization of the PD-1/PD-L1 axis can help assess the heterogeneity of expression of these proteins in the TME, both spatially and temporally (using serial imaging obtained longitudinally), information that is vital for therapeutic efficacy and cannot be captured reliably using immunohistochemistry. The PD-1/PD-L1 axis can be visualized noninvasively using radiolabeled antibodies or small molecules (63,64). Preclinical and preliminary clinical data suggest that whole-body quantification of PD-1 and PD-L1 is feasible using an adnectin-based radiopharmaceutical (18F-BMS-986192) and a radiolabeled antibody (89Zr-nivolumab), respectively (63). In vivo assessment of PD-L1 status in patients with breast, bladder, or lung malignancies using 89Zr-Atezolizumab showed an overall heterogeneity in tracer activity across the tumor types as well as within the same lesions in several patients (65). This study also showed a positive correlation between favorable treatment response to atezolizumab therapy and the increasing intensity of tracer uptake across the lesions, although in a relatively small group of patients (n = 22). A challenge with PD-1/PD-L1 imaging–based prediction of response to immune checkpoint inhibitor therapy is the expression of these proteins on other immune cells, including the immunosuppressive regulatory T-cells, which limits the selective characterization of effector T-cells (5). Moreover, as with the assessment of T-cell markers, PD-L1 expression is seen in many nontumor tissues such as the spleen, making its use in patient selection for PD-1/PD-L1 targeting therapeutic agents difficult.
Reporter Gene and Chimeric Antigen Receptor (CAR) T-Cell Imaging
A reporter gene is an artificially introduced sequence of nucleic acids used to detect or “report” the functionality or expression of the gene of interest. This information is valuable in elucidating the mechanisms, tracking the temporal changes, and predicting the success of gene therapies (66–69). These reporter genes may be selected on the basis of their ability to express a target that can be visualized on PET imaging using a specific radiopharmaceutical (67). Ideally, this target should not be expressed in the native host or expressed only at limited, well-defined sites so that its detection by imaging of the gene of interest is unequivocal and unambiguous. These reporter systems should also be nontoxic and without any significant downstream physiologic activity other than expression of the detectable target (68).
Traditional imaging reporter gene systems express targets belonging to 1 of these 3 categories: enzymes, receptors, or transporters (68). The most widely used enzyme-expressing reporter gene is the Herpes simplex virus 1–thymidine kinase system. This reporter gene expresses the enzyme thymidine kinase, which can be imaged using different PET-based probes, including 9-(4-[18F]fluoro-3-hydroxymethylbutyl)guanine (70). Reporter genes expressing receptors, such as somatostatin receptor or prostate-specific membrane antigen, can be imaged using established PET radiopharmaceuticals such as 68Ga/64Cu-DOTATATE and 68Ga-PSMA-11 or 18F-DCFPyL, respectively (71,72). A reporter gene expressing a transporter includes the well-characterized sodium iodide symporter, which can be imaged with the PET probe, 124I-sodium iodide (73).
CAR T-cells are modified T-cells with a chimeric extracellular antibody construct specific to a tumor antigen that, on binding to the target, initiates T-cell activation. Despite the success of CAR T-cell therapy in various hematologic malignancies, relapses are frequent and partly related to a lack of CAR T-cell persistence or immune-cell exhaustion (74). Thus, noninvasive in vivo imaging that can localize and monitor CAR T-cell activity longitudinally is valuable for predicting treatment response. CAR T-cells can be tracked using the previously described reporter genes by adding a reporter gene construct with the chimeric T-cell receptor (75,76). A recent study evaluated the feasibility of antigen-based PET imaging of the CAR T-cells using the ectodomain of CD19, a common B-cell marker and target for several CAR T-cells (74). The purported benefits of antigen-based imaging, compared with reporter gene imaging, are the low immunogenic potential of the technique, no requirement of alterations in the CAR T-cell model, and the feasibility of real-time imaging at multiple time points. Although still early in development, these imaging technologies are promising candidates for future clinical translation.
CONCLUSION
PET/CT is a critical tool for noninvasive imaging of immune activation, particularly in assessing immune responses in cancer. Although 18F-FDG remains the mainstay of response monitoring, its lack of specificity complicates distinguishing immune activity from other processes. Emerging radiopharmaceuticals targeting specific immune components offer more precise evaluation, especially in the setting of cancer immunotherapy. As these tracers and PET-derived metrics evolve, they may improve patient outcome prediction and treatment planning. With advancements in PET/CT systems, including whole-body PET scanners, PET/CT imaging will continue to evolve as a vital component in both clinical practice and research, aiding in the tailored management of immune-targeted therapies.
ACKNOWLEDGMENT
Figures 1 and 4 were created using BioRender.com.
Footnotes
Learning Objectives: On successful completion of this activity, participants should be able to (1) understand the fundamental principles and inner workings of large language models and large multimodal models; (2) identify various applications of large language models and large multimodal models in healthcare; and (3) recognize the potential pitfalls and challenges associated with the use of large language models, such as confabulation and bias, and discuss strategies to enhance model accuracy and reliability.
Financial Disclosure: Dr. Parihar is supported by the SNMMI Radiopharmaceutical Therapy Research Fellowship and has received financial support from Telix Pharmaceuticals. Dr. Heidari serves as an advisor to Telix Pharmaceuticals and Novartis, has research funding support from Siemens Healthineers and CytoSite Biopharma, and acknowledges federal grant support (K08CA249047). Dr. Fong is a consultant for Abbvie, Innovent, Dendreon, and Roche/Genentech and has received research grants from Abbvie, Merck, and Roche/Genentech. Dr. Iravani has served as an advisor for Novartis, Curium, Lantheus, and Bayer and a consultant for Ambrx through the institution. The authors of this article have indicated no other relevant relationships that could be perceived as a real or apparent conflict of interest.
CE Credit: SNMMI is accredited by the Accreditation Council for Continuing Medical Education (ACCME), the Accreditation Council for Pharmacy Education (ACPE), and the American Registry for Radiologic Technologists (ARRT) and Nuclear Medicine Technology Certification Board (NMTCB) to sponsor continuing education for physicians, pharmacists, and nuclear medicine technologists. You may make 3 attempts to pass the test and must answer 80% of the questions correctly to receive credit—number of credits awarded will be determined by the length of the article. Participants can access this activity through the SNMMI website (http://www.snmmilearningcenter.org) through June 2028. Additional details such as the number of credits issued per article, expiration dates, financial disclosure information, and the process to earn CE credit can also be found in the SNMMI Learning Center.
Published online Apr. 30, 2025.
- © 2025 by the Society of Nuclear Medicine and Molecular Imaging.
REFERENCES
- Received for publication January 1, 2025.
- Accepted for publication March 31, 2025.
In this issue


Jump to section
Related Articles
Cited By...
- No citing articles found.