


Abstract
In this study, we investigated the diagnostic performance of whole-body 18F-FDG imaging using a PET/MRI scanner with time-of-flight capability for low-dose clinical imaging of pediatric patients. In addition to clinically acquired image data using a dosing regimen of 3.7 MBq/kg, images from simulated low-dose regimens (1.9–0.41 MBq/kg) were evaluated using several metrics: SUV quantitation, qualitative image quality, and lesion detectability. Methods: Low-dose images were generated by truncating the list-mode PET data to reduce the count statistics. Changes in PET quantitation for low-dose images were assessed using volume-of-interest analysis of healthy tissue and suspected lesions. Three pediatric radiologists reviewed the image volumes without knowing the dose level. Qualitative image quality was assessed on the basis of Likert scoring. Radiologists were also asked to identify suspected lesions within the liver for PET-only and PET/MR images. Lesion detectability was measured using a receiver-operating-characteristic study and quantified using a free-response receiving-operating-characteristic (FROC) methodology to assess changes in performance for low-dose images. Results: Our analysis of volume-of-interest quantitation showed that SUVs remain stable down to ⅓ dose (1.2 MBq/kg). Likert scoring of PET/MR images showed no noticeable trend with dose level; however, scores of PET-only images were lower for low-dose scans, with a 12% reduction for ⅓-dose images compared with full-dose images. There was minimal change in total lesion count for different dose levels; however, all 3 readers had an increase in false-negatives for ⅓-dose images compared with full-dose images. Using the FROC methodology to quantify lesion-detection performance for human observers, no significant differences were observed for the 3 dosing levels when using the averaged reader data (all P values > 0.103). For all readers, the FROC performance was higher for PET/MRI than for PET alone. Conclusion: Reductions to the lowest recommended pediatric dosing regimens are possible when using PET/MRI. The data suggest that the administered dose can be decreased to 2.46 MBq/kg, a 33% reduction in PET activity, with no degradation in image quality, leading to a corresponding reduction in absorbed dose.
Investigation into the optimal radiotracer activity is critical to pediatric nuclear medicine because children have a higher sensitivity to developing radiation-induced malignancies (1–4). A major challenge to radiotracer dosing in pediatrics is the large variation in patient size—spanning an age range from newborn to more than 18 y old—which impacts dosimetry calculations and techniques to measure image quality (5–10). Several studies have evaluated how the radiotracer dose regimen affects pediatric image quality, and specifically for 18F-FDG, optimized regimens of 2.0–5.3 MBq/kg (3 min/bed position) have been reported (11–13). On the basis of the available data, major pediatric imaging societies from North America, Europe, and Japan have provided recommended dosing guidelines (14–16), and for 18F-FDG, these values are approximately 3.5–5.3 MBq/kg. The resulting disparities in radiotracer dosing regimen cause the absorbed dose to vary by as much as 51%, assuming a linear relationship between injected activity and absorbed dose (17). A significant challenge to creating universal low-dose imaging protocols is the large difference in performance among PET instruments (18); relevant parameters include photon sensitivity, time-of-flight (TOF) capability, and techniques to reconstruct and process images. Imaging data used in this work were acquired with a linear dosing regimen of 3.7 MBq/kg (0.1 mCi/kg) and were evaluated down to 0.041 MBq/kg (0.011 mCi/kg), similar to reductions evaluated in adult populations (19,20). Our goal was to determine the lowest dose that will maintain high diagnostic performance using a state-of-the-art low-dose instrument (PET/MRI), therefore serving as a reference to pediatric PET studies and to future investigations into dose reduction techniques—both instrument design and image processing.
The Children’s Hospital of Philadelphia installed a PET/MRI scanner (Signa; GE Healthcare) in July 2015. To our knowledge, this scanner was the first to be installed for clinical use in a freestanding pediatric hospital, and we have now completed more than 400 18F-FDG clinical studies. This scanner has a photon sensitivity of 2.3% (23.3 cps/kBq), according to the National Electrical Manufacturers Association measurement protocol (21), and this sensitivity is 1.6 times higher than that for a similar commercial PET/MRI system (mMR; Siemens) (22). In addition, the Signa uses TOF-capable PET detectors with a reported timing resolution of 385 ps (23), further reducing image noise compared with a conventional non-TOF instrument. The combination of high photon-sensitivity and TOF should allow for good image quality at very low count levels. As a result, significant reductions in scan time or injected activity should be possible (20). In PET/MRI, the scan time (time per bed position) is often dictated by the choice of MRI sequences, and therefore, in our study, reducing PET counts will be evaluated as a reduction in injected activity. If fewer MRI sequences are acquired or the MRI acquisition time is reduced, trade-offs in scan time with dose can be made. At Children’s Hospital of Philadelphia, whole-body PET/MRI protocols for oncology use the same set of MRI sequences for all bed positions; if additional sequences are required in a localized region, a second acquisition is made after the whole-body scan.
Defining and evaluating image quality is a difficult task in general. For pediatric 18F-FDG imaging, the rarity and diversity of tumors, large variation in patient size, and imaging task further complicate comprehensive image-quality studies. Pediatric PET image quality at low doses (low count levels) has been assessed primarily using qualitative metrics, such as adequacy scoring of various image features, lesion counting, and the PET noise-equivalent counting rate, which is supportive of dose reduction without degraded performance but ultimately subjective. Approaches to studying low-dose image quality using quantitative numeric observers have been described (24); however, these image metrics use fixed-source distributions or are designed for a specific imaging task and, for reasons previously discussed, are therefore difficult to interpret in the varying context of clinical pediatric imaging.
For a more comprehensive approach to the complex task of evaluating low-dose image protocols, we chose to use a combination of human observer studies to assess lesion-detection performance and to evaluate quantitative accuracy. We analyzed the human observer performance using a free-response receiver-operating-characteristic (FROC) methodology, quantified by calculating a jackknife-alternative FROC (JAFROC) figure-of-merit accounting for a protocol involving multiple readers and multiple cases (25), providing a thorough description of diagnostic performance. Our studies are based on clinical imaging data from pediatric patients, therefore directly including the clinically observed variability in lesion size and contrast, as well as the age-dependent pharmacokinetics of 18F-FDG (26). After a review of all oncologic patients imaged with 18F-FDG PET, scans with liver lesions were selected. The detection task measured in this study was identification of 18F-FDG–avid lesions in the liver. We chose to study images of liver lesions because of the organ’s high background uptake and uniform uptake pattern, which results in lower contrast and provides similar detectability for lesions at various positions throughout the liver. PET/MRI data are also included in our studies, and we compare the multimodality performance against PET imaging alone (without fusion). Our hypothesis was that significant reductions in the radiotracer dosing regimen could be achieved with no impact on diagnostic image-quality metrics when using a PET/MRI scanner.
MATERIALS AND METHODS
Patient Population Characteristics
The institutional review board at Children’s Hospital of Philadelphia approved this retrospective study, and the requirement to obtain informed consent was waived. Because patients with metastatic liver lesions were used—an uncommon finding in pediatrics—diseases vary. The diseases included rhabdomyosarcoma (n = 2), gastrointestinal stromal tumor (n = 2), lymphoma (n = 4), and medulloblastoma (n = 1), as well as 2 patients with Li-Fraumeni syndrome who were scanned as part of follow-up to previous treatment. Patient information and lesion characteristics are summarized in Table 1. No patients had lesions at the dome of the liver. One patient was imaged twice, roughly 5 mo apart, and the second scan was included in the study as an independent scan; in total there were 11 patients and 12 scans. In addition, 3 patient scans with no liver lesions were also included in the study as a control group for detection studies.
Patient Information
Description of PET/MRI Scanner and Imaging Protocol
Details and performance measurements of the Signa PET/MRI scanner have been previously reported (21). Specific details relevant to the study include the axial field of view of 25 cm; National Electrical Manufacturers Association line-source sensitivity of 2.3%; spatial resolution of 4.1, 4.4, and 5.3 mm (radial, tangential, axial); and coincidence timing resolution of 385 ps. All PET data were collected in list mode. The whole-body clinical protocol at Children’s Hospital of Philadelphia uses a PET bed-position scan duration of 3 min and a bed-position overlap of 33%. Patients were instructed to fast 6 h before imaging. The average uptake time for all patients was approximately 70 min. A form of anesthesia was used for patients less than 8 y old. Patients were scanned from vertex to toes with a head-first scan direction. For whole-body MRI, an 8-channel head coil and the standard body coils were used. Two-point Dixon T1-weighted, coronal short–inversion-time inversion recovery, and diffusion-weighted sequences were acquired at each bed position. The MRI time was roughly 3–4 min per bed position; however, the PET acquisition was fixed at 3 min. Additional T2-weighted fast spin-echo fat-saturated images of the liver were obtained, but only data from the Dixon T1-weighted sequence—in-phase and water-only—were used for the analysis. The average total imaging time was 80 min (±22 min), which includes time for additional imaging after the whole-body scan.
PET Image Processing
All patient identifiers were removed to anonymize the data. The clinical PET reconstruction protocol was used for all images and generated dose levels. This reconstruction protocol uses a TOF ordered-subsets expectation-maximization algorithm with 4 iterations and 18 subsets and no point-spread-function modeling. Reconstructed images used a 256 × 256 image matrix and a 2-mm voxel size. The vendor-provided MRI-based attenuation correction was used, which applies an atlas-based method for the head, a segmentation-based attenuation correction method for the body (27,28), and standard scatter correction. Low-dose images were generated by reconstructing only a truncated portion of the PET list-mode data file. Five dosing levels were emulated and evaluated, from the clinical level down to one ninth of that level (3.7, 1.9, 1.2, 0.6, and 0.4 MBq/kg). In total, 69 image volumes were generated for the study; this number is derived from 12 lesion-present patient scans reconstructed at 5 count levels, as well as 3 no-lesion patient scans reconstructed at 3 count levels. All image volumes were included for quantitative SUV analysis, and 30 image volumes were used for image evaluation and lesion-detection studies.
Quantitative PET Analysis
The SUVs of the liver background and lesions within the liver were recorded using the vendor-provided Advantage Workstation software (GE Healthcare). The background liver uptake was calculated using the average of 8 volumes of interest (VOIs) 1.5 cm in diameter drawn over healthy liver tissue; the SD of the 8 measurements was recorded as well. These calculations were done for both SUVmax and SUVmean, defined as the maximum and average pixel values, respectively, within the VOI. The SUV of liver lesions was also recorded using the smallest VOI that covered the entire lesion volume. The lesion VOIs were originally drawn using the full-dose PET image fused with a T1-weighted MR image and then copied to all other generated low-dose PET images, so that VOI location and size were matched. The SUVmean of liver lesions was also included; however, at our institution, only SUVmax is used clinically. These measurements were repeated for each patient scan at the 5 dose levels.
Human Observer Studies
Three dosing levels were included in the human observer receiver-operating-characteristic studies: 3.7, 1.9, and 1.2 MBq/kg (full dose, ½ dose, and ⅓ dose, respectively). Five patient datasets were not included in the reader studies because of unique patient features, patients with lesions deemed likely detectable (high SUV, large diameter), and, for several patients, extensive liver disease that complicated the lesion-identification study design. Seven lesion-present scans were included in the reader study (with a total of 23 liver lesions to be identified), along with 3 no-lesion scans, for a total of 10 scans to be read at each session. Each reader completed 3 different sessions (average of 19 d between reads, minimum of 7 d), and in each session the 10 scans were presented and reviewed in random dose-level order with the reader masked to dose level. The ordering of subjects was changed between reading sessions, and only the abdomen was evaluated in an effort to reduce recall bias. Three American Board of Radiology–certified pediatric body radiologists were included in the study, each with a different experience level in PET and MRI: a senior radiologist with more than 10 y of PET experience, a radiologist with 8 y of PET experience, and a radiologist with 1 y of postfellowship experience reading PET scans.
Before each reading session, a training image set was loaded onto the clinically used workstation (Advantage Workstation; GE Healthcare) and interactively discussed with the reader. Images with randomized dosing level and randomized patient ordering were loaded onto the clinically used workstation, and the reader’s preferences for display settings were applied. Only attenuation-corrected PET images were reviewed. For each patient image set, initially only the PET image data were presented. Readers recorded a Likert score to characterize the image diagnostic quality and then recorded the slice location and SUVmax of suspected lesions found. After the entire liver was reviewed, the T1-weighted water-only MR images and PET/MR images were displayed. The readers were then asked to reevaluate the liver and were free to add or remove lesions or change confidence on certain lesions. A second Likert score was also recorded for the PET/MR images corresponding to the diagnostic quality and the quality of the image fusion. Likert scoring was based on a scale from 1 to 5, with 1 being nondiagnostic and 5 being highly diagnostic. A Light’s κ coefficient was used to characterize the agreement between reader Likert scoring. Combined Likert data are also presented for the 3 dosing levels and both image modalities (PET and PET/MRI).
For FROC analysis, 6 confidence intervals were used, ranging from no lesion present (1) to definitely a lesion present (6). For data analysis, a true-positive (localization and detection) was defined as having a matched axial slice number and corresponding SUVmax. After the study had been completed, the ground-truth lesion-present cases were determined upon review with a senior radiologist, with all MRI data (T2-weighted and diffusion-weighted images) and patient record information included. A weighted JAFROC metric, similar to the area under the weighted FROC, was calculated and used to characterize the performance (29,30). The data were grouped by the 3 dosing levels used and the 2 modalities—PET-only and PET/MRI—for a total of 6 comparisons. Data were analyzed for each reader independently and a combined average. Statistical analysis was performed in R, version 3.3.
RESULTS
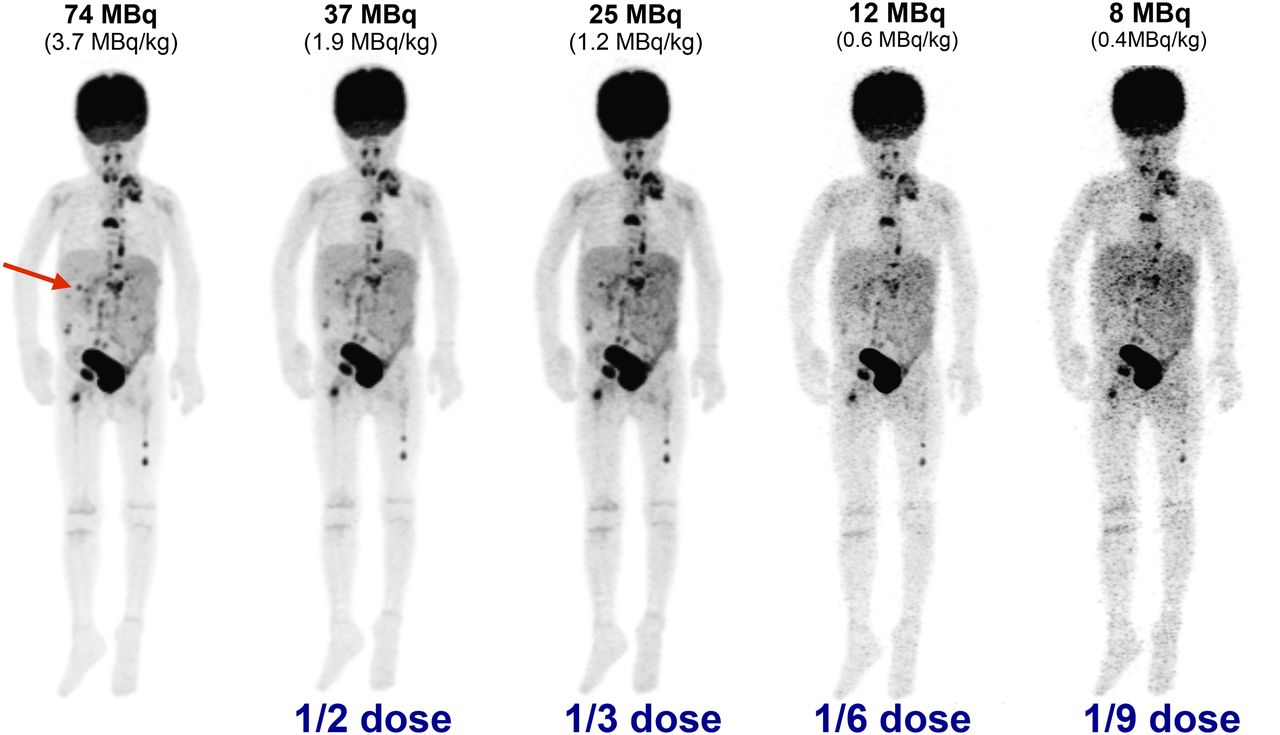
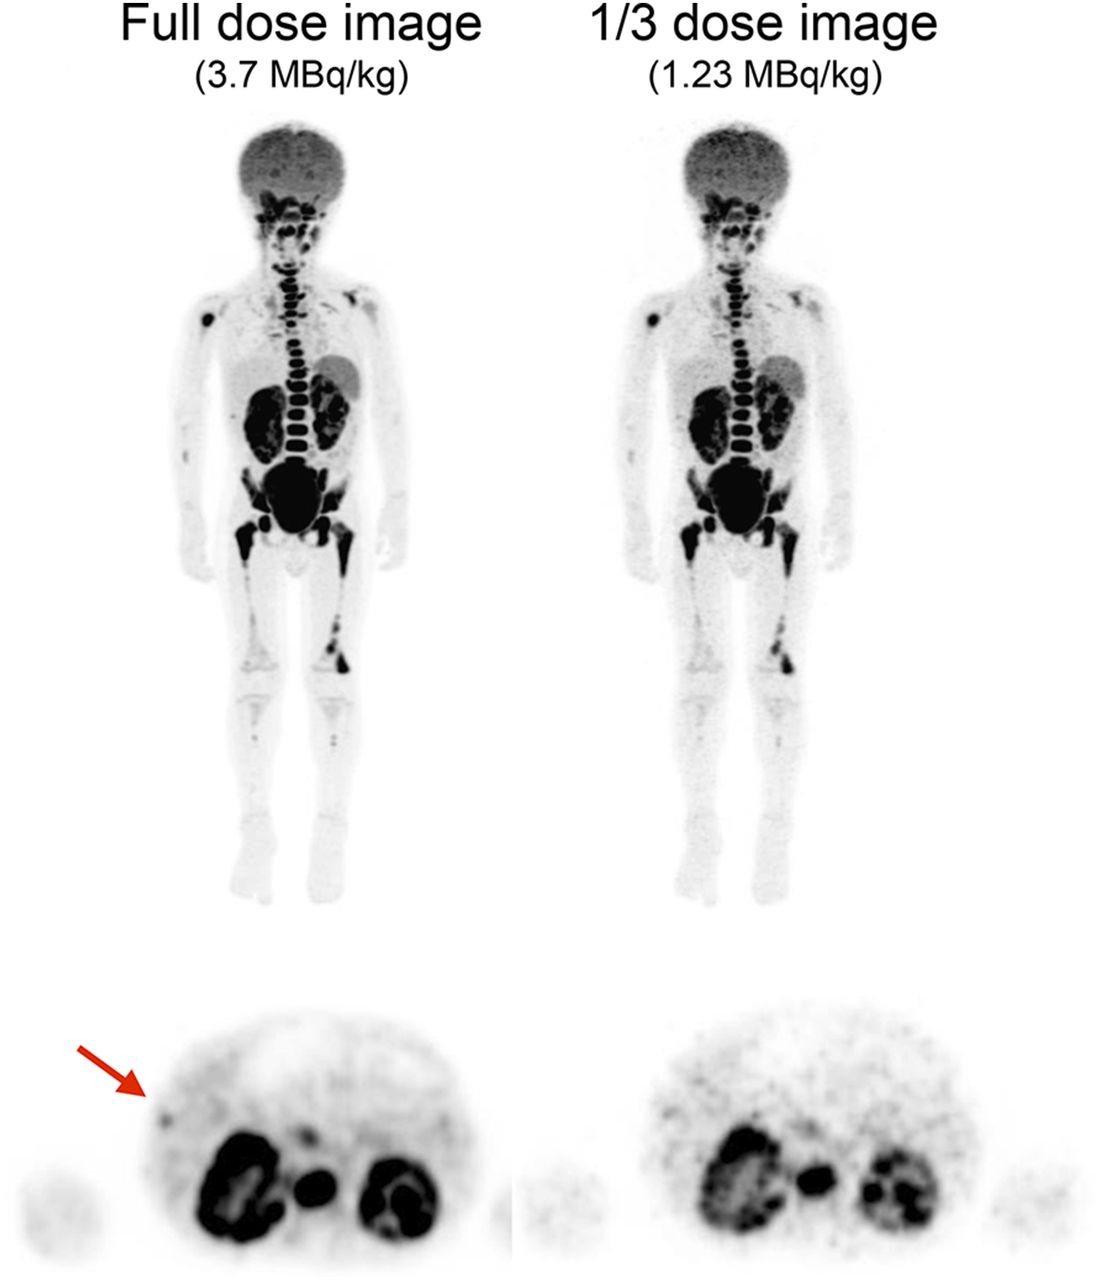
Maximum-intensity-projection PET images from 2 patients are shown in Figures 1 and 2 at various dose levels. In Figure 1, as expected, lower-dose images appear nosier because of the reduced number of events in the PET raw data (list file). The increased coarseness of liver tissue in low-dose images degrades detectability considerably, and on the basis of visual inspection, 2 of the 3 liver lesions are not detectable at dose levels of 0.6 MBq/kg (⅙ dose) and lower. Large, high-contrast bone lesions in the femur remain detectable down to 0.4 MBq/kg, demonstrating the task-dependent nature of small metastatic lesion detection. As observed in Figure 2, a small liver lesion with low contrast becomes difficult to detect at dosing levels below 1.2 MBq/kg due to higher background noise in the surrounding liver tissue.

Maximum-intensity PET projections of 20-kg, 5-y-old patient with metastatic rhabdomyosarcoma; clinical full-dose image (far left, 74 MBq injected) and generated low-dose images are shown. Three liver lesions were identified in clinical image (arrow points to largest and highest-contrast lesion). Noise in generated images is visibly increased, as seen by pronounced heterogeneity of liver tissue. Confidence in lesion detection was compromised for doses lower than 1.2 MBq/kg, and no lesions could be identified at 0.4 MBq/kg. Window level was matched for all images.

(Top) Maximum-intensity PET projections of 2-y-old patient with Burkitt lymphoma. (Bottom) Axial slices through liver. Arrow indicates subtle 18F-FDG–avid lesion within liver that was not observed on MRI.
SUV Bias and Uncertainty
The SUVs of healthy liver tissue (background) and foci of avid uptake (lesions) within the liver were measured to assess the change in SUVs as the dose is reduced. Four age groups were used, to account for the known change in 18F-FDG liver uptake with age (31). SUV measurements of the liver background for 2 age groups are shown in Figure 3. Both SUVmean and SUVmax are plotted as the average of multiple VOI measurements, with ±SD as the error bar. As the dose level is systematically reduced from the clinically used 3.7 MBq/kg, there is a pronounced increase in the SUVmax of the liver background. This increase is caused by noise amplification at low count levels (lower-dose scans), therefore causing the maximum pixel value to be higher and increasing the SE in the background measurement. Since the SUVmean is the average of many voxels, it is relatively immune to fluctuations based on noise; however, a slight increase in uncertainty is observed. The absolute difference between SUVmean and SUVmax is expected, and as noted previously, we observed an increase in liver SUV with age.

Measurements of liver background uptake for decreasing dosing regimens. Plots show mean (±SD) VOI measurements in background liver tissue from each patient. (A) Patients 2–5 y old (n = 4). (B) Patients 11–15 y old (n = 3).
The SUV measurements of liver lesions from low-dose images are shown in Figure 4. The values plotted are in reference to the clinical, full-dose image, and 2 dose levels are assessed: ½ dose (1.9 MBq/kg) and ⅓ dose (1.4 MBq/kg). Changes in SUVmax had a maximum bias of approximately 14%, for ⅓-dose images of the youngest patient group (2–5 y old). For all age groups except 2–5 y, the bias on SUVmax was negative. All other age groups showed a negative bias in low-dose lesion quantification. The variability in SUVmax was higher in all age groups for ⅓ dose than for ½ dose, but the variability observed was generally lower than 20%, which is similar to PET SUV accuracy in test–retest studies (32). Comparatively, lesion uptake assessed by SUVmean resulted in a much smaller bias and had lower variability as dose levels were reduced. The maximum bias observed in SUVmean was approximately 6% at ⅓ dose. These data suggest that SUVmean is a much more accurate metric for low-dose (low-count) image quantification; however, VOI determination could be more difficult in low-dose images.
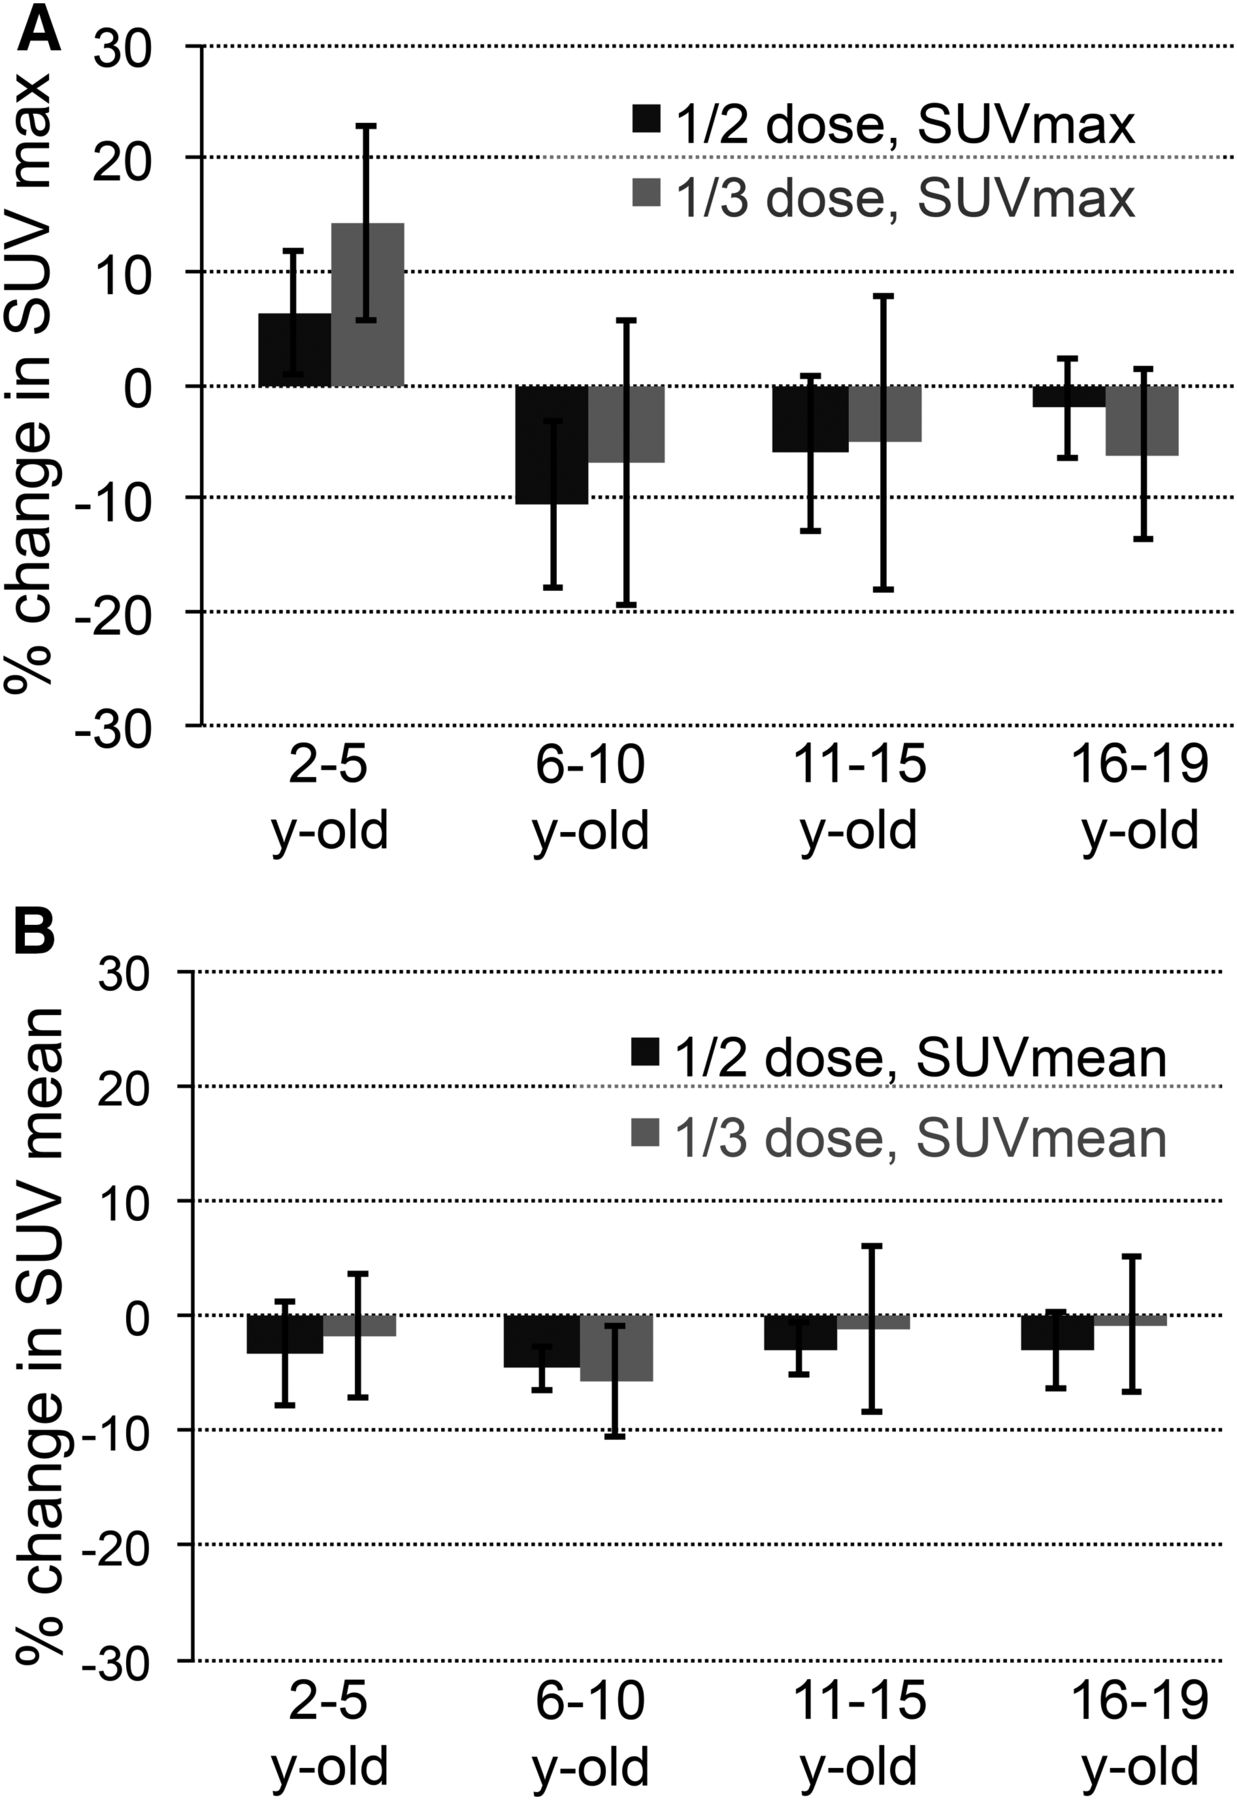
Bias and variability in lesion SUVmax (A) and SUVmean (B) at 2 dose levels in 4 age groups. Plot shows mean percentage difference ± SD compared with full-dose SUV measurement. Total lesion count was 28.
Qualitative Image-Quality Assessment
Qualitative assessment of image quality was based on Likert scoring; the resulting data were combined for all readers and compared at each dose level for PET and PET/MR images. Shown in Figure 5 are box plots of the Likert scoring data, and in Table 2 are shown the mean, SD, and κ coefficient for each grouping. The high κ coefficient (>0.79) shows that there was good agreement between readers. For PET-only images, the mean Likert score decreased and the variability in scoring was larger as the dose level was reduced. This finding is consistent with the visible increase in PET image noise at low doses. In Likert scoring of PET/MR images, no such trend was observed with low-dose images. The mean Likert score of PET/MR images ranged from 4.2 to 4.3 for all dose levels and was higher than that of PET-only images for all dose levels. Only 1 PET/MR image was rated as undiagnostic; however, this was a full-dose image, and subsequent grading of the low-dose images from the same patient were rated as 3 and 4 on the ½- and ⅓-dose images, respectively.
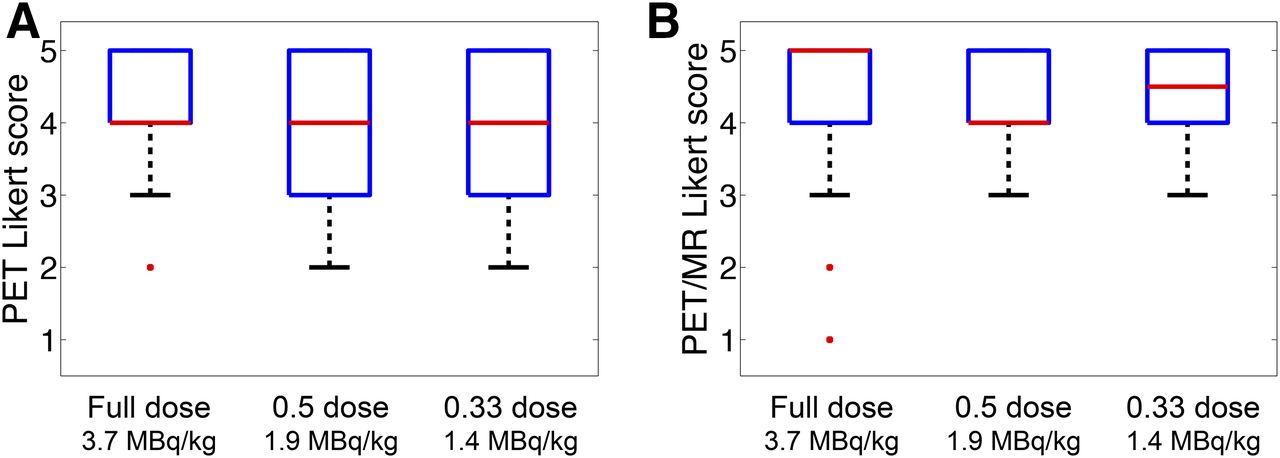
Summary of Likert scoring, averaged for all readers and grouped by dose level, for PET-only images (A) and PET/MR images (B). Plots show median (red lines), 25th–75th percentiles (box outlines), minimum (whisker), and outliers.
Likert Data with 5-Point Scoring
The tabulated total lesion count from the 10-patient cohort is shown in Table 3 for each reader at each dose level. There were differences among the 3 readers in the total number of lesions recorded, but the change in lesion count with dose level was minimal. For all readers, the total lesion count was increased when reviewing the PET/MR images compared with the PET images alone. An increase in false-negatives was observed for low-dose images, presumably due to the increase in image noise and lower confidence in small, low-contrast lesions. No noticeable increase or change in false-positives was observed in low-dose images.
Lesion Counting Performance
Lesion-Detection Performance
The lesion-detection performance was analyzed by dose level and modality (PET-only and PET/MR images) using a weighted JAFROC method to calculate a false omission (FOM) rate. No statistical significance (P > 0.11) was observed for global differences in the estimated reader FOM rate among different dose levels or between PET and PET/MRI. The finding of no change in lesion-detection performance supports the hypothesis that image quality is not degraded as the dose level is reduced down to ⅓ of the clinically used dose. The performance for each reader is shown in Table 4. A pairwise test for FOM rate differences for each dose level and modality was performed, and the results are summarized in Table 5. Significant reductions (P < 0.05) in FOM rate were found between full-dose PET/MRI and ½-dose PET/MRI compared with ½-dose PET alone; however, since the global test was not significant, we conclude that these individual tests are also not significant. In general, all FOM rates were relatively high, suggesting that the detection task had an inherently high sensitivity and specificity. The estimated reader FOM rate performance is shown in Figure 6, and no correlation in FOM rate with dose was observed. However, the error (2σ) is relatively high compared with the changes in FOM rate with dose, and a small dependency on dose is therefore possible. When the PET/MRI data were evaluated, 2 key points were observed: first, all FOM rates were higher, and second, there was a stronger dependence on dose.
Individual-Reader JAFROC Results
P Values from Pairwise Testing of JAFROC Differences
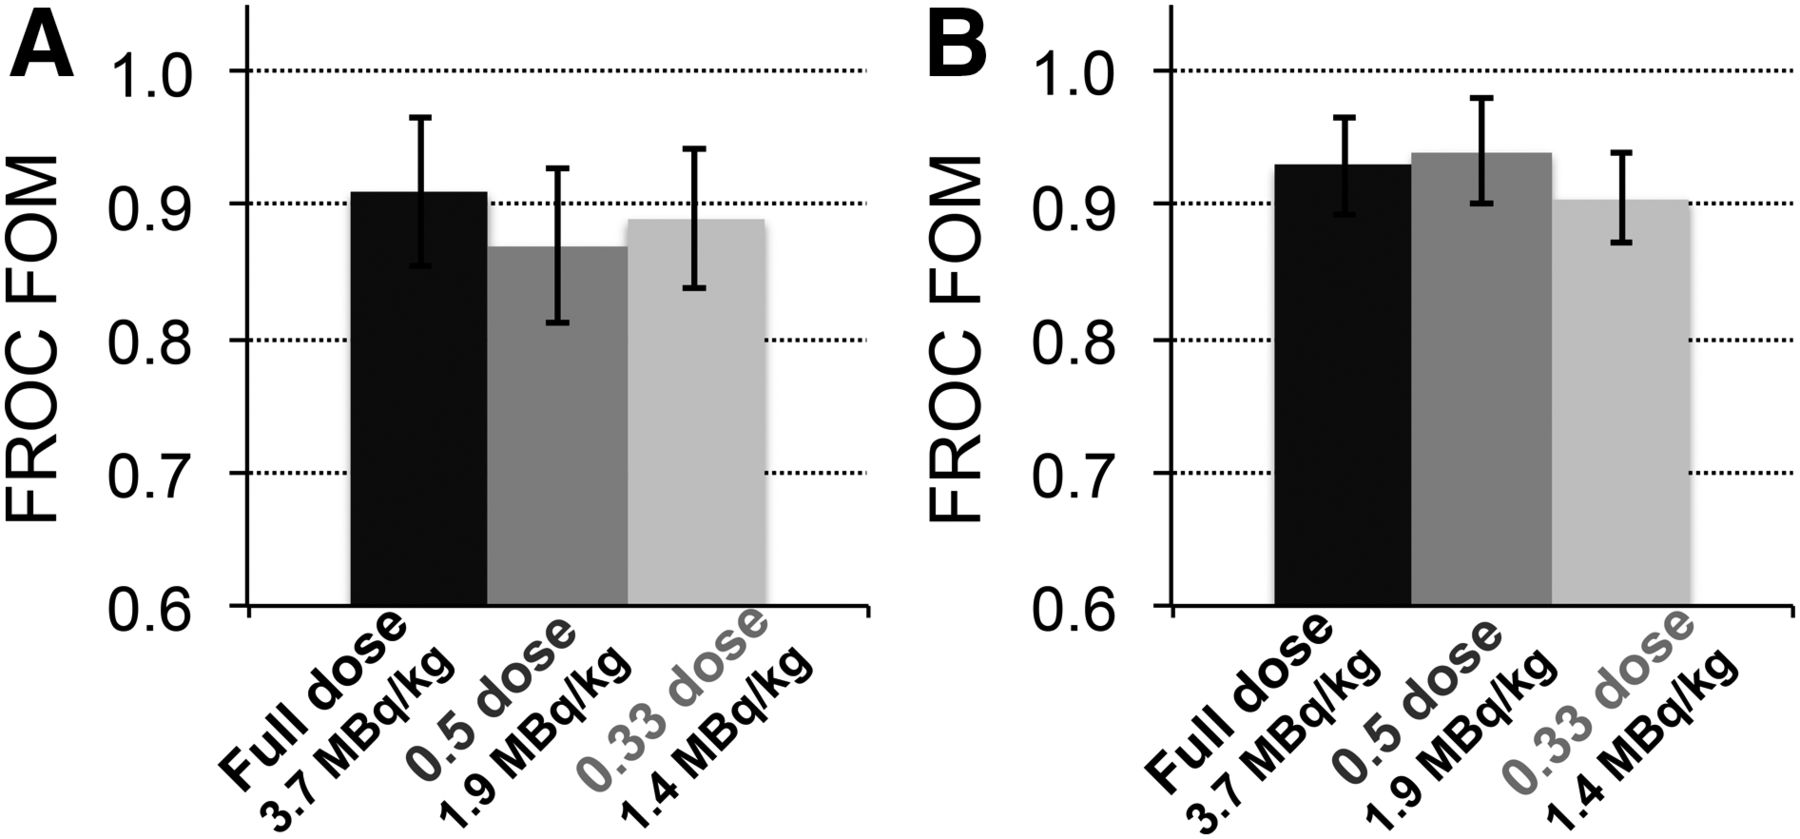
Estimated human observer performance quantified by JAFROC metric. Reader performance was measured at 3 dosing levels. (A) JAFROC values from readings of PET-only images. (B) JAFROC values from PET/MRI data using T1-weighted image.
DISCUSSION
Avoiding unnecessary radiation exposure is of the utmost importance when imaging pediatric patients, as their sensitivity to radiation is heightened and, for patients cured of their disease, there is a greater risk for radiation-induced cancers because of longer life expectancies. Our results from generated low-dose pediatric images, covering an age range from 2 to 19 y old, show no distinct degradation in imaging quality down to a linear dosing regimen of 1.2 MBq/kg (⅓ of the current clinical protocol) based on FROC lesion-detection performance and analysis of SUV quantitation. Our study was based on images from the abdomen with a focus on the liver, which can be a challenging site for oncologic reading. The liver is also subject to nonuniform attenuation in a patient body and nonuniform activity distribution in the surrounding regions. Therefore, in addition to degradations caused by increased image noise at low counts, the accuracy of PET data corrections is also tested. Analysis of SUV measurements in background liver tissue and liver lesions showed that SUVmax was unstable at dose levels lower than 1.2 MBq/kg (⅓ dose). Smaller bias and variability were measured with SUVmean; however, SUVmax is currently used clinically and is likely more relevant for highly heterogeneous tumor volumes. A reliable measurement of SUV is particularly important for many oncologic imaging applications, such as response to treatment in lymphoma.
A slight degradation in Likert scoring was found in low-dose PET-only image volumes, but this trend was not observed in PET/MR images. There was no change in lesion count for low-dose images, and there was no significant degradation in lesion-detection performance at low doses. Together, these findings suggest that the quantitative accuracy of PET SUVmax is primarily what limits further reductions in dose. Changes to clinical protocols to include SUVmean or optimization of the reconstruction settings for low-dose images are likely to further improve the quality of images at lower doses. However, as shown in Figure 2, very small low-uptake lesions may not be detectable at low doses, and therefore, false-negatives cannot be excluded. The clinical significance of such small lesions is uncertain, but we view them as important.
A reoccurring trend in our lesion-detection data was that image-quality values of PET/MRI data were consistently higher than those of PET data alone. This trend was observed in Likert scoring, lesion counting, and FROC FOM rate. We interpret this observation as stemming from the accurate anatomic correlation inherent in PET/MRI, increasing confidence in the analysis of PET uptake. Analysis of the lesion-detection performance from individual readers showed that the reader with the least experience in 18F-FDG PET had the biggest increase in performance with PET/MR images compared with PET images alone. The benefit from combining both modalities is clearly evident for soft-tissue lesions, for which detection with MRI is highly sensitive and specificity can be significantly improved with PET. In these cases the PET SUV will be an important metric, and quantitation is therefore critical (33,34).
Though methodologies differ, the tracer dosing regimens proposed in this work can be directly compared with other studies. Work from Accorsi et al. (11) and Alessio et al. (12) found optimal regimens of 4.5 MBq/kg (regimen was nonlinear, shown for a patient weight of 40 kg, and scaled to 3 min/bed position) and 5.3 MBq/kg, respectively, which are much higher than the 1.2 MBq/kg found in this work and in fact higher than our clinically used protocol of 3.7 MBq/kg. This finding is not surprising given that the PET scanners used in these previous works were of earlier generations, had National Electrical Manufacturers Association photon sensitivities that were 61% and 83% lower, respectively, than the Signa PET/MRI system, and were non-TOF. A study by Gatidis et al. (13) suggested that pediatric oncology PET/MRI tracer regimens as low as 2 MBq/kg (scaled to 3 min/bed position) were feasible; this study used the Siemens mMR system, and after accounting for the differences in photon sensitivity between systems, is comparable to the lowest regimen studied in this work. We note that the mMR is non-TOF whereas the Signa has a nearly state-of-the-art TOF resolution, suggesting that our 1.2 MBq/kg is either still conservative or that TOF is not important for smaller pediatric patients. Since our pediatric population also included several older patients, whose size much more closely resembles adults, we can also make comparisons with a tracer reduction study using the mMR on adults (35). Because of the presence of artifacts, that paper concluded that although 2 MBq/kg might be possible, 3 MBq/kg is recommended. In our studies, no artifacts as described have been observed.
Our results suggest that improved PET designs for higher photon sensitivity enable dose reduction for pediatric patients by reducing the amount of injected activity required. It is likely that TOF is also assisting in dose reduction; however, specific studies on the improvement with TOF in pediatrics are needed. Dosimetry results from a 50-patient sample undergoing 18F-FDG PET/MRI (Jeffrey P. Schmall, unpublished data, July 2018) show that our effective doses on average are lower than 4 mSv—lower than previously published results (36,37)—and with PET/MRI represent the entire dose from the study. For PET/CT instruments, the dose from CT can add 2–10 mSv, depending on the CT protocol (38). Recent research on ultra-low-dose CT protocols have demonstrated that CT doses of as low as approximately 0.3 mSv can be achieved if the CT is to be used only for attenuation correction and localization (39), meaning that even for PET/CT, the PET dose is currently the largest contributor to the overall scan dose. Therefore, to achieve lower patient doses, the amount of 18F-FDG activity must be reduced. In our study, this reduction was accomplished by using a newly designed PET scanner with latest-generation silicon photomultiplier–based detectors achieving a high system photon sensitivity. If using an older-generation PET scanner, one could compensate for lower injected activities by using a longer time per bed position; however, motion and anesthesia become an issue. There are several PET technologies on the horizon—long-axis PET and total-body PET (40,41)—which have even higher photon sensitivities and could enable imaging with much lower injected activities, resulting in scans with a very low dose. Currently, these PET designs have been proposed only for PET/CT configurations and are likely to make CT the largest contributor to dose again.
Our study had several limitations. The results are relevant to only a specific scanner and may not be generalizable to all other types of PET systems. The number of scans was small, although this is a reality for pediatric studies unless a multicenter trial is used. Only a single part of the body was studied, and the results may not be generalizable to other parts. We believe the liver is a challenging site and, therefore, that dose reduction comparisons are relevant. Ground truth was ultimately subjective, and no biopsy data were included. Inclusion of such data would possibly change the absolute JAFROC values but would not impact any trend in dose level. The data are also specific to the Signa PET/MRI system and specific for 18F-FDG and therefore difficult to generalize to other PET systems and tracers.
CONCLUSION
In light of the recent discussions about as-low-as-reasonably-achievable policy and image-gently initiatives, radiotracer overdosing—especially in pediatrics—should be avoided and studies optimizing scan dose are needed. However, it is important to remember that degradation of diagnostic image quality caused by dose reduction is likely to have a more significant impact on pediatric care; careful evaluation, as presented in this work, is therefore required. After analyzing our results, the Children’s Hospital of Philadelphia is considering decreasing the injected dose for clinical 18F-FDG PET/MRI to 2.46 MBq/kg (a 33% reduction compared with the current 3.7 MBq/kg) and creating a second protocol for high-risk patients—who have either an extensive cumulative radiation exposure or genetic predispositions that make them more susceptible to DNA damage—that will use 1.8 MBq/kg (a 50% reduction).
DISCLOSURE
Financial support was received from the NIH (R01-CA113941 and R01-EB028764) and from the Department of Radiology, Children’s Hospital of Philadelphia. No other potential conflict of interest relevant to this article was reported.
KEY POINTS
QUESTION: In low-count 18F-FDG PET/MRI pediatric studies, is image quality degraded in terms of lesion-detection performance and SUV quantitative accuracy?
PERTINENT FINDINGS: Our results show changes in VOI quantification with SUVmax in low-count images due to increased noise levels; however, the effect on qualitative image quality was minimal, and there was no statistically significant difference in lesion-detection performance from the clinical count level down to ⅓ of that level.
IMPLICATIONS FOR PATIENT CARE: Low-count PET/MRI can be used to lower the injected activity and therefore reduce the total imaging dose, as is relevant to pediatric imaging. With no loss in image quality, low-dose PET/MRI protocols could expand the use of PET in pediatric patients and allow for repeat scanning without concern about dose.
Acknowledgments
We thank the nuclear medicine and MRI technologists and staff from the Children’s Hospital of Philadelphia, particularly Elad Nevo and Ralph Magee, for their help in acquiring and processing the data.
Footnotes
Published online Jun. 1, 2020.
- © 2021 by the Society of Nuclear Medicine and Molecular Imaging.
REFERENCES
- Received for publication January 8, 2020.
- Accepted for publication May 7, 2020.


