


Abstract
Cri du chat syndrome (CDCS) is a rare genetic disease that is caused by a deletion in the short arm of chromosome 5 (5p) and has a variable clinical spectrum. To our knowledge, no study in the literature has ever applied 18F-FDG PET/CT to investigate alterations in brain glucose metabolism in these subjects. The aims of this study were to detect differences in brain 18F-FDG metabolism in CDCS patients with different clinical presentations and identify possible brain metabolic phenotypes of this syndrome. Methods: Six patients (5 male and 1 female; age range, 10–27 y) with CDCS were assessed for the presence of cognitive and behavioral symptoms using a battery of neuropsychologic tests and then classified as having either a severe or a mild phenotype. The patients then underwent brain 18F-FDG PET/CT. The PET/CT findings were compared with an age- and sex-matched control group using statistical parametric mapping (SPM). Whether there was an association between different clinical phenotypes and 18F-FDG PET/CT findings was investigated. Results: Four patients had the severe phenotype, and 2 patients demonstrated the mild phenotype. SPM single-subject analysis, and a group analysis in comparison with the control cohort, revealed significant hypometabolism in the left temporal lobe (Brodmann areas [BAs] 20, 36, and 38), in the right frontal subcallosal gyrus (BA 34) and caudate body, and in the cerebellar tonsils (P < 0.001). Hypermetabolism (P = 0.001) was revealed in the right superior and precentral frontal gyrus (BA 6) in the patient group, compared with the control cohort. In SPM single-subject analysis, the hypermetabolic areas were detected only in patients with the severe phenotype. Conclusion: This study revealed different patterns of brain glucose metabolism in patients with the severe and mild phenotypes, compared with control subjects. In particular, abnormal hypermetabolism in the brain, as evaluated by18F-FDG PET/CT, seems to correlate with the severe CDCS phenotype.
Cri du chat syndrome (CDCS) is a rare genetic disease with an incidence ranging from 1 in 15,000 to 1 in 50,000 live births, caused by either a partial or a complete deletion of chromosome 5p (1). The clinical phenotype depends on the location and extent of the genomic region involved in the 5p deletion, with the breakpoint location varying from p13 (D5S763) to p15.2 (D5S18) (2–5). The various phenotypes are characterized by different degrees of severity in the developmental and behavioral problems associated with the disease. Physical and behavioral characteristics include a high-pitched cry, microcephaly, a broad nasal bridge, epicanthal folds, micrognathia, and severe psychomotor retardation (2). Diagnosis is based on clinical manifestations and requires karyotyping, array comparative genomic hybridization, and, eventually, fluorescence in situ hybridization for doubtful cases (1,2). The most frequent structural brain abnormalities, as shown by the few studies available in the literature using MRI, include brain stem hypoplasia (with predominantly pontine involvement), thinning or agenesis of the corpus callosum, cerebellar vermian atrophy (or agenesis), cerebellar cortical thickening, and incomplete arborization of the white matter (6,7).
It is well established that 18F-FDG PET/CT is an important tool for the assessment of cerebral metabolism in several neurologic diseases, showing different metabolic patterns that support both an early diagnosis and a neurologic disability evaluation (8–10). To our knowledge, no study has ever correlated brain glucose metabolism with phenotypical presentation in patients with CDCS. Therefore, we aimed to investigate the distribution of brain glucose metabolism in CDCS patients to identify possible brain metabolic phenotypes of this syndrome.
MATERIALS AND METHODS
We prospectively and consecutively evaluated 6 CDCS patients (1 female and 5 male; age range, 10–27 y) having different deletion sizes in the 5p region. Patients 5 and 6 were monozygotic twins with mosaic 46,XY,del(5)(p14)/46,XY. All 6 patients underwent a complete neurologic and neuropsychiatric clinical assessment, including Vineland adaptive behavior scales. According to the various levels of severity deficits in intellectual and adaptive functioning, as defined in DSM V (Diagnostic and Statistical Manual of Mental Disorders, fifth edition) (11), each patient was classified as having either a mild or a severe clinical phenotype.
Exclusion criteria were pregnancy, an inability to lie still for the duration of the PET scan (15 min), and a previous diagnosis of oncologic or other neurologic disease in the medical history.
The study was proposed by the Scientific Committee and approved by the Ethical Review Board of the Associazione Bambini Cri du Chat. Each patient, or the parents of those less than 18 y old, provided written informed consent after receiving a detailed description of the study’s aims.
18F-FDG Brain PET/CT
All brain PET/CT was performed after the subject had fasted for at least 6 h and blood glucose level had been measured (maximum, 130 mg/dL). The patients were positioned comfortably in a quiet and darkened room at least 20 min before 18F-FDG administration and during the uptake phase. They received a fixed activity (185 MBq) of 18F-FDG through an intravenous cannula according to European Association of Nuclear Medicine procedural guidelines (12). The PET/CT scans started approximately 60 min after the injection and lasted 15 min. A polycarbonate head holder was applied to avoid head movement during the scan. The PET scans were acquired using a Discovery STE PET/CT system (GE Healthcare) in 3-dimensional mode with a total axial field of view of 30 cm and no interplane gap. 18F-FDG PET/CT brain data were collected through sequential scans: CT data were used for attenuation correction of the PET data, with a thickness of 3.75 mm, 140 kV, and 60–80 mA/s. The PET brain scan had 1 field of view of 30 transaxial centimeters. The PET data were reconstructed using 3-dimensional iterative ordered-subsets expectation maximization with corrections for random, scatter, and attenuation (VUE-point; GE Healthcare) (28 subsets and 4 iterations). Data were collected in 128 × 128 matrices with a reconstructed voxel size of 1.33 × 1.33 × 2.00 mm.
Statistical Analysis
The patient-group and single-subject analyses compared the 18F-FDG PET brain scans with those of a neurologically normal group of healthy subjects matched for age and sex, extracted from a control cohort of 40 individuals previously used in another research study (13). Preprocessing and statistical analyses were performed by statistical parametric mapping (SPM, version 2; Wellcome Department of Cognitive Neurology) implemented in MATLAB (version 7.9; MathWorks). The spatially normalized set of images was smoothed using an 8-mm isotropic gaussian filter. The resulting statistical parametric maps, SPM{tdc}, were transformed into normal distribution (SPM{z}) units. The SPM coordinates were corrected to match the Talairach coordinates by a subroutine implemented by Matthew Brett (http://brainmap.org/index.html). Brodmann areas (BAs) were then identified at a range of 0–3 mm from the corrected Talairach coordinates of the SPM output isocenters, after the corrected coordinates had been imported by the Talairach client (http://www.talairach.org/index.html) using SPM. To test the overall statistical significance of metabolic differences, 1-way ANOVA was performed using the SPM f-contrast routine between the patient and control groups. A 2-sample unpaired t test was used to identify areas of relative hypo- and hypermetabolism in both the patient group and the single patients. Age and sex were included as nuisance variables in all SPM analyses. We used a P value threshold of 0.05, corrected for multiple comparisons with the false-discovery-rate option, to explore SPM t-maps at the cluster and voxel levels, considering clusters with more than 100 voxels to be significant. If statistical significance was not reached, the threshold at the voxel level was explored at a P value of less than 0.001 uncorrected for multiple comparisons.
RESULTS
Patient Clinical Characteristics
According to the DSM V criteria, each subject was classified as having either a mild (patients 4 and 6) or a severe (patients 1, 2, 3, and 5) clinical phenotype. The patient characteristics are summarized in Table 1. All patients with the severe phenotype had speaking and socialization problems. Impairment in the execution of daily activities was the most frequent clinical characteristic (3 of the 4 patients with the severe phenotype), along with microcephaly (3 of 4 patients) and reduced pain sensibility (3 of 4 patients). Movement disorders were present in 3 of the 4 patients with the severe phenotype. Skin picking was documented in 1 patient with the severe phenotype. A patient with the mild phenotype had socialization problems and movement disorders. Hashimoto thyroiditis was present in both twin patients (patients 5 and 6).
Summary of Patient Characteristics with Main Clinical Manifestations
Patient Genetic Abnormalities
The patients with the severe phenotype had the following genetic mutations: 46,XY,del(5)(p14.3→pter) in patients 1 and 2, 46,XY,del(5)(p15.1→pter) in patient 3, and 46,XY,ish del(5)(p14)/46,XY in patient 5. The genetic mutations in the patients with the mild phenotype were 46XX,del(5)(p15.2→pter) and 46,XY,ish del(5)(p14)/46,XY in patients 4 and 6, respectively. The karyotype found in the twin patients (patients 5 and 6) was 46,XY,ish del(5)(p14).
SPM Analysis
SPM group analysis revealed a statistically significant relative hypometabolism in the left temporal lobe (BAs 20, 36, and 38) in the patient group, compared with the control cohort (P < 0.001). Furthermore, hypometabolism was also detected in the right frontal subcallosal gyrus (BA 34) and caudate body and in the cerebellar tonsils (Fig. 1; Table 2).
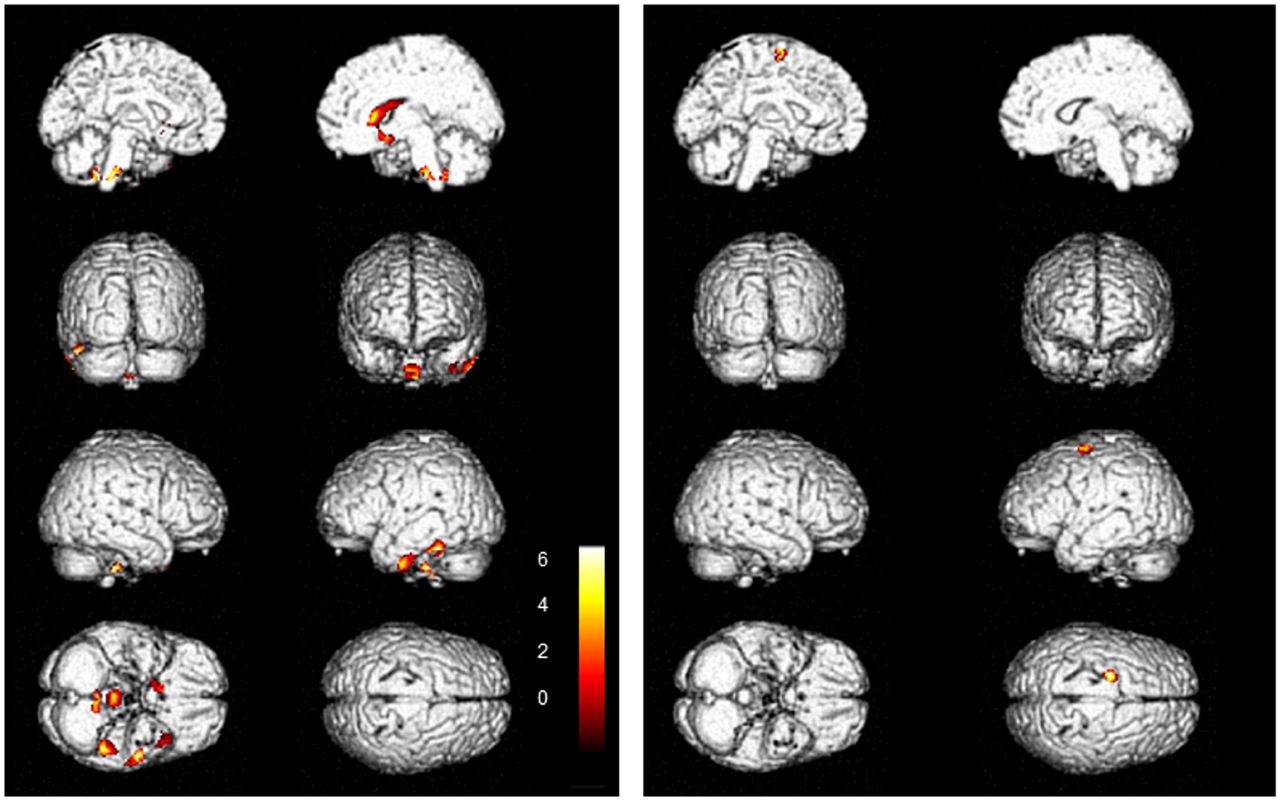
Brain 3-dimensional rendering showing regions in which 18F-FDG uptake significantly differed between CDCS patients (n = 6) and controls (threshold P < 0.001, uncorrected for multiple comparisons at voxel level). Shown are left medial view (first row, left image), right medial view (first row, right image), left posterior view (second row, left image), right frontal view (second row, right image), right-side view (third row, left image), left-side view (third row, right image), view from below (fourth row, left image), and view from above (fourth row, right image). Images are color-graded in terms of z values. (Left) Controls vs. patient group. Relative hypometabolism is seen in left temporal lobe (BAs 20, 36, and 38). (Right) Patient group vs. controls. Relative hypermetabolism is seen in right middle frontal gyrus (BA 6). Talairach coordinate and regional details are provided in Table 2.
Talairach Coordinate and Regional Details
Statistically significant relative hypermetabolism (P = 0.001) was found in the right premotor cortex (BA 6) in the patient group, in comparison with the controls (Fig. 1). In SPM single-subject analysis, the hypermetabolic areas were detected only in patients with the severe phenotype (Fig. 2).
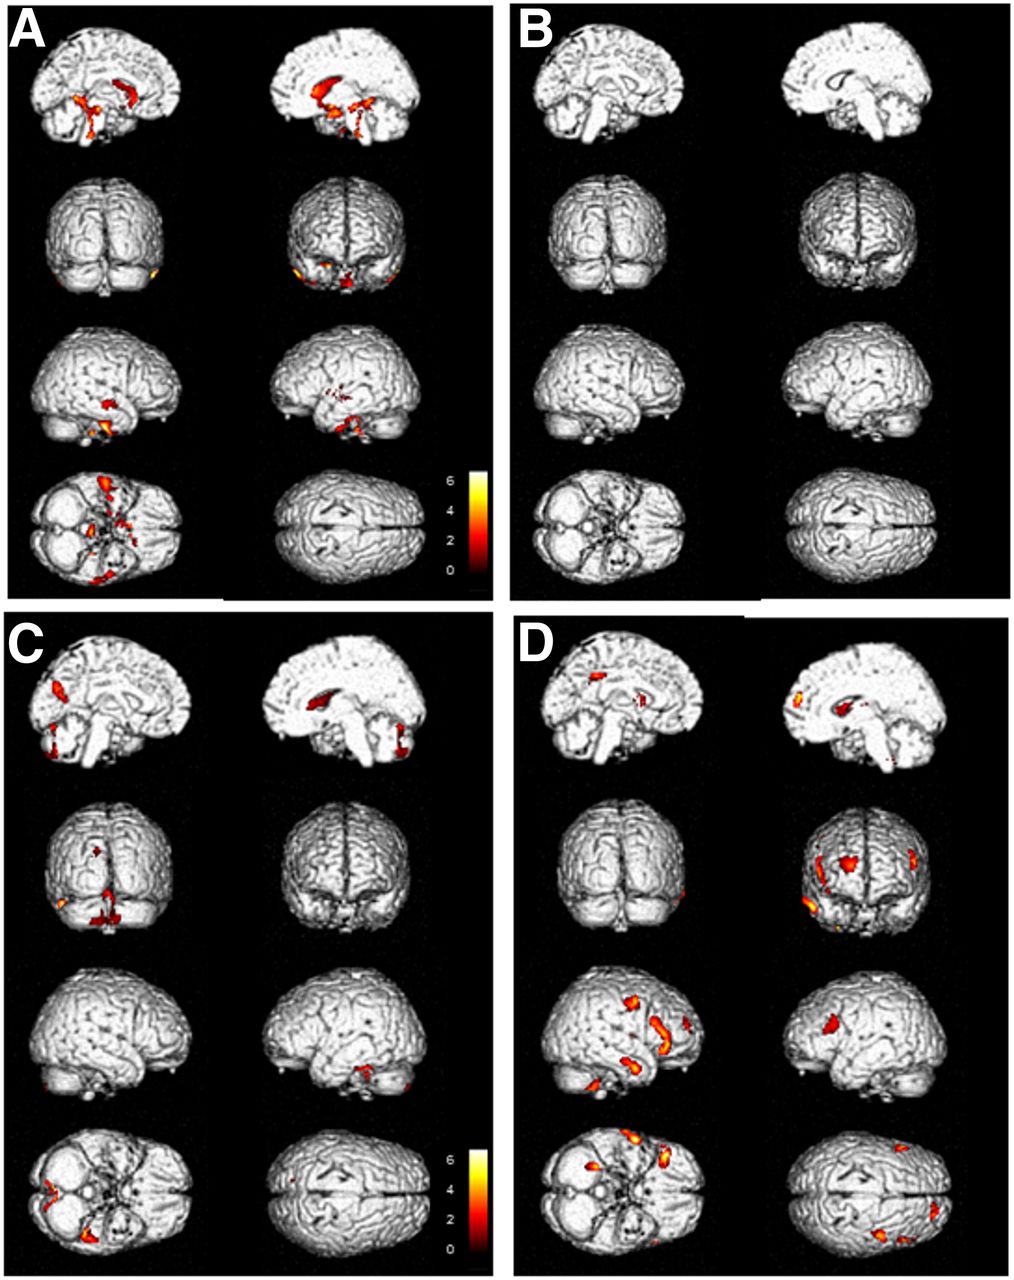
Brain 3-dimensional rendering showing regions in which 18F-FDG uptake significantly differed between single patient with CDCS and reference database (threshold P < 0.001, uncorrected for multiple comparisons at voxel level). Images are color-graded in terms of z values. (A and B) Relative hypometabolism (A) and hypermetabolism (B) in patient with mild phenotype. Relative hypometabolism (C) and hypermetabolism (D) in patient with severe phenotype. Patient with mild phenotype does not show any hypermetabolic finding (B).
DISCUSSION
The diagnostic work-up of CDCS includes clinical assessment and genetic evaluation to detect deletion of 5p. Brain MRI is used to uncover structural brain abnormalities such as marked atrophy in the brain stem, a small cerebellum, and small middle cerebellar peduncles (6,7,14,15).
To the best of our knowledge, the present report is the first describing the use of 18F-FDG PET/CT in the evaluation of brain glucose metabolism in patients with CDCS. All patients demonstrated several hypometabolic brain areas at the SPM analysis. 18F-FDG hypometabolism is a common feature in many neurologic diseases (16), and characteristic spatial patterns reflecting several possible causes have been identified, such as brain atrophy, decreased cerebral metabolic rate of glucose, regional synaptic dysfunction or deafferentation, and transneural metabolic depression (17–19).
The main hypometabolic region detected in our patients was the left inferior temporal and homolateral temporal pole cortex (BAs 20, 34 36, and 38), which is involved in verbal production and comprehension, working memory, and selective attention to speech (20–22). Furthermore, the left BA 20 is involved in language associations and perceptual skills (20–23), whereas the left BAs 34 and 36 are associated with the ability to experience and process emotion; these areas also contribute to novelty discrimination (24,25). Although the hypometabolism in these areas can be related to the altered cognition and the disturbances in emotion, memory, and language in our CDCS patients (26–29), these defects alone are not sufficient to explain all the clinical features of patients with the severe phenotype. Interestingly, in our patients, significant hypometabolism was also found in the cerebellar tonsils. These structures belong to the neocerebellum, which receives input from the cerebral cortex and helps in planning movement of the distal limbs (30). The reduced glucose metabolism in the cerebellar tonsils may reflect reduced inhibition of the circuits directed to the vestibular nuclei and can help explain the movement disorders documented in our patients. This hypothesis finds support in a few studies reporting reduced glucose metabolism in the cerebellar tonsils in congenital ocular motor apraxia (31) and downbeat nystagmus (32).
In the scarce available literature, MRI studies have shown vermian hypoplasia to be a hallmark of CDCS patients (33). However, our study found only a trend toward hypometabolism in this structure. We hypothesize that future larger studies may be able to clarify the significance of this result.
The phenomenon of skin picking was documented in only 1 subject in our patient cohort (34,35). Vogt et al. evaluated regional cerebral blood flow by means of 15OH2 PET in 7 healthy subjects receiving neuropsychologic and pain threshold testing (36). They found that 6 of 7 subjects had a reduced flow in BA 30 (in the right, left, or both hemispheres) during noxious stimulation. In a further 2 functional MRI studies, a reduced signal in BAs 30 and 5 was found to be related to noxious stimuli (37,38). All this evidence suggests that BAs 5 and 30 are involved in some aspects of the pain experience. However, in our cohort, the only patient presenting with skin picking did not show metabolic alterations in these areas but demonstrated hypometabolism in the right caudate body. That finding could be in keeping with the findings of previous researchers who documented functional underactivation bilaterally in the striatum (maximal in the right caudatum) in a small group of patients with skin-picking disorder (39). However, because of our limited number of patients and the lack of literature describing PET or functional MRI findings in CDCS patients with skin picking, it is not possible to make a definitive conclusion.
We could not establish whether patients with the mild phenotype had less severe hypometabolism than patients with the severe phenotype or vice versa, because of the limited number of subjects in the 2 groups. Nevertheless, at the single-subject analysis, the 2 patients with the mild phenotype, despite showing the same hypometabolic brain regions as patients with the severe phenotype, did not show the same symptoms. The main differences between the 2 clinical phenotypes in our study were in the hypermetabolic findings. In fact, hypermetabolic areas were not identified in patients with the mild phenotype. The role of the 18F-FDG hypermetabolic regions in disease progression is unclear. In other diseases, such as amyotrophic lateral sclerosis, 18F-FDG hypermetabolism has been linked to increased astrocytosis, a hallmark of microglial activation (4). However, we know of no study that has ever elucidated the association between microglia and disease expression in CDCS patients. In our opinion, hypermetabolic alterations may play a role in determining phenotype expression, since in the single-subject analysis, patients without hypermetabolic abnormalities did not present the severe clinical phenotype. In severe-phenotype patients, the hypermetabolic alteration involved the right premotor cortex (BA 6). This alteration could be important in explaining at least some of the movement symptoms, because this region is connected to the spinal cord via the corticopontocerebellar pathway (40). The endpoint of our next study will be to establish the correlation between the hypermetabolism in the premotor cortex and the hypometabolism in the cerebellum in a larger population of CDCS patients.
Limitations of our study were the low number of patients due to the relative rarity of the disease, the heterogeneous distribution of the genetic alterations within the patient group, and the lack of morphologic imaging examinations, such as MRI, to enable comparison of 18F-FDG uptake with anatomic alterations. Finally, some of the results could have been influenced by the heterogeneous age group of the patients; such heterogeneity may be linked to the differences in the behavioral and educational stages of the patients. Future studies should try to collect a larger number of patients to confirm our PET findings and, specifically, to confirm whether hypermetabolic alterations are typical in patients with the severe phenotype.
CONCLUSION
18F-FDG PET/CT identified differences in brain glucose metabolism between CDCS patients with severe and mild phenotypes of the disease, in comparison with control subjects. In particular, bilaterally hypometabolic areas were found in the left temporal lobe, right frontal subcallosal gyrus, right caudate body, and cerebellar tonsils of all patients, whereas hypermetabolic findings were identified only in patients with the severe phenotype. Further studies with larger cohorts are warranted to confirm these results and to evaluate the influence of different 5p deletion sites on brain glucose metabolism.
DISCLOSURE
The work received financial support from Associazione Bambini Cri du Chat. No other potential conflict of interest relevant to this article was reported.
KEY POINTS
QUESTION: Is brain metabolism altered in patients with mild and severe CDCS phenotypes?
PERTINENT FINDINGS: In a small cohort of 6 patients, 18F-FDG PET found significant hypometabolism (P < 0.001) in the left temporal lobe (BAs 20, 36, and 38), right frontal subcallosal gyrus (BA 34), right caudate body, and cerebellar tonsils. Significant hypermetabolism (P = 0.001) was detected in the right superior and precentral frontal gyrus (BA 6) in patients with the severe phenotype.
IMPLICATIONS FOR PATIENT CARE: 18F-FDG PET imaging may highlight altered brain metabolism in CDCS patients and help differentiate the severe phenotype from the mild phenotype.
Acknowledgments
We thank the patients and parents for their collaboration in this study, and we especially thank Sylvia Teresa Del Testa for inspiring the start of the study.
Footnotes
Published online Dec. 13, 2019.
- © 2020 by the Society of Nuclear Medicine and Molecular Imaging.
REFERENCES
- Received for publication September 23, 2019.
- Accepted for publication December 2, 2019.


Jump to section
Related Articles
Cited By...
- No citing articles found.