


Abstract
The PET radiotracer 68Ga-PSMA (prostate-specific membrane antigen)-HBED-CC (N,N′-bis [2-hydroxy-5-(carboxyethyl)benzyl]ethylenediamine-N,N′-diacetic acid) shows potential as an imaging biomarker for recurrent and metastatic prostate cancer. The purpose of this study was to determine the repeatability of 68Ga-PSMA-HBED-CC in a test–retest trial in subjects with metastatic prostate adenocarcinoma. Methods: Subjects with metastatic prostate cancer underwent 2 PET/CT scans with 68Ga-PSMA-HBED-CC within 14 d (mean, 6 ± 4 d). Lesions in bone, nodes, prostate/bed, and visceral organs, as well as representative normal tissues (salivary glands and spleen), were segmented separately by 2 readers. Absolute and percentage differences in SUVmax and SUVmean were calculated for all test–retest regions. Repeatability was assessed using percentage difference, within-subject coefficient of variation (wCV), repeatability coefficient (RC), and Bland–Altman analysis. Results: Eighteen subjects were evaluated, 16 of whom demonstrated local or metastatic disease on 68Ga-PSMA-HBED-CC PET/CT. In total, 136 lesions were segmented in bone (n = 99), nodes (n = 27), prostate/bed (n = 7), and viscera (n = 3). The wCV for SUVmax was 11.7% for bone lesions and 13.7% for nodes. The RC was ±32.5% SUVmax for bone lesions and ±37.9% SUVmax for nodal lesions, meaning 95% of the normal variability between 2 measurements will be within these numbers, so larger differences are likely attributable to true biologic changes in tumor rather than normal physiologic or measurement variability. wCV in the salivary glands and spleen was 8.9% and 10.7% SUVmean, respectively. Conclusion: Repeatability measurements for PET/CT test–retests with 68Ga-PSMA-HBED-CC showed a wCV of 12%–14% SUVmax and an RC of ±33%–38% SUVmax in bone and nodal lesions. These estimates are an important aspect of 68Ga-PSMA-HBED-CC as a quantitative imaging biomarker. These estimates are similar to those reported for 18F-FDG, suggesting that 68Ga-PSMA-HBED-CC PET/CT may be useful in monitoring response to therapy.
Quantitative PET imaging of prostate cancer has the potential to influence management in the setting of response to treatment and radiation dose estimation of both tumor and critical organs in targeted radionuclide therapy. Development of a quantitative imaging biomarker such as 68Ga-PSMA (prostate-specific membrane antigen)-HBED-CC (N,N′-bis [2-hydroxy-5-(carboxyethyl)benzyl]ethylenediamine-N,N′-diacetic acid) requires an understanding of the biomarker’s technical performance, including estimates of measurement linearity, bias, error, repeatability, and reproducibility (1,2). Measurement error or variability in measurement of radiotracer performance derives from many sources, including aspects of patient preparation and physiology, the imaging system, and measurement methodology. Repeatability, as an estimate of the magnitude of change that distinguishes normal physiologic and measurement variability from true biologic change, is important to the interpretation of changes encountered on PET scans in the response-to-treatment setting. Understanding baseline variability in measurement has similar utility in dose estimation in theranostic applications. In this prospective study, we obtained estimates of repeatability for 68Ga-PSMA-HBED-CC PET/CT in patients with metastatic prostate cancer.
MATERIALS AND METHODS
Study Design and Patient Population
The study was a prospective, single-institution trial consisting of a test–retest methodology. The subjects each underwent 2 68Ga-PSMA-HBED-CC PET/CT scans no less than 12 h apart and no more than 14 d apart. Strict attention was given to subject preparation and scan acquisition to ensure near-identical imaging conditions. These parameters included injected activity, radiotracer uptake time, and consistency of scanner selection and scan technique for each subject.
Eighteen subjects with castration-sensitive or castration-resistant prostate cancer were enrolled. Of these, 16 subjects demonstrated local or metastatic disease on 68Ga-PSMA-HBED-CC PET/CT. All but 2 subjects had histologic confirmation of prostate adenocarcinoma from primary or metastatic lesions; the diagnosis in 2 subjects was based on clinical presentation, elevated prostate-specific membrane antigen level, and widespread metastatic disease on conventional imaging. Individual and group characteristics are listed in Table 1. Subjects had at least 2 metastatic sites on conventional imaging (bone scanning, CT, or MRI). To avoid changes in tumor due to therapy, subjects could not receive prostate cancer therapy between the 2 examinations and were not enrolled within 3 mo of starting hormonal therapy or chemotherapy. The subjects’ systemic therapy regimens are listed in Supplemental Table 1 (supplemental materials are available at http://jnm.snmjournals.org).
Subject Characteristics
The study (NCT02952469) was approved by the institutional review board and the radioactive drug research committee. Enrollment was voluntary. Subjects were compensated $60 in total for the 2 study visits. All subjects signed an informed consent form. Periodic safety assessments were performed as required per protocol under the review board and the radioactive drug research committee with the Food and Drug Administration.
68Ga-PSMA-HBED-CC Synthesis
68Ga-PSMA-HBED-CC was manufactured on-site on the same day as the PET/CT scans. 68Ga was obtained from an on-site 68Ge/68Ga generator (IGG100; Eckert-Ziegler). Radiolabeling was performed using an automated Modular Lab PharmTracer synthesis module (Eckert and Ziegler Eurotope). The synthesis process was conducted in a sterile cassette system specifically designed for 68Ga-PSMA-HBED-CC (part C4-GA68-PSMA; Eckert and Ziegler Eurotope) using the acetone-free method (3).
Scan Acquisition and Reconstruction
Target administered activity was 129.5 MBq (3.5 mCi) followed by target uptake time of 60 min. Each subject’s scans were performed on the same PET/CT scanner, either an mCT with FlowMotion (n = 11) or a Biograph Truepoint (n = 7) (Siemens Healthcare). The scans covered skull vertex to mid thigh, with 3–4 min per bed position or the equivalent. mCT images were reconstructed onto a 200 × 200 matrix with 3.4-mm pixels using 3-dimensional ordered-subset expectation maximization with time of flight and a 5-mm gaussian filter, whereas the Biograph TruePoint images were on a 168 × 168 matrix with 3.4-mm pixels reconstructed with 3-dimensional ordered-subset expectation maximization using 4 iterations, 8 subsets, and a 7-mm filter.
Lesion Selection and Segmentation
Images were analyzed using MIM Encore (MIM Software Inc.). Initial segmentation was performed with the MIM semiautomated PET Edge tool, which uses a gradient-based technique to detect the steepest drop-off in SUVs (Fig. 1). However, manual intervention with contours was still a significant part of the segmentation process, introducing intrareader and interreader measurement variability. Two readers were used: a nuclear radiologist and a research assistant trained in use of the software and in recognition of anatomic structures and pathologic lesions. Both readers located and segmented all lesions and organs. All volumes of interest (VOIs) were reviewed together to resolve major discrepancies in organ and lesion selection and contours.

68Ga-PSMA-HBED-CC CC PET/CT for subject 2 for scan 1 (baseline) and scan 2, performed 2 d later, showing segmentation of normal tissues (salivary glands and spleen) and sites of abnormal uptake in 2 left pelvic lymph nodes (1 and 2) and left prostate bed (3).
The spleen and salivary glands were measured and analyzed, first individually and then pooled (for the salivary glands) for global repeatability. Up to 15 total bone lesions per subject were selected from across 5 skeletal regions: skull, thorax (ribs, sternum, clavicles, and scapulae), spine (cervical, thoracic, and lumbar), pelvis (sacrum and pelvic bones), and extremities. Lesions were selected if they were both high in uptake (i.e., higher than adjacent background activity) and discrete, such that the PET margins were visually identifiable to minimize interobserver variability relating to lesion segmentation. All discrete soft-tissue lesions (lymph nodes, prostate, prostate bed, and viscera) were included, except for large irregular conglomerate abdominal nodal masses in subject 8.
Soft-tissue and bone lesions of all sizes were included. Lymph node size (long axis) was measured on the CT image. The defined categories for lymph nodes included sizes of less than 1.0 cm, 1.0–1.5 cm, and more than 1.5 cm. Although many bone lesions could not be precisely demarcated on CT images, lesion size was approximated from the PET-avid VOI. Two sizing methods for bone lesions were established: VOIs less than 1.0 cm3 and at least 1.0 cm3, and VOIs less than 1.5 cm3, 1.5–8.0 cm3, and more than 8.0 cm3.
Statistical Analysis
The sample size of this study was 16 subjects. Preliminary sample size calculations indicated that between 14 and 22 subjects would be needed for an 80%–90% probability of estimating the repeatability of 68Ga-PSMA-HBED-CC to within 25% accuracy.
Activity concentrations for lesions and organs of interest were expressed as SUVs normalized to patient body weight. Metrics included SUV maximal-intensity pixel (SUVmax) and SUVmean. In each subject, the 2 readers’ measurements of each lesion and organ were averaged for scan 1 and were compared with similarly averaged measurements for scan 2. Data were also pooled and analyzed on the basis of organ and lesion location. Data were also pooled relative to scanner type and analyzed for significant difference.
Repeatability metrics were calculated as described by Lodge and Obuchowski (4,5): Eq. 1
Eq. 1 Eq. 2
Eq. 2 Eq. 3
Eq. 3 Eq. 4
Eq. 4 Eq. 5
Eq. 5
where LRC is lower RC and URC is upper RC. Relative difference (D) in SUVmax or SUVmean between scan 1 and scan 2 for each measured site was calculated as in Equation 1. The within-subject coefficient of variation (wCV) was based on the standard deviation (SD) of D over all subjects for each category of lesion or organ measured as in Equation 2. The repeatability coefficient (RC) was calculated using symmetric limits as in Equation 3. The RC or “limit of true change” is a threshold such that 95% of the normal variability between 2 SUV measurements will be within these numbers, so larger differences in scans are likely attributable to true disease progression or regression. Asymmetric lower and upper RC values were calculated as in Equations 4 and 5. Asymmetric RCs have been promoted as the preferred approach when comparing SUVs between baseline and follow-up scans (4–7). Weber et al. provide an explanation of the rationale for this approach (6).
The original measurements, not absolute values, were used to calculate D, wCV, and RC. The 95% confidence intervals (CIs) around the RC were calculated assuming a normal distribution. Scatter diagrams with linear regression were plotted for SUVmax and SUVmean for scan 1 and scan 2 measurements. Bland–Altman plots were created for both the absolute and the relative percentage differences for our data. Bias, upper and lower limits of agreement, and Kendall τ with P value were calculated as described in the literature (4,8,9). Levene and Breusch–Pagan tests for equality of variance were used to test for the significance of differences in repeatability metrics based on categoric and continuous variables, respectively. Statistical analyses were performed using STAT software, version 9.4 (SAS Institute Inc.), and Microsoft Excel 2016, version 1811.
RESULTS
No adverse events attributable to the radiotracer were observed during the trial. The procedural protocol was rigorously followed for each subject’s scan session. The mean interval between scans was 5.8 ± 3.9 d (range, 2–14 d; median, 5.5 d; mode, 2 d) and was 7 d or less in 14 subjects. There was no significant difference in mean uptake time or injected activity between scan 1 and scan 2. Uptake time ranged from 60 to 63 min for scan 1 (mean, 60.6 ± 1.1 min; 95% CI, 60.1–61.1) and was 60–64 min for scan 2 (mean, 60.7 ± 1.2 min; 95% CI, 60.1–61.2), with a P value of 0.9. Injected activity ranged from 121.7 to 145.4 MBq for scan 1 (mean, 133.1 ± 7.1 MBq; 95% CI, 129.9–136.4) and was 121.4–146.2 MBq for scan 2 (mean, 133.1 ± 6.5 MBq; 95% CI, 130.2–136.0), with a P value of 1.0.
Of 18 enrolled subjects, 16 showed radiotracer-avid disease. In total, 136 lesions were identified and measured. The most common lesions were in the bones (72%, n = 99/136), followed by lymph nodes (20%, n = 27/136), prostate or prostate bed (5%, n = 7/136), and viscera (2%, n = 3/136, all from the same subject). The spectrum of lesions in any given subject varied from none to innumerable. Radiotracer-avid lymph nodes were present in only 6 subjects, and most of these lesions were collected from a single subject with predominantly soft-tissue disease (Fig. 2). Because the VOIs were cross-checked between readers to ensure segmentation of the same lesions, interobserver variability was not formally analyzed.
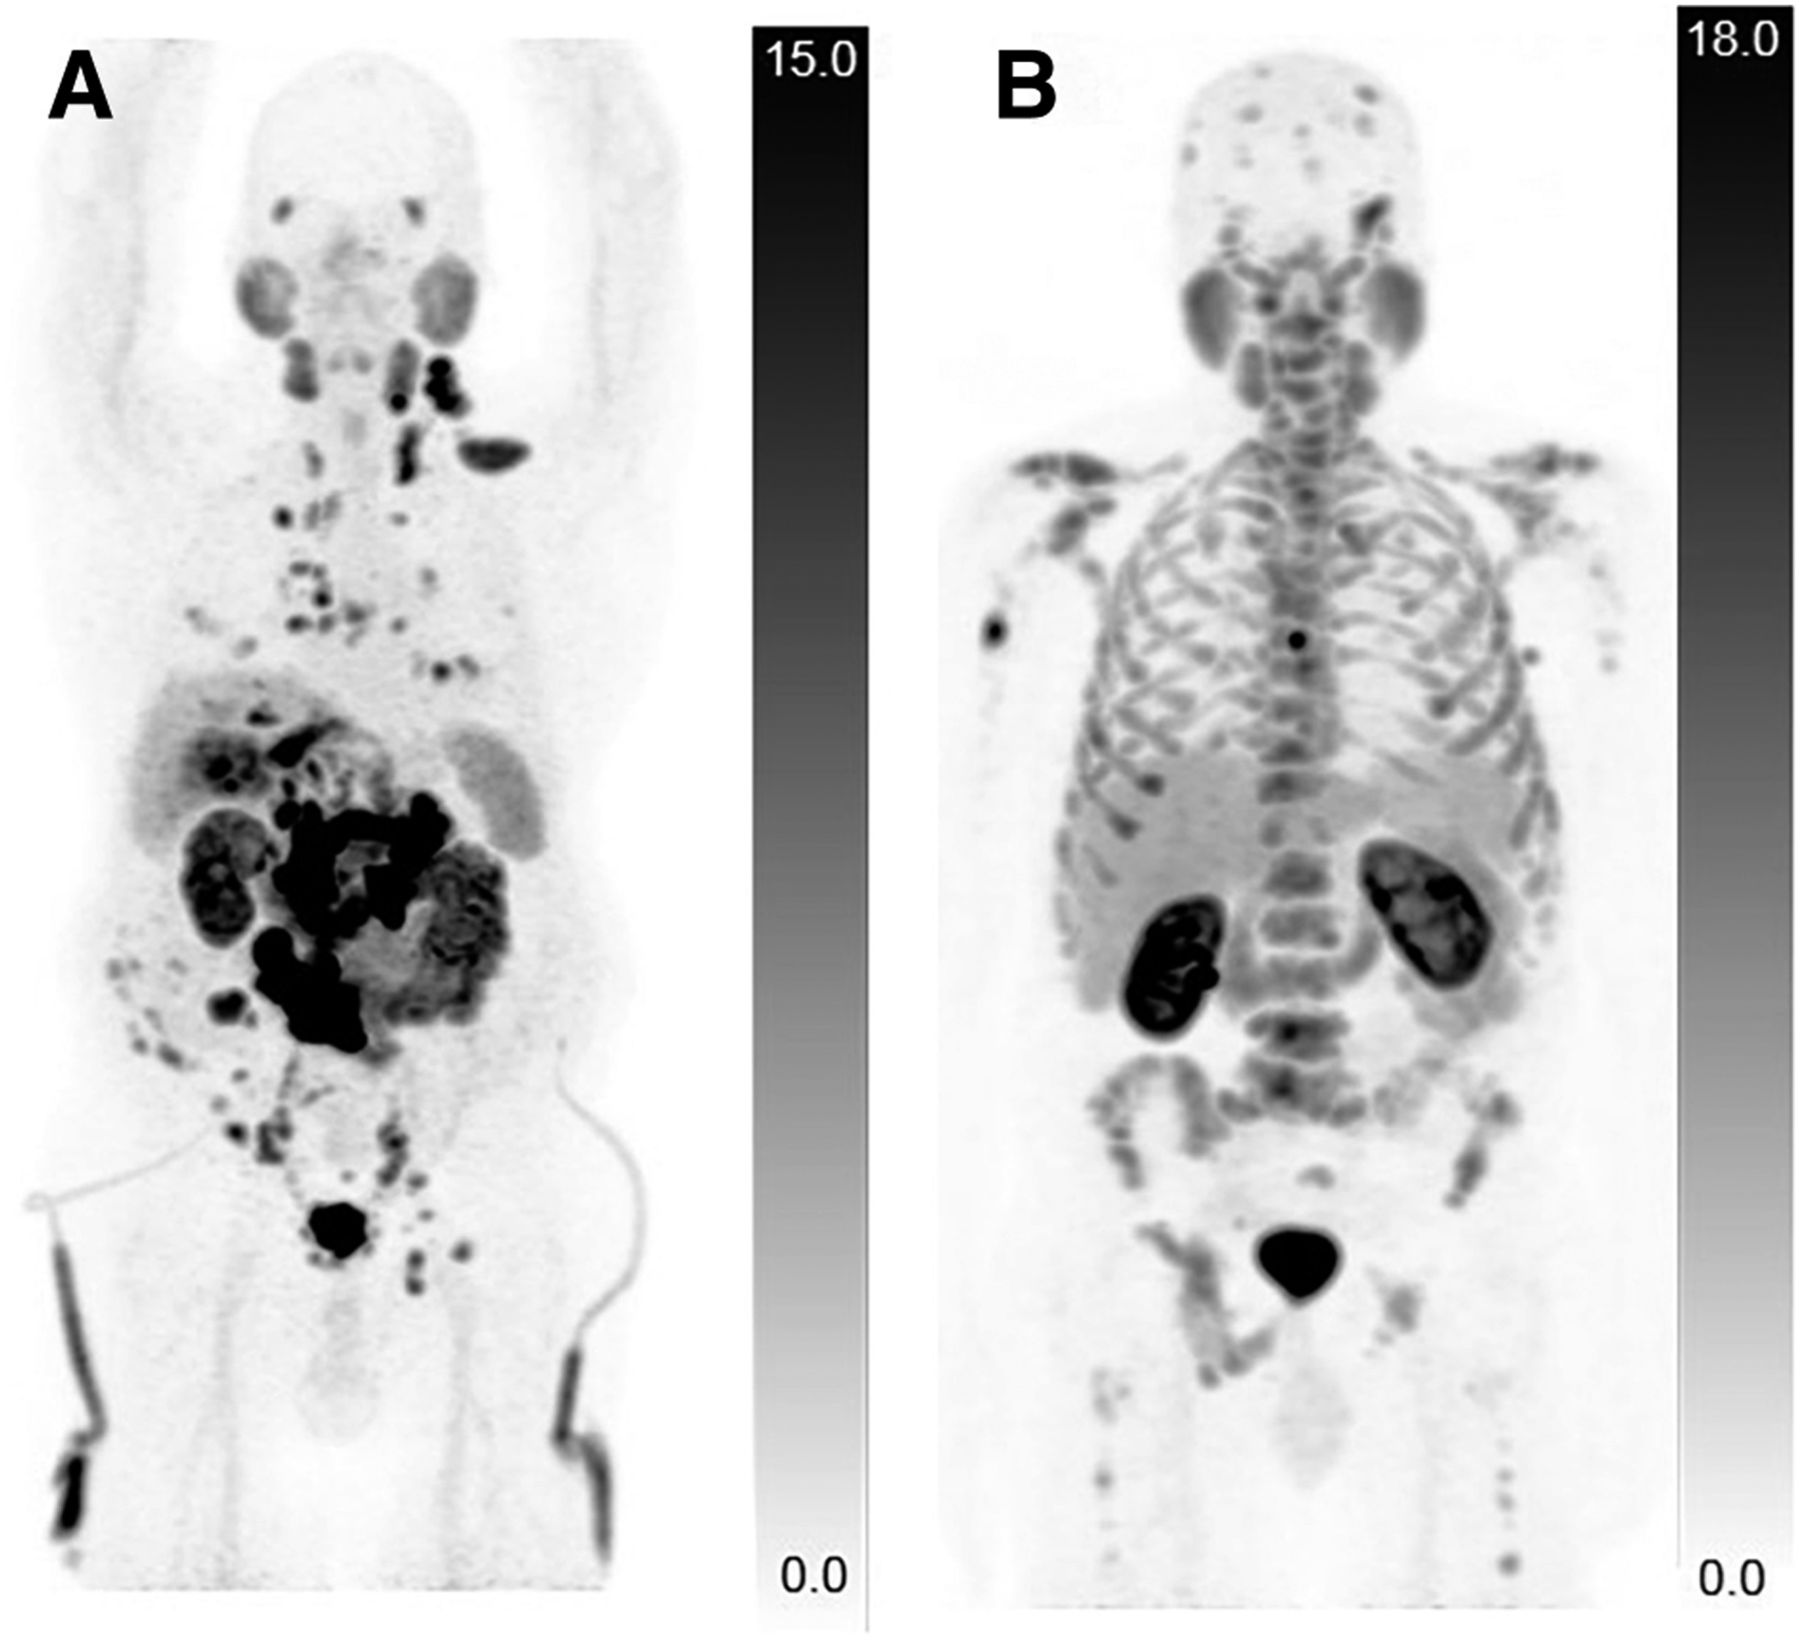
68Ga-PSMA-HBED-CC CC PET/CT for 2 subjects demonstrating different distribution of metastatic lesions. (A) Predominantly soft-tissue metastatic prostate cancer is seen with visceral metastases in lungs and liver and nodal metastases in neck, chest, abdomen, and pelvis. Percutaneous nephrostomy tubing is also visible. (B) Extensive metastatic prostate cancer is seen involving only skeleton.
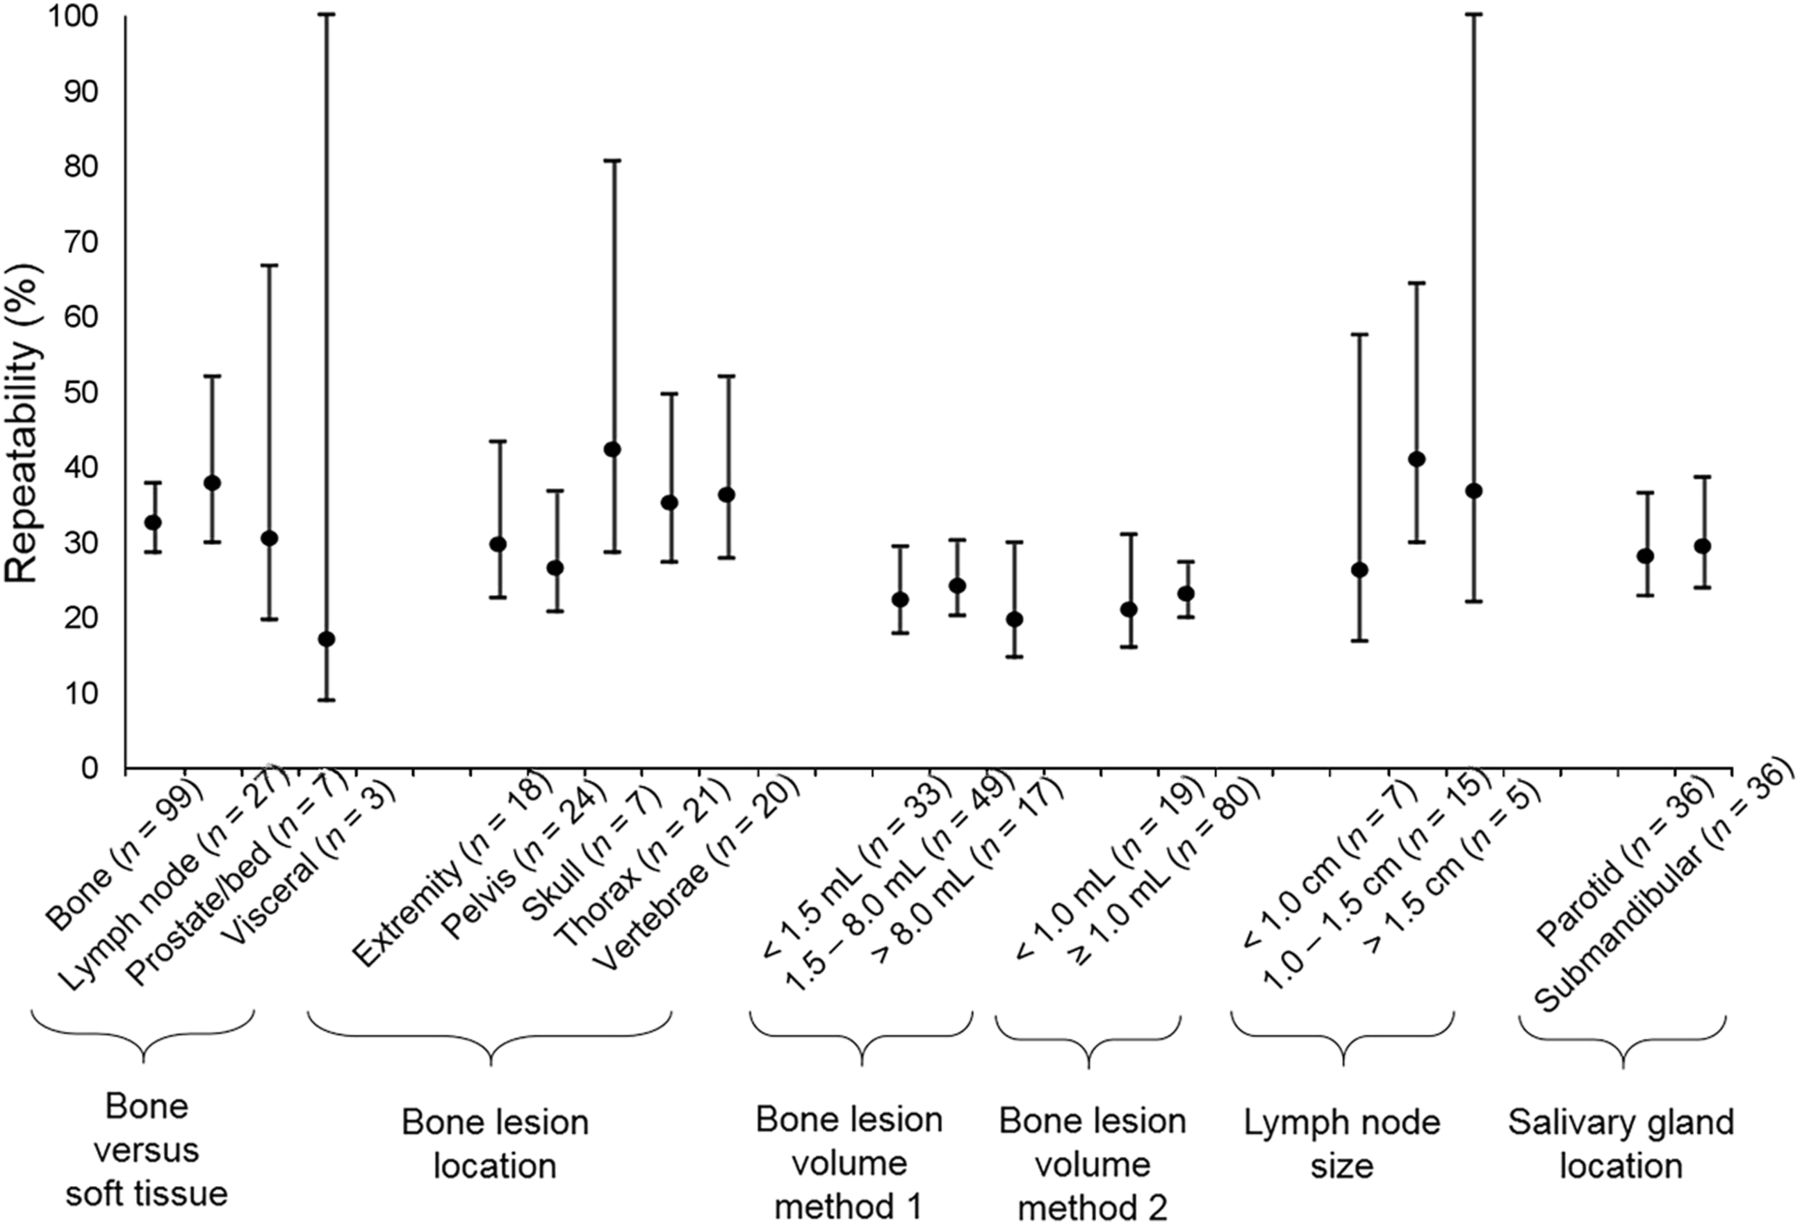
Linear regression demonstrated SUV measurements to have an excellent correlation between scans (Fig. 3). The wCV, symmetric and asymmetric RC, and 95% CIs for lesions and organs are summarized in Tables 2 and 3. Bone lesions overall showed a wCV of 12% and asymmetric limits of −28 and +39% for RC. Lymph node lesions overall showed a wCV of 14% and asymmetric limits of −32% and +47% for RC. No significant differences in repeatability were noted on the basis of tissue type (soft-tissue vs. bone), bone lesion location, bone lesion volume, lymph node size, salivary gland location (parotid vs. submandibular), or prostate-specific membrane antigen level (Fig. 4). No significant differences were noted in repeatability on the basis of the type of scanner used; this result is consistent with in-house phantom studies that found scanner model–based repeatability contributions to be similar between scanners and to be small compared with our measured wCV. Repeatability stratified by scanner type is presented in Supplemental Tables 2 and 3.
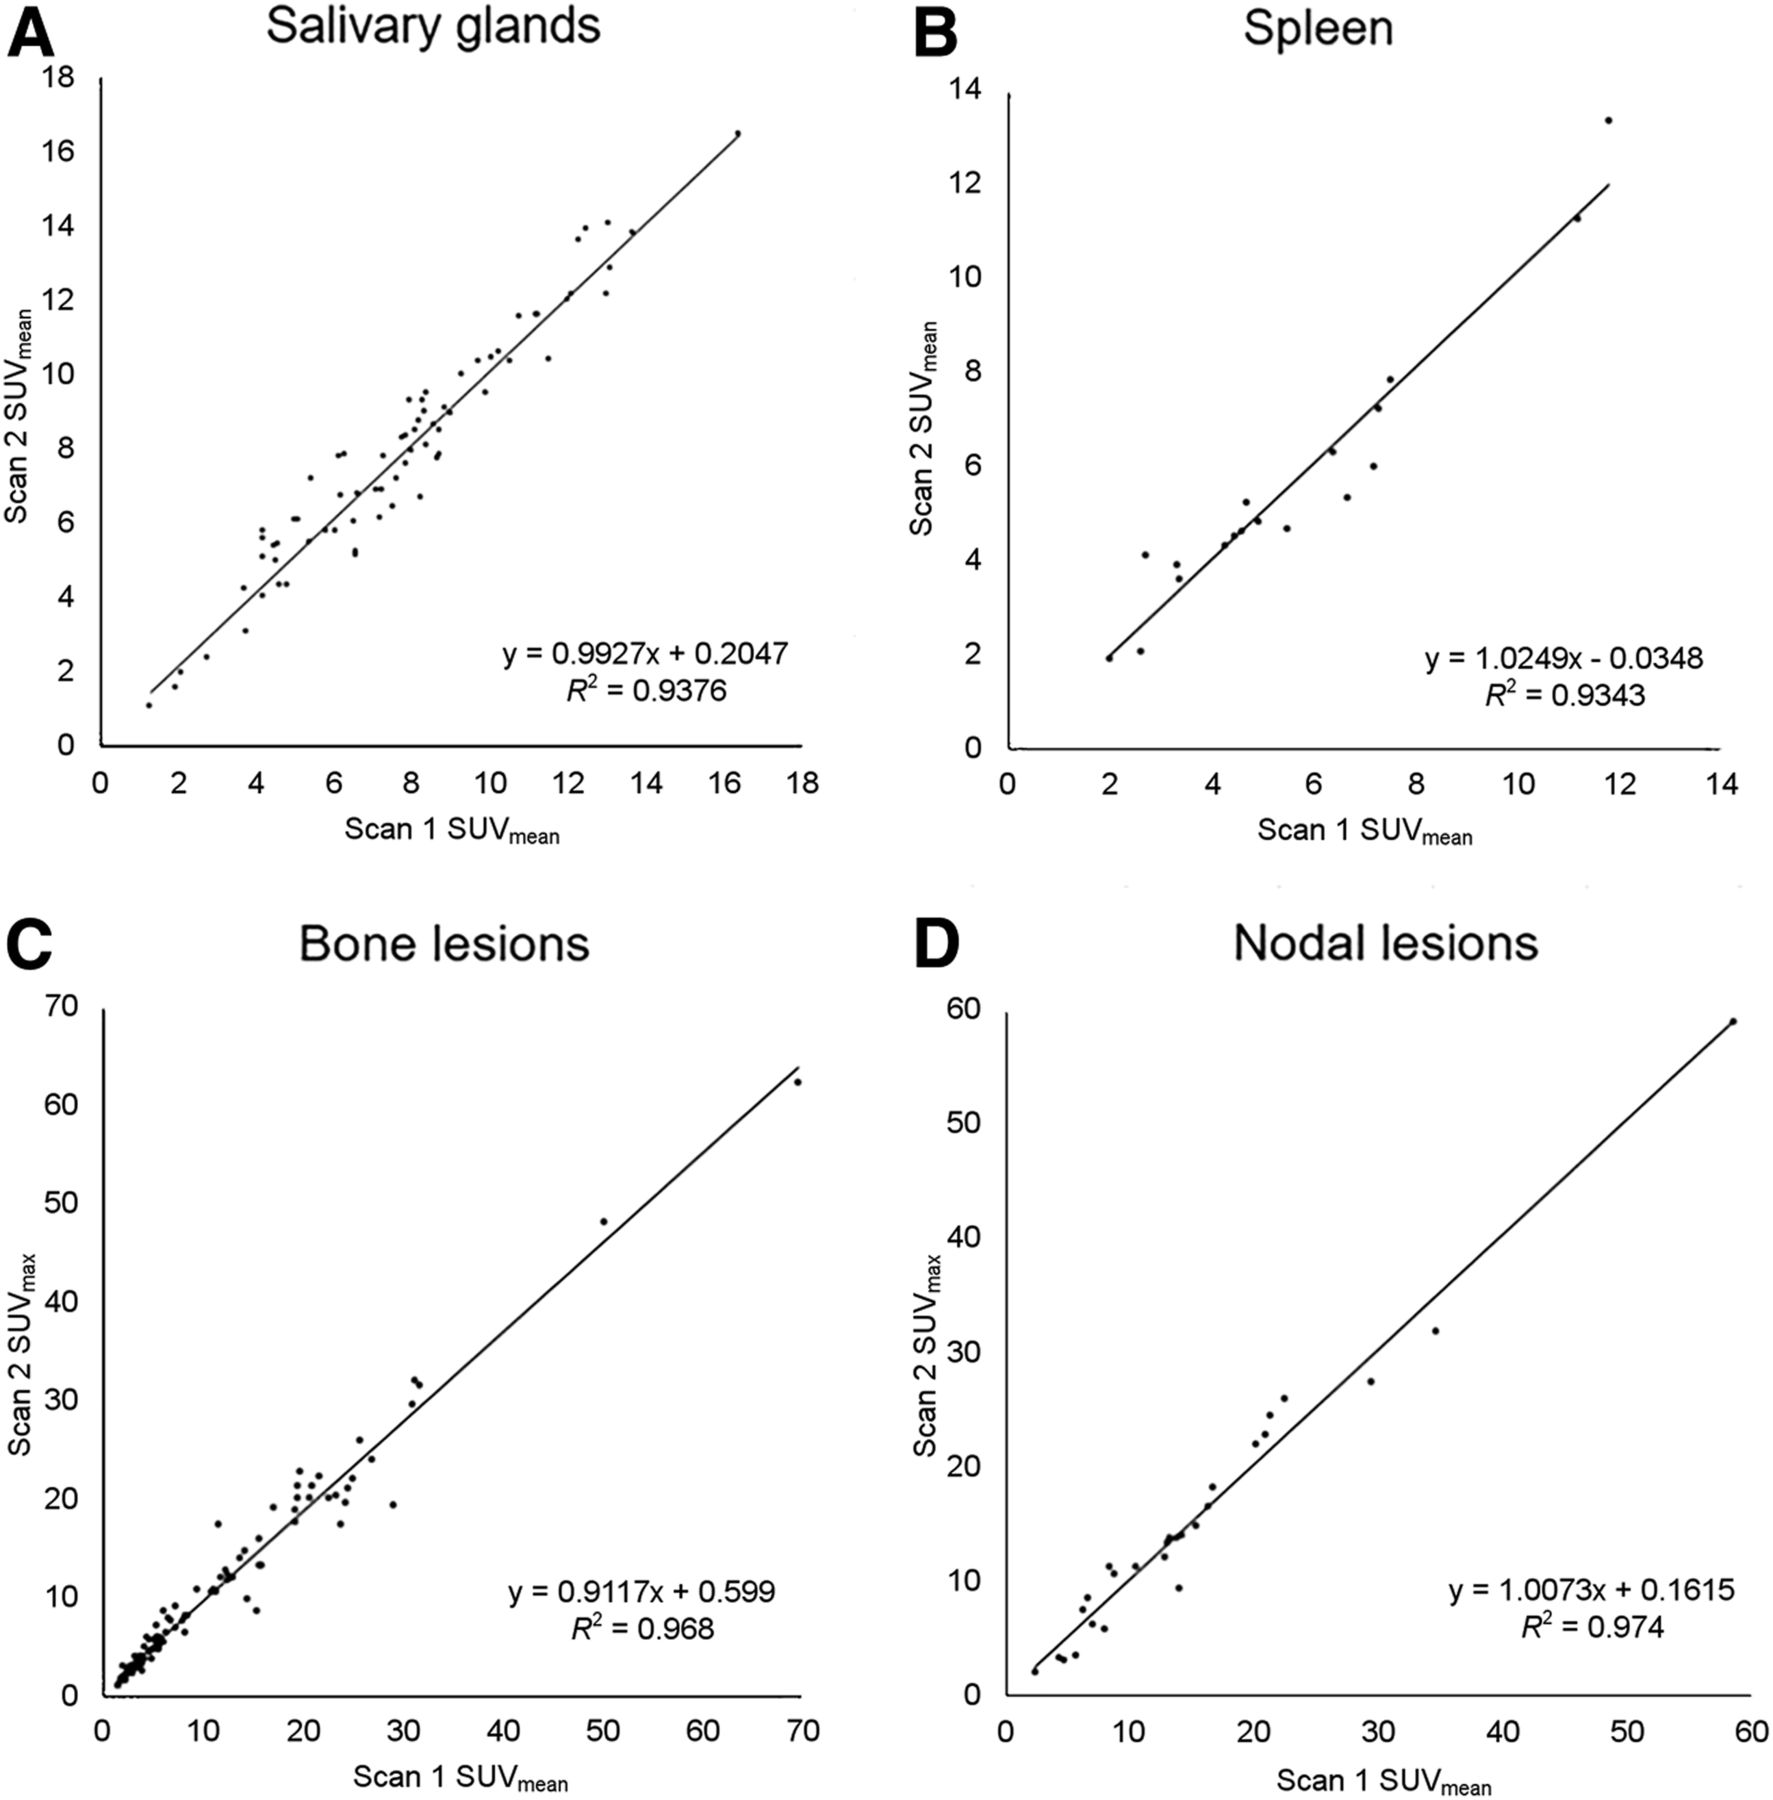
Correlation between test–retest measures of 68Ga-PSMA-HBED-CC uptake. Plots show SUVmean of normal salivary glands and spleen (A and B) and SUVmax for bone and nodal lesions (C and D).
Repeatability Data (SUVmax)
Repeatability Data (SUVmean)

Comparison of SUV RC point estimates; 95% CIs (y-axis) show substantial overlap, indicating no significant difference in repeatability for different categories of measurements (x-axis).
Bland–Altman plots (Fig. 5) did not suggest an association between test–retest relative percentage SUV differences and SUV intensity for any measured sites, indicating that the repeatability would be equally reliable for tumors across a wide range of SUVs. This finding was confirmed by Kendall τ-coefficient analysis (τ and P values are reported in Fig. 5), which showed no statistically significant association.
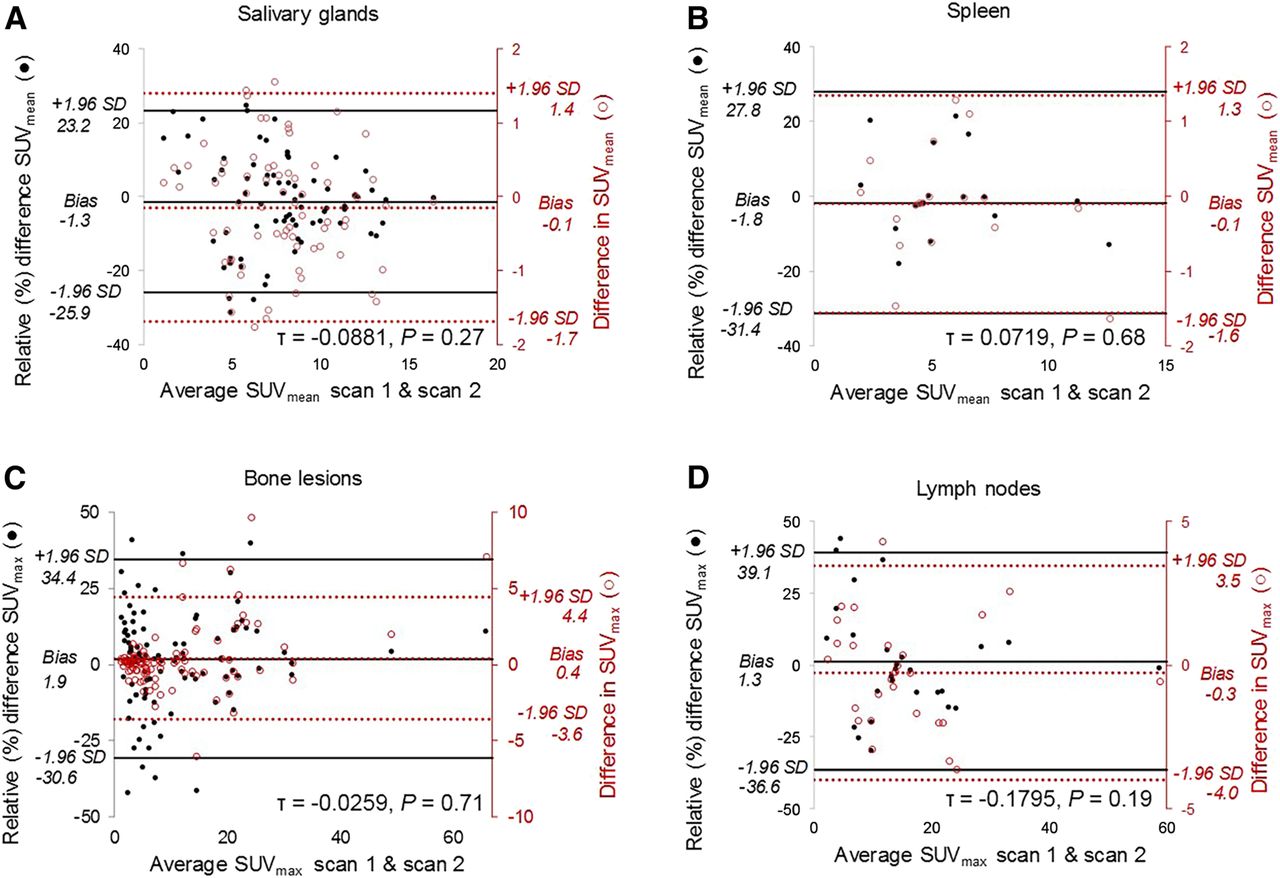
Bland–Altman scatterplots show difference between test–retest SUV measurements and average lesion or organ intensity. Plots suggest no association between mean lesion or organ intensity (x-axis) and test–retest relative percentage differences (primary y-axis) based on Kendall τ analysis. Both relative percentage difference (●, primary vertical axis) and absolute difference (○, right vertical axis) are plotted together for salivary glands (A), spleen (B), bone lesions (C), and lymph nodes (D). Horizontal lines represent upper limits of agreement (+1.96 SD), lower limits of agreement (−1.96 SD), and bias (or mean difference). Kendall τ coefficient and P values were calculated for relative percentage difference data and are included in field of graphs.
DISCUSSION
In this prospective test–retest study, we determined repeatability for 68Ga-PSMA-HBED-CC PET/CT both for tumor lesions and for normal organs (salivary glands and spleen). The repeatability estimates from this study are similar to those reported for 18F-FDG, suggesting that 68Ga-PSMA-HBED-CC may be similarly useful as a quantitative imaging biomarker (10).
Given the similarities in biodistribution of the small-molecule urea-based PSMA-targeting radiotracers, our repeatability data for 68Ga-PSMA-HBED-CC may also be applicable to 18F-DCFPyL (2-(3-{1-carboxy-5-[(6-18F-fluoro-pyridine-3-carbonyl)-amino]-pentyl}-ureido)-pentanedioic acid) (11). Sahakyan et al. have reported intrasubject repeatability for 18F-DCFPyL in normal organs, but with the limitations of 6-mo intervals and with some patients receiving therapy between scans (12,13). Differences in statistical methodologies also make comparison of results with this work problematic.
In this study, we followed a design and statistical methodology described in the literature for 18F-FDG and other PET radiotracers (1,2,4,5,14). The performance profile and utility of quantitative 18F-FDG PET for assessment of therapy response for multiple types of tumors are well established, with reported wCVs of 10%–12% and RCs of 10%–40% (5–7,10,15–18). Lodge reviewed the repeatability literature for 18F-FDG and, after reconciling differences in statistical methodology across multiple studies, inferred an average wCV of 10% across all SUV measures (SUVmax, SUVmean, and SUVpeak); specifically for SUVmax, the range of inferred wCVs was 5%–18% (4). As far as the significance of a change for an individual lesion is concerned, the RC, also known as the limits of true change, is more apt. Lodge estimated an RC of ±28%, meaning that a lesion that drops in SUV by 28% is likely to represent a true change rather than normal variability. Taking into account repeatability and reproducibility data for 18F-FDG, PERCIST 1.0 proposed a ±30% change in SUV for the threshold of change beyond which a tumor can be said to have responded or progressed (4,15,19).
Repeatability has also been reported, though not as thoroughly, for other PET radiotracers. Kenny et al. estimated a wCV of 9% for 11C-choline in breast cancer (20). Lin et al. estimated a wCV of 12% and 14% at the subject level and lesion level, respectively, for 18F-NaF in prostate cancer (21). Menda et al. determined that a ±25% change in SUVmax for neuroendocrine tumors imaged with 68Ga-DOTATOC indicated a true change greater than the measurement error (22). Kramer et al. performed a metaanalysis and estimated a pooled RC of ±25% for solid tumors imaged with 3′-deoxy-3′-18F-fluorothymidine (23).
Variability in PET/CT can arise from a variety of tumor-related, patient-related, and external sources. Evolving tumor biology (growth or regression) and medication-induced changes were minimized in this study through a design that included short scanning intervals and exclusion of subjects receiving therapy between scans or starting prostate cancer therapy within 3 mo of enrollment. Although our subjects were nonfasting as per published guidelines for 68Ga-PSMA PET/CT, we note that Wondergem et al. reported a 13% reduction in uptake of 18F-DCFPyL in the submandibular glands in a cohort of fasting patients as compared with nonfasting patients. They conclude that the effects of fasting are likely negligible in the diagnostic setting but may need to be investigated further, especially in the setting of pretherapy dosimetry, given the impact of PSMA-targeting agents on the salivary glands (24,25). No diuretics were used in our study, minimizing any effects of hydration status on uptake variability. Strict attention to timing and scanning parameters minimized variability related to technical factors. Lesion segmentation was a source of variability, as it relied in part on manual contouring. Interobserver variability, although not formally calculated, was probably a source of error when SUVmean was used, because of the manual involvement of each reader in defining the VOI. However, this was not a source of error when SUVmax was used, because the highest SUV pixel within a VOI is identical regardless of the size of the VOI.
We hypothesized that lesion size would influence repeatability; however, there appeared to be no significant influence based on bone lesion size. The reliability of this finding is uncertain, as only 17 bone lesions larger than 8.0 cm3 were evaluated, compared with 82 bone lesions 8.0 cm3 or smaller. Similarly, for nodal lesions there was no influence on repeatability based on size; however, only 5 nodal lesions larger than 1.5 cm were measured, compared with 22 nodal lesions 1.5 cm or smaller. Frings et al. reported better repeatability (less variability) for larger lesions (>4.2 cm3 vs. ≤ 4.2 cm3) for 18F-FDG and 18F-fluorothymidine in non–small cell lung cancer, which they attributed to a difference in partial-volume effects (26).
Our study has limitations. Because our scans were performed with the utmost care in patient preparation and scanning parameters, the repeatability estimates derived from our data may be less generalizable to the normal workaday clinic. The interval between the 2 scans was 7 d or less for most subjects, assuming tumors would be essentially unchanged in volume during this time. Although a shorter maximal timeframe would be preferable in all subjects to ensure tumor stability, this was not practicable because of the radiotracer production timetable at our facility and the relatively rural setting, with long travel distances for subjects. Whether our repeatability estimates for 68Ga-PSMA-HBED-CC are generalizable to other PSMA-targeting radiotracers such as 18F-DCFPyL is uncertain but is plausible, given their similarities in biodistribution. Another limitation is that our data derive from a group of patients with an inhomogeneous distribution of metastases. That is, patients with a heavy disease burden contributed more lesions to the analysis than did patients with few lesions.
CONCLUSION
This study evaluated the repeatability of 68Ga-PSMA-HBED-CC PET/CT in a prospective test–retest design. The wCV for bone and nodal lesions ranged from 12% to 14% SUVmax. The RC was approximately ±33% SUVmax (asymmetric limits, −28% and +39%) for bone lesions and ±38% SUVmax (asymmetric limits, −32% and +47%) for nodal lesions. This means that in a potential treatment response setting, SUV changes of a magnitude greater than the RC would indicate with 95% confidence that a true change in tumor uptake has occurred rather than measurement error. These findings are similar to those reported for 18F-FDG, suggesting that 68Ga-PSMA-HBED-CC may be suitable for monitoring the response to therapy and developing meaningful organ dose estimates in patients with prostate cancer.
DISCLOSURE
Janet Pollard is an investigator for Progenics and Endocyte (Advanced Accelerator Applications/Novartis). No other potential conflict of interest relevant to this article was reported.
KEY POINTS
QUESTION: What is the estimated repeatability of SUV measures on 68Ga-PSMA HBED-CC PET/CT in patients with metastatic prostate cancer?
PERTINENT FINDINGS: This prospective test–retest study evaluated the repeatability of SUV metrics in metastatic lesions and select normal organs. In bone and nodal lesions, we found a wCV of 12%–14% SUVmax and an RC of ±33%–38% SUVmax.
IMPLICATIONS FOR PATIENT CARE: This study is an essential step in the development of 68Ga PSMA HBED-CC PET/CT as a quantitative imaging biomarker and suggests that this radiotracer may be useful for monitoring response to treatment.
Footnotes
Published online Dec. 5, 2019.
- © 2020 by the Society of Nuclear Medicine and Molecular Imaging.
REFERENCES
- Received for publication September 24, 2019.
- Accepted for publication November 21, 2019.


Jump to section
Related Articles
Cited By...
- No citing articles found.