


Article Figures & Data
Figures
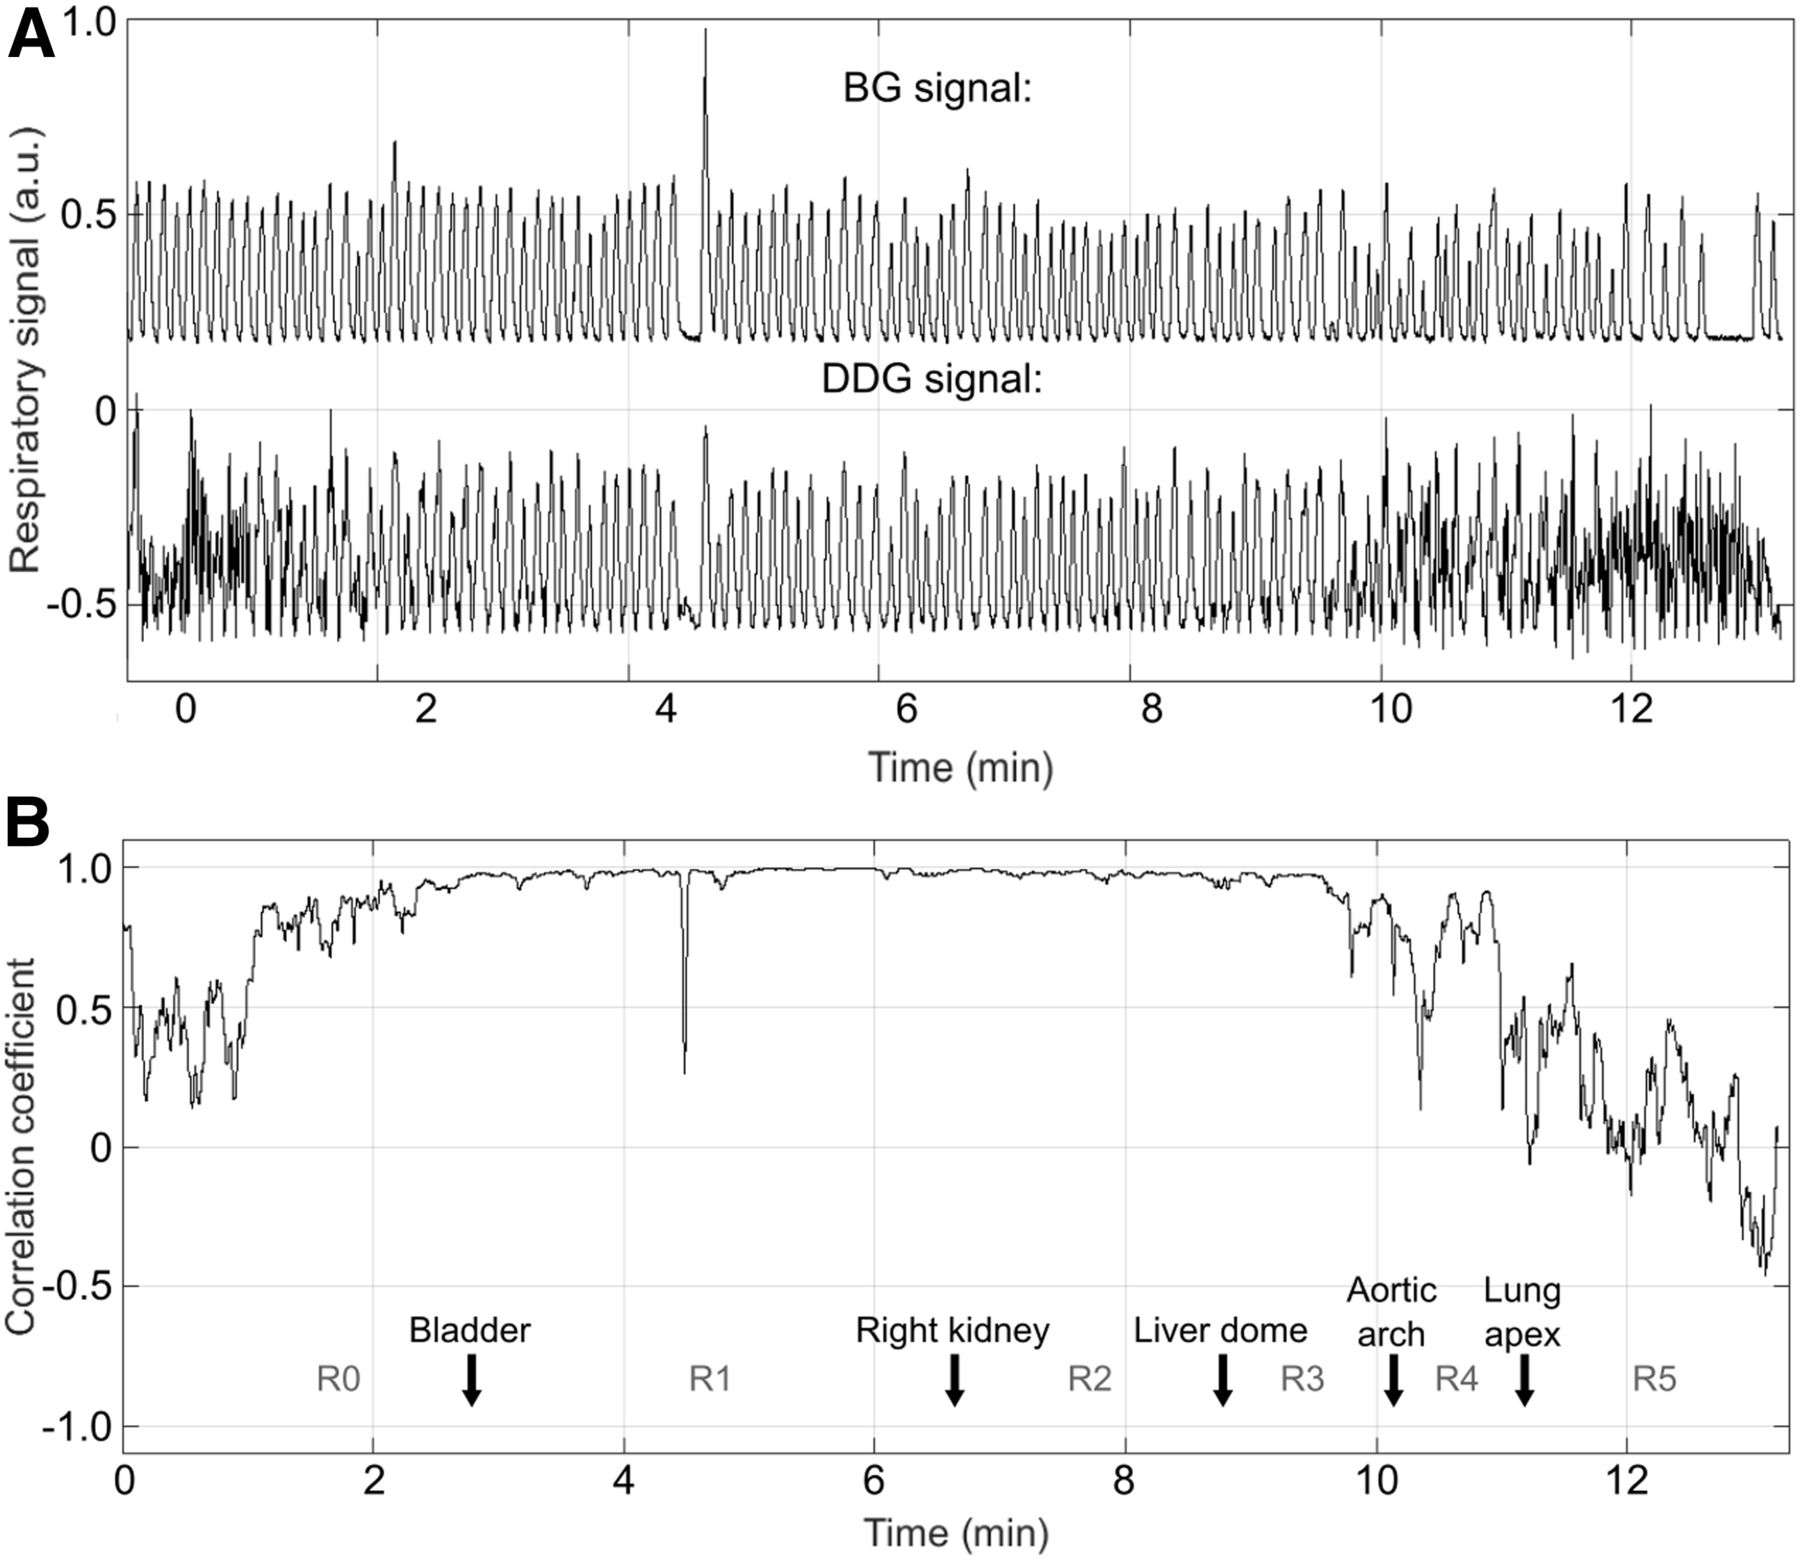
- FIGURE 1.
Comparison of respiratory signals (A) and local correlation coefficients (B) for typical case (landmarks passing scanner center are indicated by arrows). a.u. = arbitrary units.
- FIGURE 2.
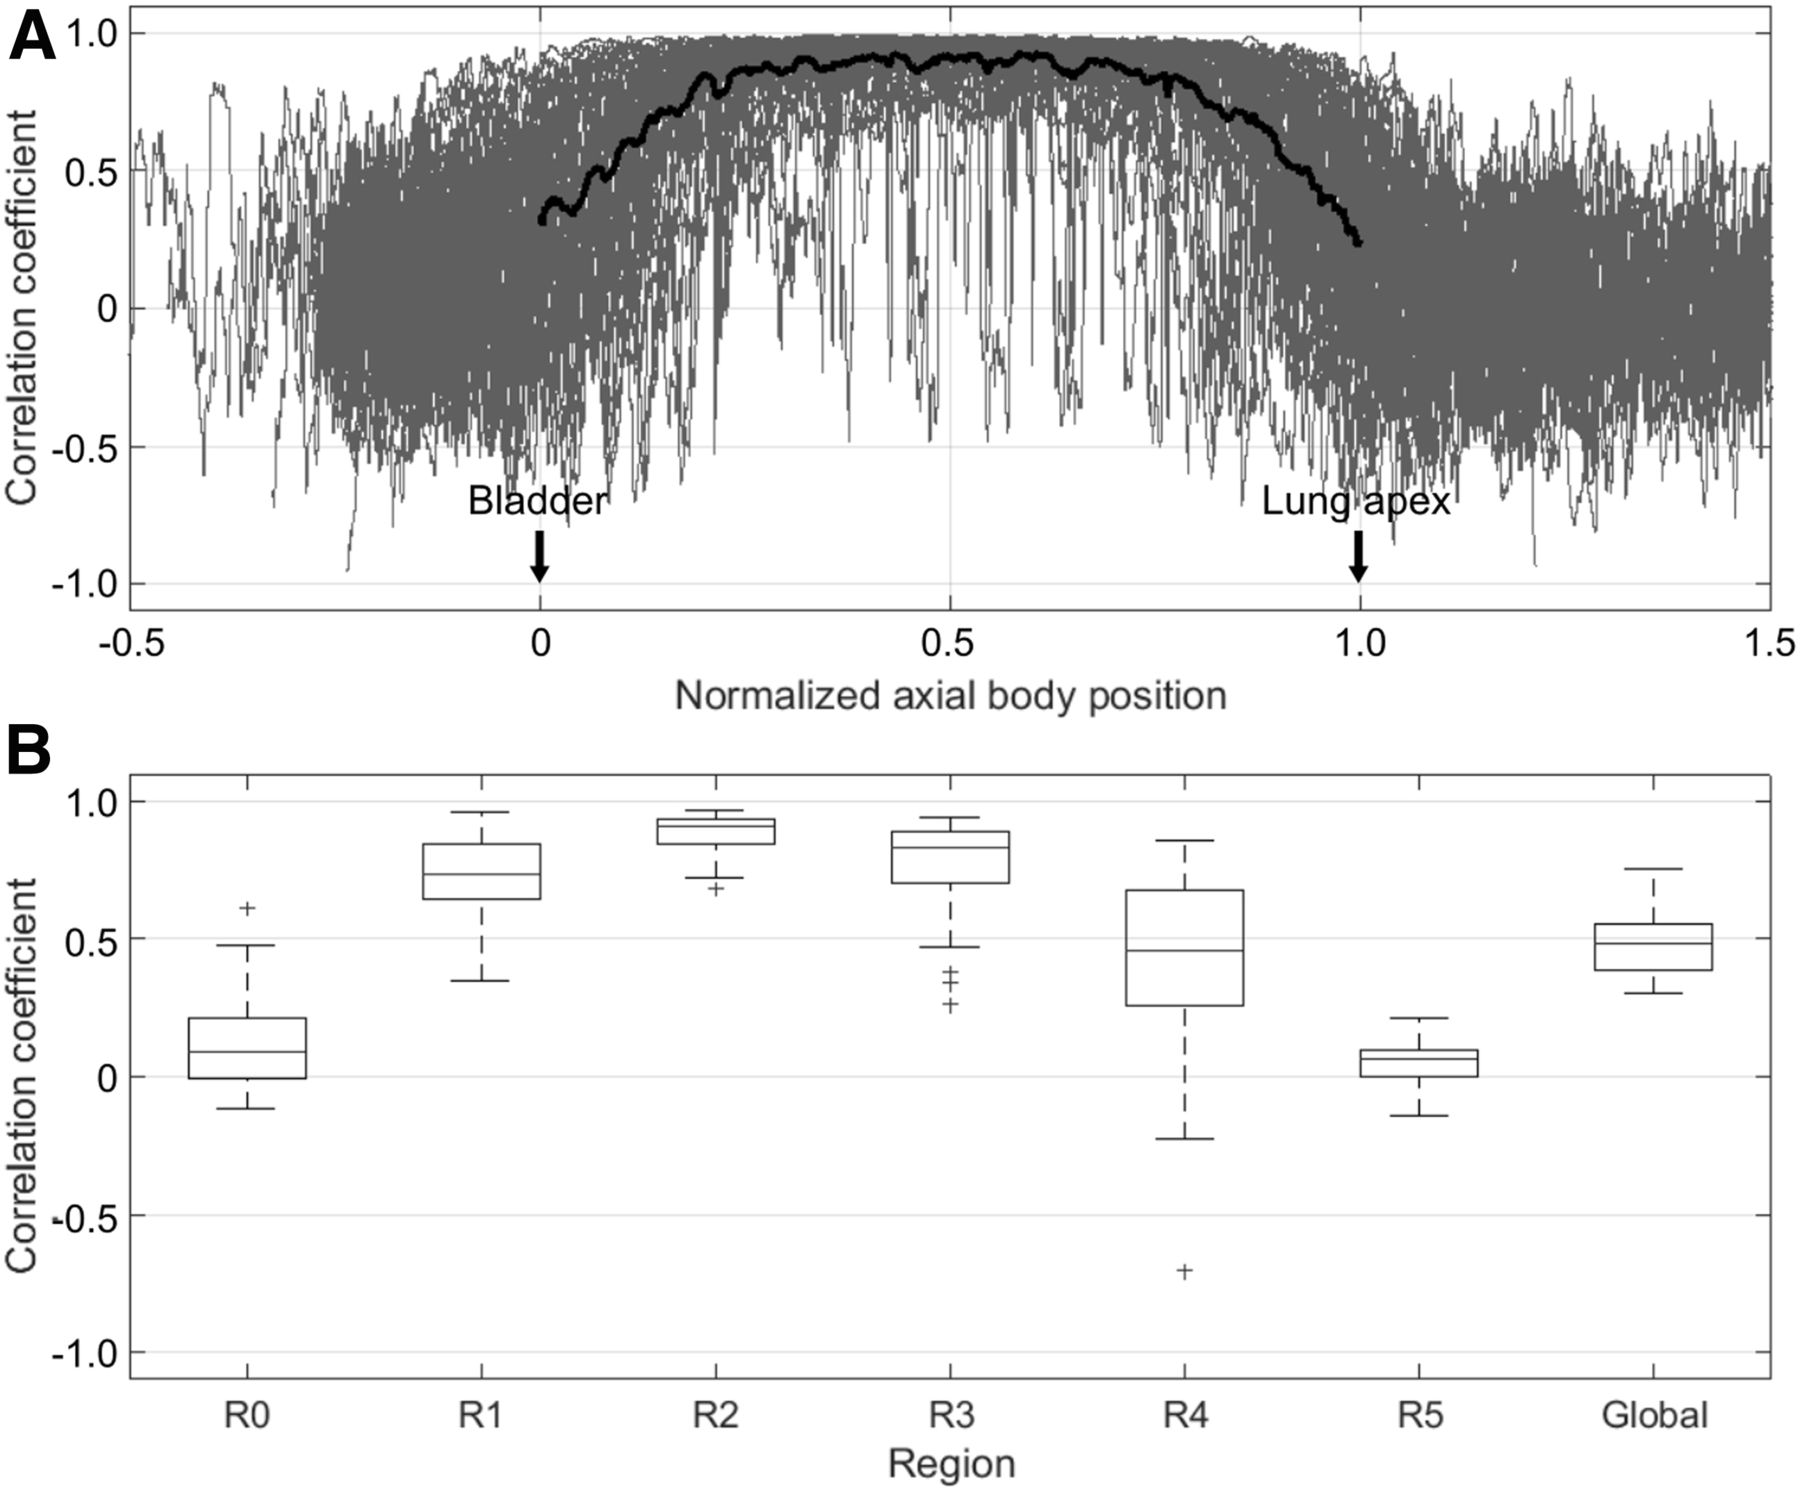
(A) Superposition of local correlation coefficients (gray) for all scans in normalized axial position. Average is indicated by black line. (B) Box plot of regional correlation coefficients for all scans. Asterisks denote outliers.
- FIGURE 3.
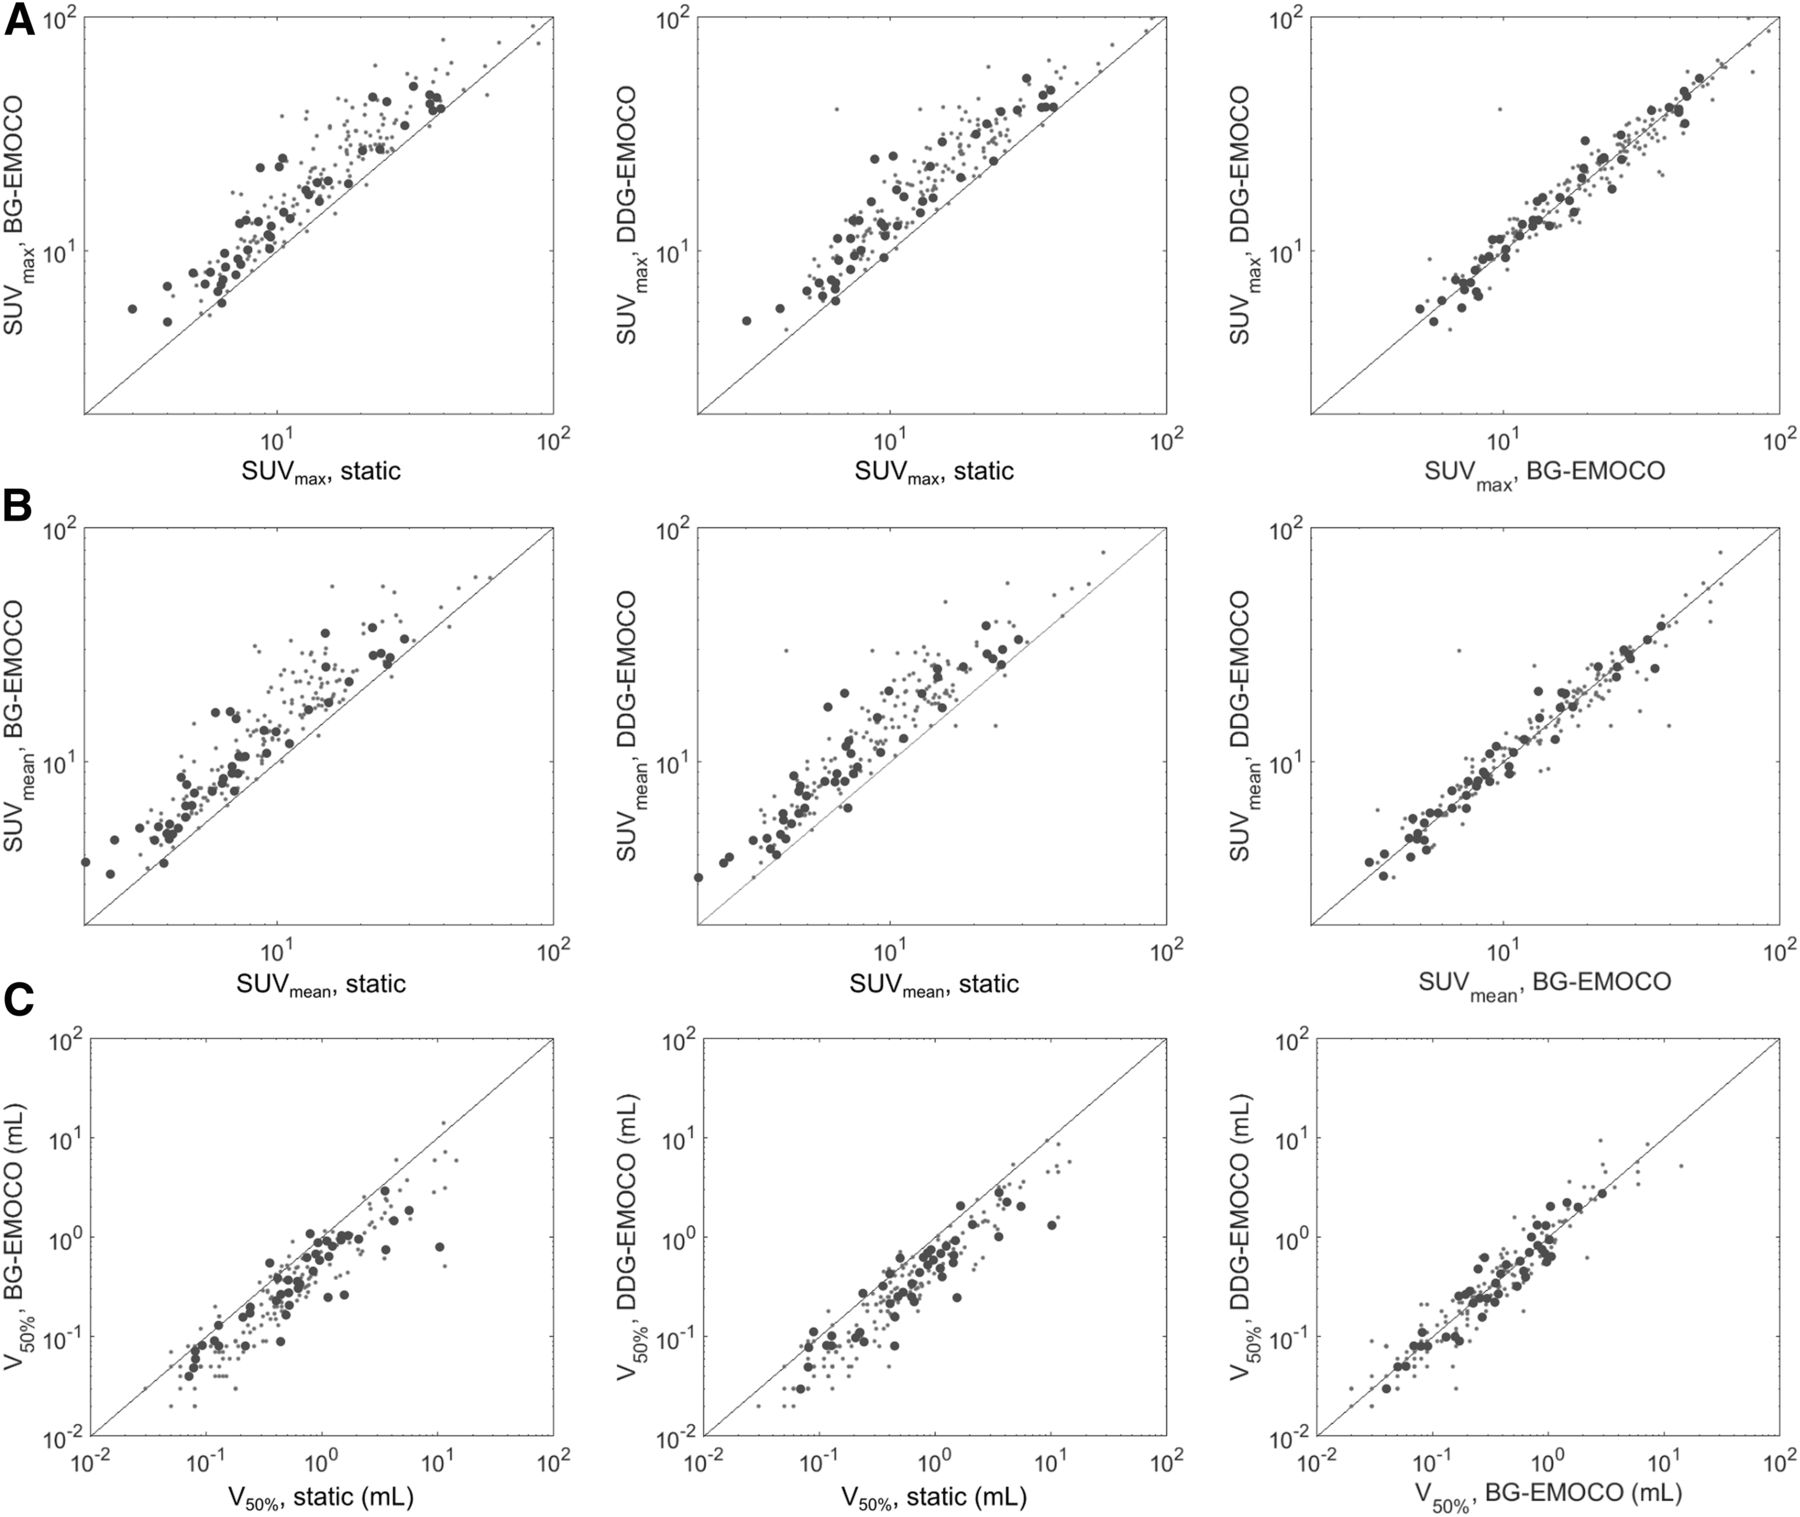
Scatterplots of SUVmax (A), SUVmean (B), and V50% (C) for static, BG-EMOCO, and DDG-EMOCO reconstructions. Subgroup of 1 lesion per scan is denoted by big dots; black line is line of identity.
- FIGURE 4.
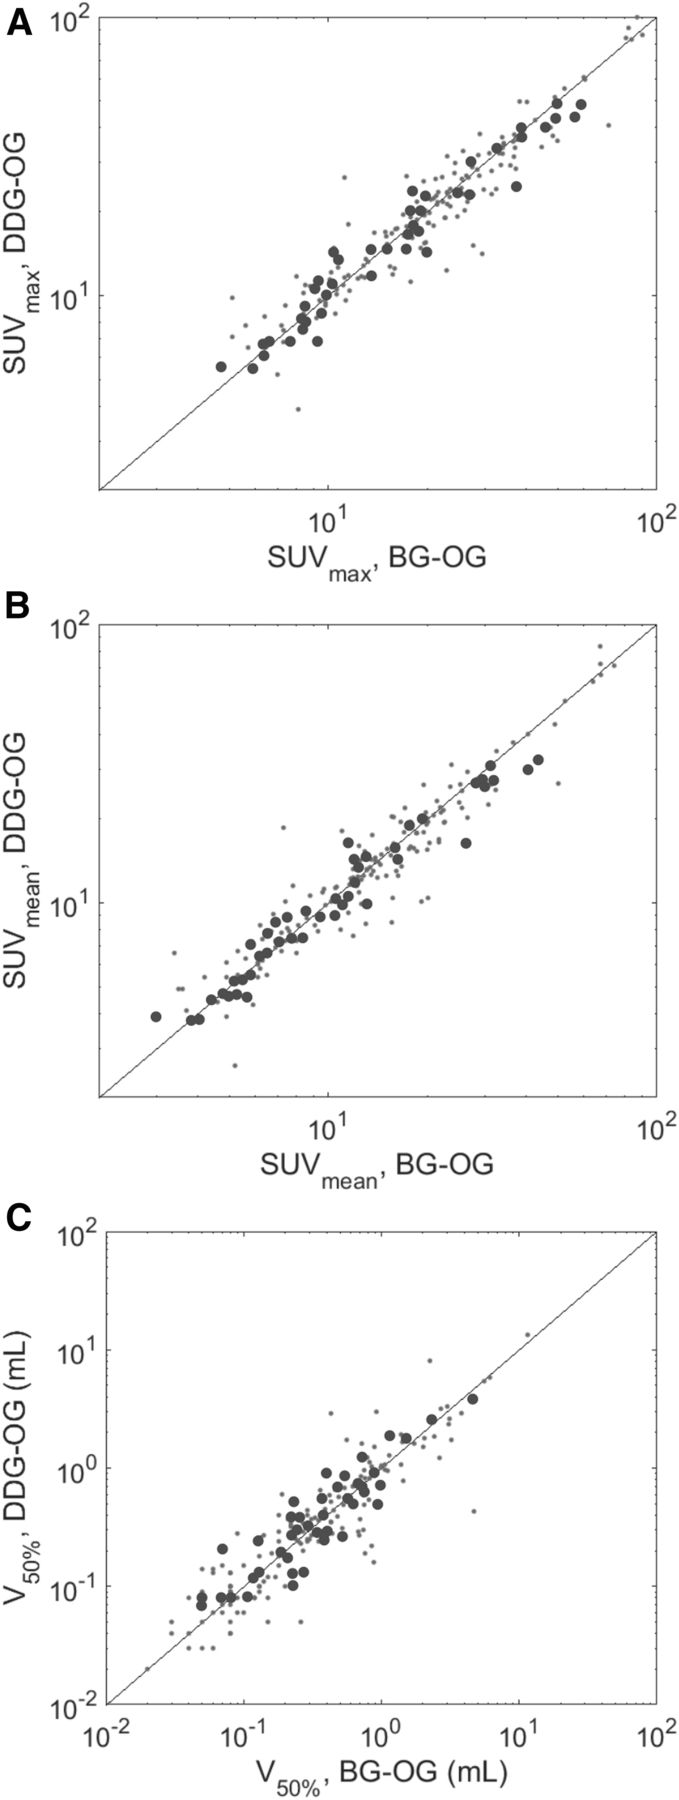
Scatterplots of SUVmax (A), SUVmean (B), and V50% (C) for BG-OG, and DDG-OG reconstructions. Subgroup of 1 lesion per scan is denoted by big dots; black line is line of identity.
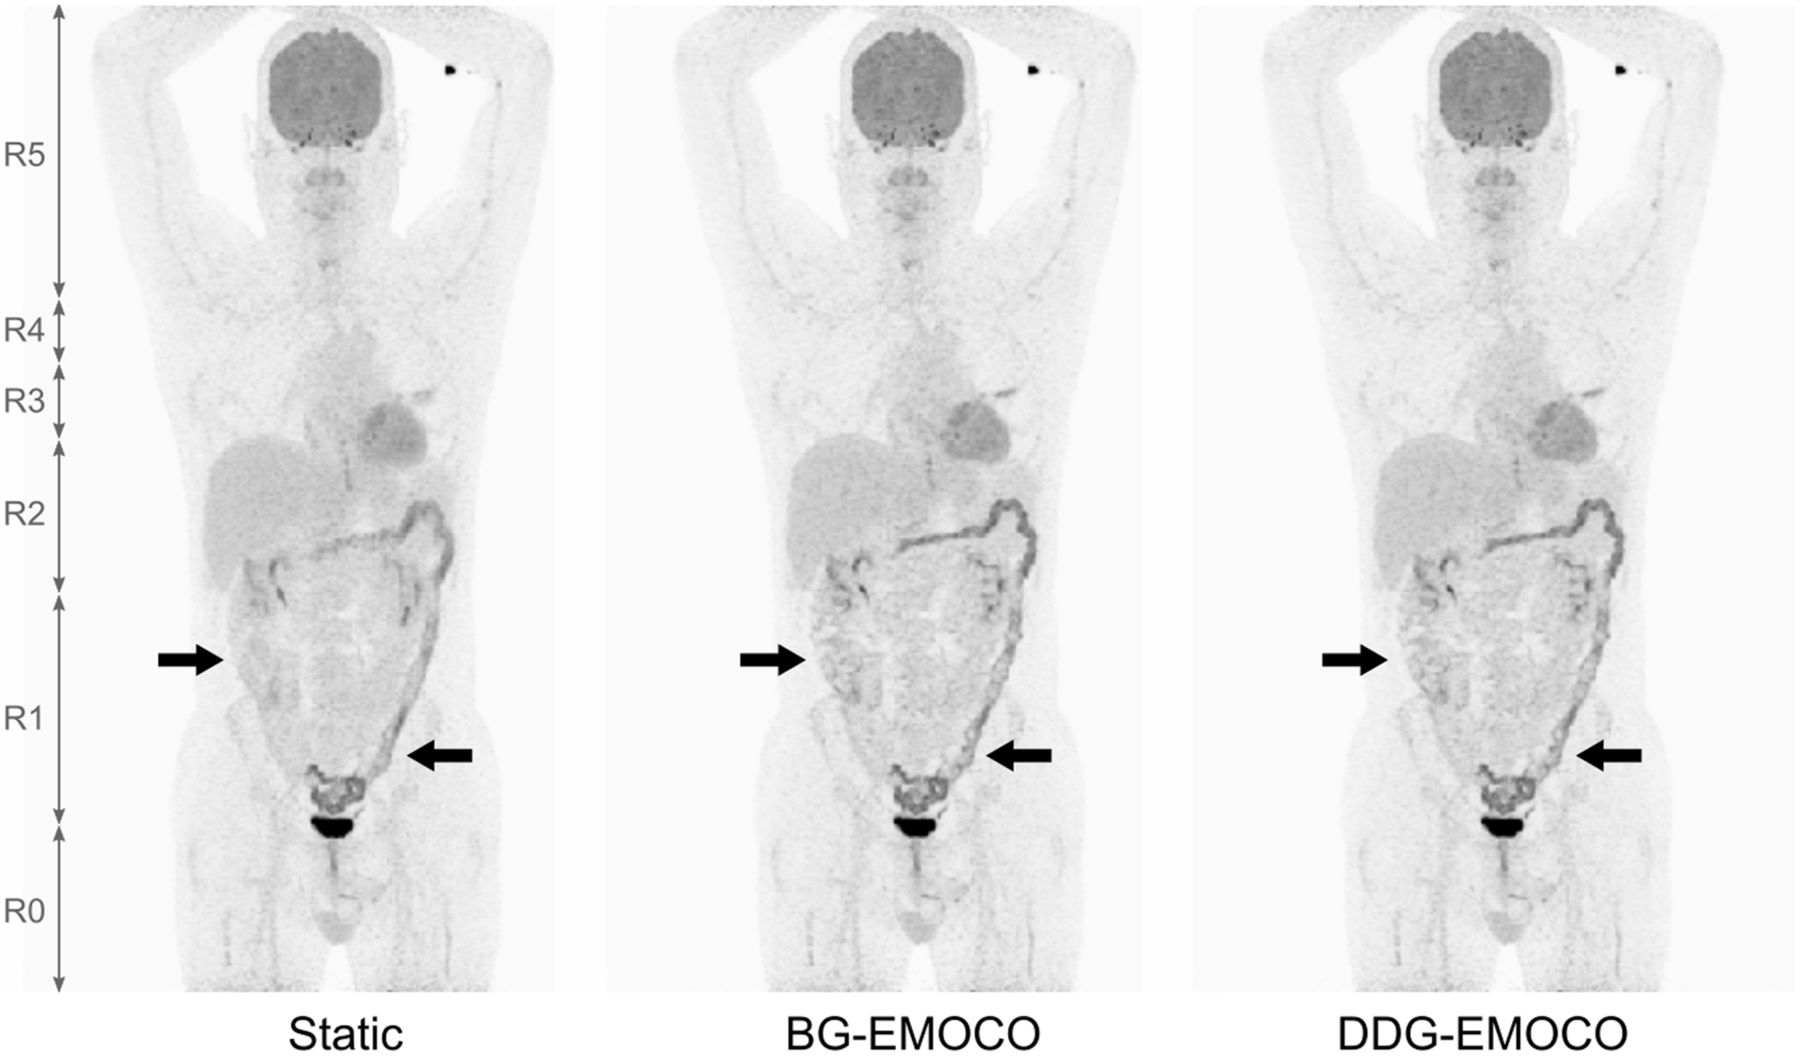
- FIGURE 5.
Typical outcome of OG and EMOCO using BG and DDG signals, compared with static reconstruction. Visual improvements of liver lesions (arrows) are apparent.
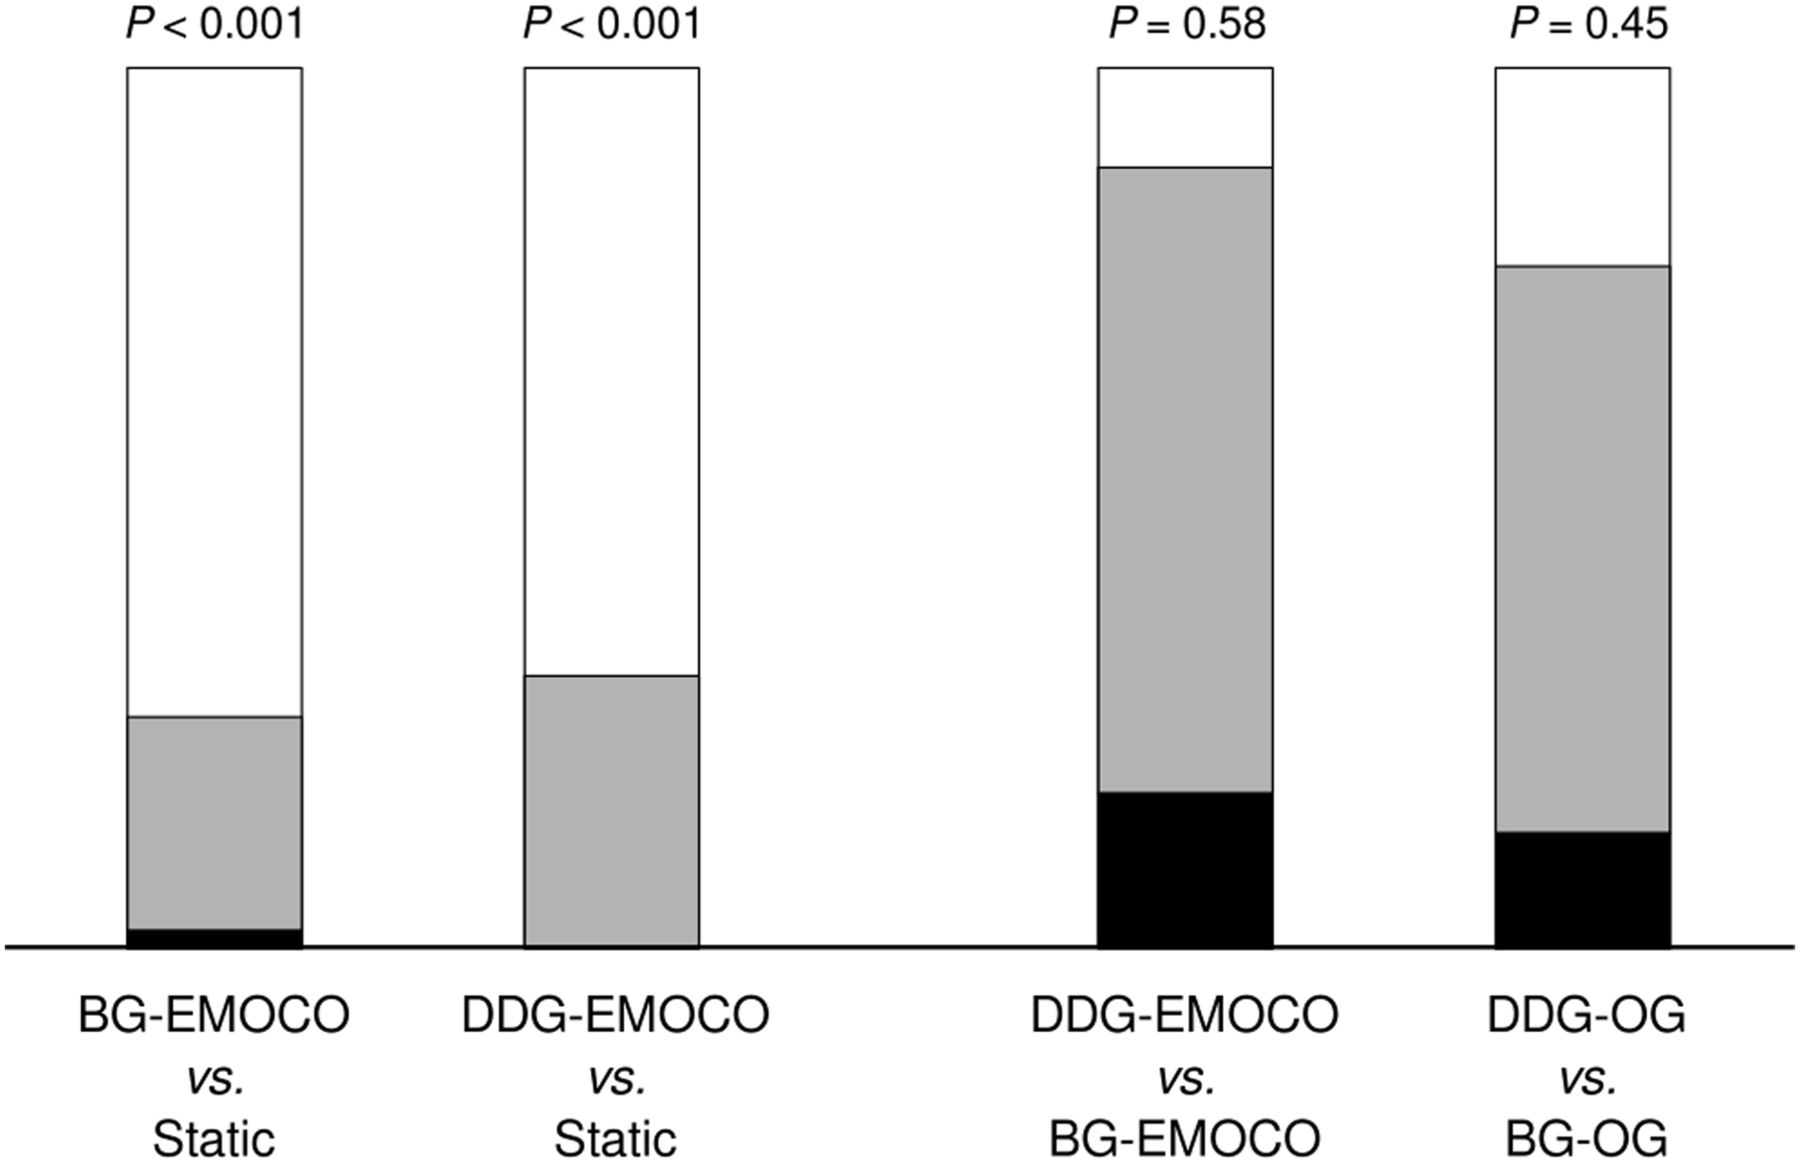
- FIGURE 6.
Pairwise visual quality comparison between EMOCO and static reconstructions (left) and between DDG and BG (right) (n = 45). White areas denote cases in which method 1 was superior to method 2; black areas denote cases in which method 1 was inferior; and gray areas denote cases in which quality was equal.
- FIGURE 7.
Maximum-intensity projection of scan with elevated colon uptake (arrows; R1 and R2) demonstrating better delineation with BG and DDG.


Tables
Parameter R0 R1 R2 R3 R4 R5 Global Start Proximal femur Bladder Right kidney Liver dome Aortic arch Lung apex Proximal femur End Bladder Right kidney Liver dome Aortic arch Lung apex Head/neck Head/neck Correlation coefficient 0.12 ± 0.17 (−0.12–0.61) 0.72 ± 0.15 (0.35–0.96) 0.89 ± 0.07 (0.68–0.97) 0.77 ± 0.16 (0.26–0.94) 0.41 ± 0.32 (−0.71–0.86) 0.05 ± 0.08 (−0.15–0.21) 0.48 ± 0.11 (0.30–0.75) Data are mean ± SD, followed by range in parentheses.
Region Lesions (n) Patients (n) SUVmax SUVmean V50% (cm3) Upper lungs 26 14 12.5 ± 16.1 (5.1–84.1) 8.1 ± 10.3 (3.4–52.1) 0.2 ± 0.7 (0.0–2.6) Upper mediastinum 13 10 18.3 ± 10.9 (5.7–38.9) 12.4 ± 7.4 (3.4–25.9) 0.8 ± 1.5 (0.1–5.4) Lower lungs 82 32 12.9 ± 15.8 (3.0–88.0) 8.5 ± 10.9 (2.0–58.8) 0.4 ± 1.7 (0.1–11.5) Lower mediastinum 20 16 14.1 ± 12.5 (5.5–57.4) 9.2 ± 9.0 (3.6–41.9) 0.4 ± 1.1 (0.1–3.6) Liver 31 11 14.5 ± 6.0 (7.1–26.9) 9.0 ± 3.8 (4.4–17.6) 1.5 ± 3.8 (0.1–14.4) Other infradiaphragmatic regions 24 10 20.4 ± 9.3 (7.8–43.0) 13.6 ± 6.1 (4.9–28.0) 0.8 ± 3.0 (0.1–12.0) Total 196 45 14.3 ± 13.4 (3.0–88.0) 9.3 ± 9.1 (2.0–58.8) 0.5 ± 2.4 (0.0–14.4) Data are median ± SD, followed by range in parentheses.
Parameter Static BG-EMOCO DDG-EMOCO BG-OG DDG-OG SUVmax 14.3 ± 13.4 19.8 ± 15.7 20.5 ± 15.6 19.6 ± 17.1 18.9 ± 16.6 P value to static <0.001 <0.001 P value to BG 0.60 0.19 SUVmean 9.3 ± 9.1 13.5 ± 11.6 13.7 ± 11.4 12.6 ± 12.5 12.4 ± 12.2 P value to static <0.001 <0.001 P value to BG 0.65 0.11 V50% (cm3) 0.5 ± 2.4 0.3 ± 1.4 0.3 ± 1.3 0.3 ± 1.2 0.3 ± 1.3 P value to static <0.001 <0.001 P value to BG 0.87 0.50 Data are median ± SD.
Paramete Static BG-EMOCO DDG-EMOCO BG-OG DDG-OG SUVmax 9.5 ± 10.5 13.4 ± 13.5 13.5 ± 13.7 15.2 ± 14.6 14.6 ± 12.5 P value to static <0.001 <0.001 P value to BG 0.21 0.28 SUVmean 6.8 ± 7.1 8.9 ± 9.4 8.9 ± 9.2 9.5 ± 10.2 9.0 ± 8.3 P value to static <0.001 <0.001 P value to BG 0.44 0.20 V50% (cm3) 0.6 ± 1.8 0.4 ± 0.6 0.3 ± 0.6 0.3 ± 0.8 0.3 ± 0.7 P value to static <0.001 <0.001 P value to BG 0.71 0.33 Data are median ± SD.


