


Abstract
Respiratory gating is the standard to prevent respiration effects from degrading image quality in PET. Data-driven gating (DDG) using signals derived from PET raw data is a promising alternative to gating approaches requiring additional hardware (e.g., pressure-sensitive belt gating [BG]). However, continuous-bed-motion (CBM) scans require dedicated DDG approaches for axially extended PET, compared with DDG for conventional step-and-shoot scans. In this study, a CBM-capable DDG algorithm was investigated in a clinical cohort and compared with BG using optimally gated (OG) and fully motion-corrected (elastic motion correction [EMOCO]) reconstructions. Methods: Fifty-six patients with suspected malignancies in the thorax or abdomen underwent whole-body 18F-FDG CBM PET/CT using DDG and BG. Correlation analyses were performed on both gating signals. Besides static reconstructions, OG and EMOCO reconstructions were used for BG and DDG. The metabolic volume, SUVmax, and SUVmean of lesions were compared among the reconstructions. Additionally, the quality of lesion delineation in the different PET reconstructions was independently evaluated by 3 experts. Results: The global correlation coefficient between BG and DDG signals was 0.48 ± 0.11, peaking at 0.89 ± 0.07 when scanning the kidney and liver region. In total, 196 lesions were analyzed. SUV measurements were significantly higher in BG-OG, DDG-OG, BG-EMOCO, and DDG-EMOCO than in static images (P < 0.001; median SUVmax: static, 14.3 ± 13.4; BG-EMOCO, 19.8 ± 15.7; DDG-EMOCO, 20.5 ± 15.6; BG-OG, 19.6 ± 17.1; and DDG-OG, 18.9 ± 16.6). No significant differences between BG-OG and DDG-OG or between BG-EMOCO and DDG-EMOCO were found. Visual lesion delineation was significantly better in BG-EMOCO and DDG-EMOCO than in static reconstructions (P < 0.001); no significant difference was found when comparing BG and DDG for either EMOCO or OG reconstruction. Conclusion: DDG-based motion compensation of CBM PET acquisitions outperforms static reconstructions, delivering qualities comparable to BG approaches. The new algorithm may be a valuable alternative for CBM PET systems.
Respiratory motion is a source of image degradation in PET and combined PET/CT of the thorax and the abdomen (1), leading to effective resolution losses, image blurring, apparent decreased tracer uptake, apparent increased lesion volumes, and potentially lower detection rates for malignancies (2).
Hardware-based gating approaches, using additional equipment to record the respiration of the patient, are widely considered as the reference standard to minimize these effects (3–5). The two most frequently applied systems use sensors measuring pressure changes within a belt around the belly (pressure-sensitive belt gating [BG]) (6) and a camera system monitoring the motion of markers placed on the patient (7).
In contrast, data-driven gating (DDG) approaches derive respiratory waveforms from PET raw data (8). Different DDG methods have been investigated in the past (9–13), and first clinical evaluations have proven their efficacy (14–17). All these studies were performed with limited numbers of bed positions in conventional step-and-shoot mode, in which temporal fluctuations of respiratory frequencies within measured data can be assumed to reflect respiratory motion. However, for well-established continuous-bed-motion (CBM) scans (18), this no longer holds true, as the moving bed introduces additional time dependencies.
CBM offers advantages over step-and-shoot scans, such as more uniform axial sensitivities and greater freedom in scanning ranges, as scans are no longer bound to discrete numbers of bed positions (19). CBM also supports different speed profiles, such as by allowing slower scans of regions of higher interest, and does not seem to affect motion correction outcomes compared with step-and-shoot scans (20). Finally, patients seem to prefer CBM over step-and-shoot scans (21). Thus, offering both DDG and CBM seems desirable, potentially combining the advantages of both. However, because of the additional time dependencies, conventional DDG algorithms cannot be expected to work properly per se and need—at the least—modifications for CBM. For example, center-of-mass–based algorithms work well with moving tracer accumulations within the scanner (e.g., the heart in 18F-FDG PET scans (11)) but would fail when these accumulations enter or leave the field of view during CBM.
In this study, we investigated how a dedicated CBM-DDG algorithm performs in comparison to a conventional BG system. Originally, the first implementation was developed for step-and-shoot acquisitions (10), but implementation was then extended to dynamic PET characterized by nonstationary tracer distributions (22). Prior investigation demonstrated CBM compatibility (23). Additionally, the algorithm potentially avoids the problem of gating signal inversion inherent in DDG in step-and-shoot scans of adjacent bed positions (24,25). Therefore, this study assessed its performance in a cohort of routine patients undergoing whole-body 18F-FDG CBM PET/CT.
MATERIALS AND METHODS
Patient Data
Datasets of 56 patients with suspected malignancies in the thorax or abdomen who underwent 18F-FDG CBM PET/CT scans between December 2018 and July 2019 were included in this analysis. All patients gave written informed consent for retrospective examination. This study was approved by the ethics committee of the Ärztekammer Westfalen-Lippe and the University of Münster (AZ 2019-024-f-S) and was performed in accordance with the 1964 Helsinki declaration and its later amendments.
PET/CT Scan
The patients fasted overnight before PET/CT. 18F-FDG (4 MBq/kg of body mass intravenously) was injected about 1 h before scanning. Patients were then scanned on a Biograph mCT (Siemens Healthcare) with time-of-flight capability and CBM (axial PET field of view, 21.8 cm; spatial resolution at center, 4 mm in full width at half maximum; sinogram size, 400 × 168; number of time-of-flight bins, 13) (26). For scanning, the patients lay supine with the arms above the head. During examination, the BG system AZ-733 V (Anzai Co.) recorded the respiratory signals subsequently used for gating.
Scanning took place from the head or neck to the proximal femur. Based on topograms, low-dose CT scans in end-expiration were obtained (tube voltage, 120 kV; effective current, 18 mAs; slice thickness, 3.0 mm; duration, 10–20 s), followed by list-mode PET in CBM (free breathing; speed, 1.1 mm/s; duration, 560–1,270 s).
Gating and Reconstructions
The investigated DDG algorithm is based on a spectral analysis of PET data (23). These were first projected into a series of 500-ms 3-dimensional volumes by histogramming each prompt event into the voxel corresponding to the center of the time-of-flight bin, on a grid with 32 × 32 transaxial voxels, and axially extended to full acquisition length using 2-mm slices. Delayed events do not contain localized motion information and were ignored. The acquisition was then divided into overlapping axial regions of 80-mm length, and the spectral analysis method was used to determine a mask identifying which voxels were subject to respiratory motion. To this end, we defined an initial estimate of respiratory amplitude,  , as the change in the anterior–posterior distribution of counts over time. The anterior–posterior distribution at time t is defined as the SD of the corresponding 500-ms 3-dimensional volume,
  , projected onto the anterior–posterior axis:
 Eq. 1
Eq. 1
The respiratory frequency was then defined as Eq. 2
Eq. 2
for all frequencies in the range  , where
  is the power spectrum of
  and argmax the function that chooses the argument leading to the maximum value of the respective function. Cardiac frequencies were thus excluded. The location
  for 80-mm range n was included in the mask
  (i.e.,
  ) for the corresponding range if
 Eq. 3
Eq. 3
for frequencies in the range  , where
  is the power spectrum of the 3-dimensional volume at range n,
  in the temporal domain, and thresh was a threshold determined iteratively such that 10% of pixels were included in the mask.
A weighting function was required to identify the relative direction that regions of contrast (edges) move (10). By assigning positive or negative weights to mask values from edges that are, respectively, opposed in the direction of motion, the net contribution from moving edges adds constructively to the overall respiratory signal. The weighted mask value at each voxel of region n within the mask was defined as Eq. 4
Eq. 4
where  is the phase angle at
  , the peak frequency of respiration derived from the spectral analysis, and
  is the mode phase angle of all corresponding voxels in the mask.
Because the relationship between signal gradient sign and the absolute direction of motion is arbitrary and independent for different axial bed positions (24,25), phase angles for region n in CBM acquisitions were offset by the optimal angle  , which minimized the difference between weights in adjacent, overlapping regions:
 Eq. 5with argmin denoting the function that gives the argument leading to the minimum value of the respective function. To initialize Equation 5,
  was set to 0 for region
  , defined as the axially central 80-mm region, and m refers to the adjacent region in the direction of the axial center,
 Eq. 6with sgn denoting the sign function. The phase-weighted masks
  from all 80-mm regions were combined into a single mask representing the entire axial extent,
  , by averaging the nonzero values at
  , that is,
 Eq. 7
Eq. 7
The respiratory signal  was obtained by summing all values in the masked time series of 3-dimensional volumes,
  , such that
 Eq. 8
Eq. 8
Changes in anterior–posterior motion in the volume series were used to ensure that the signal increases and decreases during inspiration and expiration, respectively. Low-frequency changes in signal offset and amplitude that result from large axial variations in tracer distribution were removed by subtracting a fitted spline, Eq. 9
Eq. 9
and normalized using a w = 15-s sliding window, Eq. 10
where SD is the SD of the window.
Finally, the signals were linearly interpolated to 50 Hz. BG signals  were recorded at 50 Hz.
Both  and
and  were corrected for baseline drifts to eliminate nonrespiratory motion. This was done by subtracting a smoothed step function defined on intervals of 15-s length representing the fifth percentile of the original signal. This correction also ensured similar amounts of noise for different axial positions in amplitude-gated CBM images (although potentially resulting in residual blur by noncompensated baseline motion). The optimal gates with 35% of the measured PET data corresponding to the smallest signal amplitude interval were reconstructed (27).
Additionally, images were reconstructed using an elastic motion correction (EMOCO) algorithm (28). First, motion vectors between optimally gated (OG) and static reconstructions were determined using optical flow estimation. These vectors were then treated as blurring kernels in the forward projection of the reconstruction, effectively deblurring motion effects (29). This algorithm has been validated against an established gate-to-gate motion correction (30).
All datasets were reconstructed using the e7 toolbox (Siemens Healthcare) by ordinary Poisson ordered-subset expectation maximization (3 iterations, 21 subsets) with point-spread function, time of flight, normalization, and random and scatter corrections, resulting in the following reconstructions: static; OG BG and DDG; and EMOCO BG and DDG. Attenuation correction was based on CT data. The images comprised slices of 400 × 400 voxels (volume, 2.04 × 2.04 × 2.03 mm). No postreconstruction filter was applied.
Data Analysis
 and
and  were analyzed by calculating the global Pearson correlation coefficient, taking all time indices t into account.
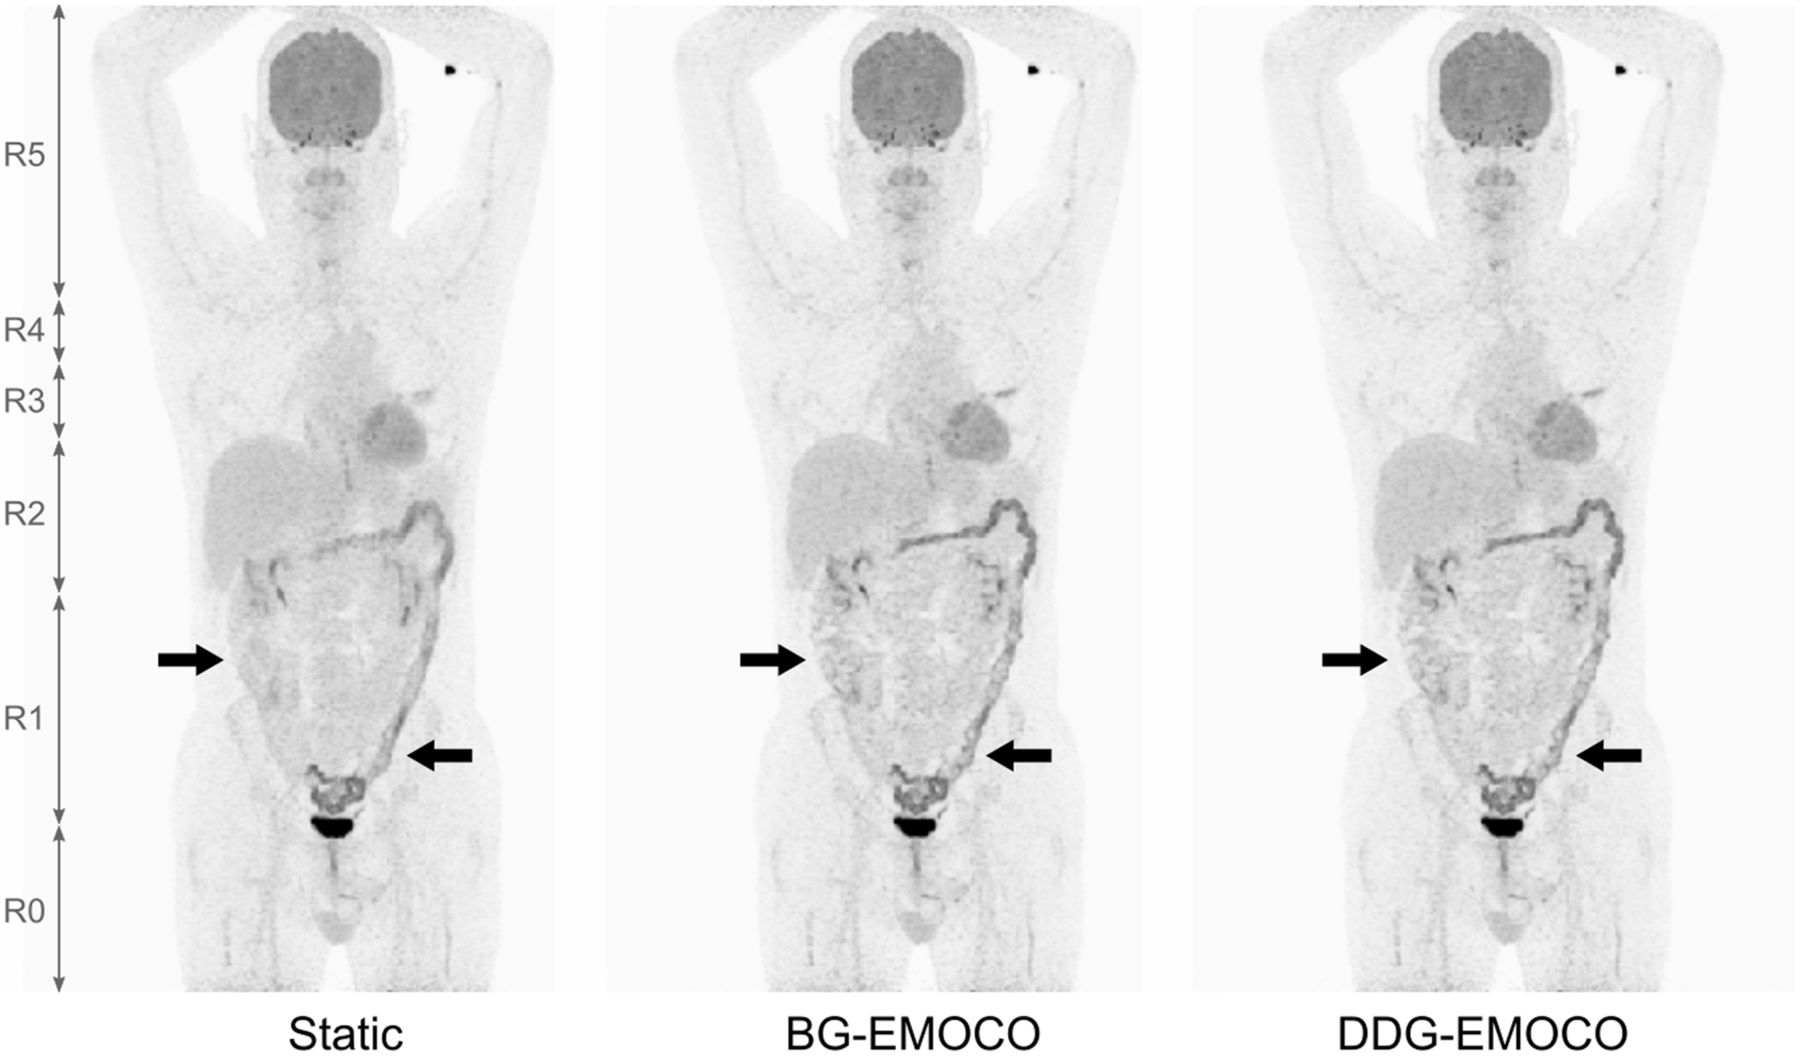
Furthermore, regional correlation coefficients were determined for the following ranges: below the bladder (R0), bladder to right kidney (R1), right kidney to liver dome (R2), liver dome to aortic arch (R3), aortic arch to lung apex (R4), and above the lung apex (R5) (Table 1). The positions of these landmarks were determined from CT, and the times when they were in the center of the PET scanner were calculated.
Definition of Regions and Correlation Coefficients Between BG and DDG Signals
Finally, local correlation coefficients were calculated for every time  as the correlation coefficient between
  and
and  determined for
  , that is, on a 10-s interval around
  , resulting in a better-resolved correlation metric than regional correlation coefficient.
The reconstructed PET images were analyzed for lesions between the bladder and the lung apex. These were characterized individually for all reconstructions by their SUVmax, their apparent metabolic volume based on the respective 50% SUVmax threshold (V50%), and their SUVmean in that V50%. SUVmax was determined in a region of interest manually placed over the respective lesion. Since multiple lesions were potentially derived from a scan, 1 lesion per acquisition was randomly chosen, defining a subgroup that was additionally analyzed.
Finally, identically color-scaled coronal slices through the lesions of this subgroup were prepared for an assessment of visual differences between static reconstructions, between BG-EMOCO and DDG-EMOCO, and between BG-OG and DDG-OG. These slices were presented independently in random order to 2 nuclear medicine clinicians and 1 medical physicist, who were asked to rate the relative quality in terms of lesion delineation without knowledge of the actual reconstruction method. A relative score was devised as follows: if one method was judged superior to another, +1 was noted; if it was judged inferior, −1 was noted; otherwise, 0 was noted. The scores of the experts were averaged for every comparison and rounded to the nearest integer, resulting in an averaged score per case and comparison.
Statistical Analysis
Correlation coefficients are given as mean ± SD. SUVmax, SUVmean, and V50% are given as median ± SD. SUV and V50% differences were tested using 2-tailed Wilcoxon signed-rank tests, and 2-tailed sign ttests were used to assess visual differences (MATLAB, version 2013b; MathWorks). Bonferroni adjustments for pairwise comparisons were applied; the familywise error rate was 0.05.
RESULTS
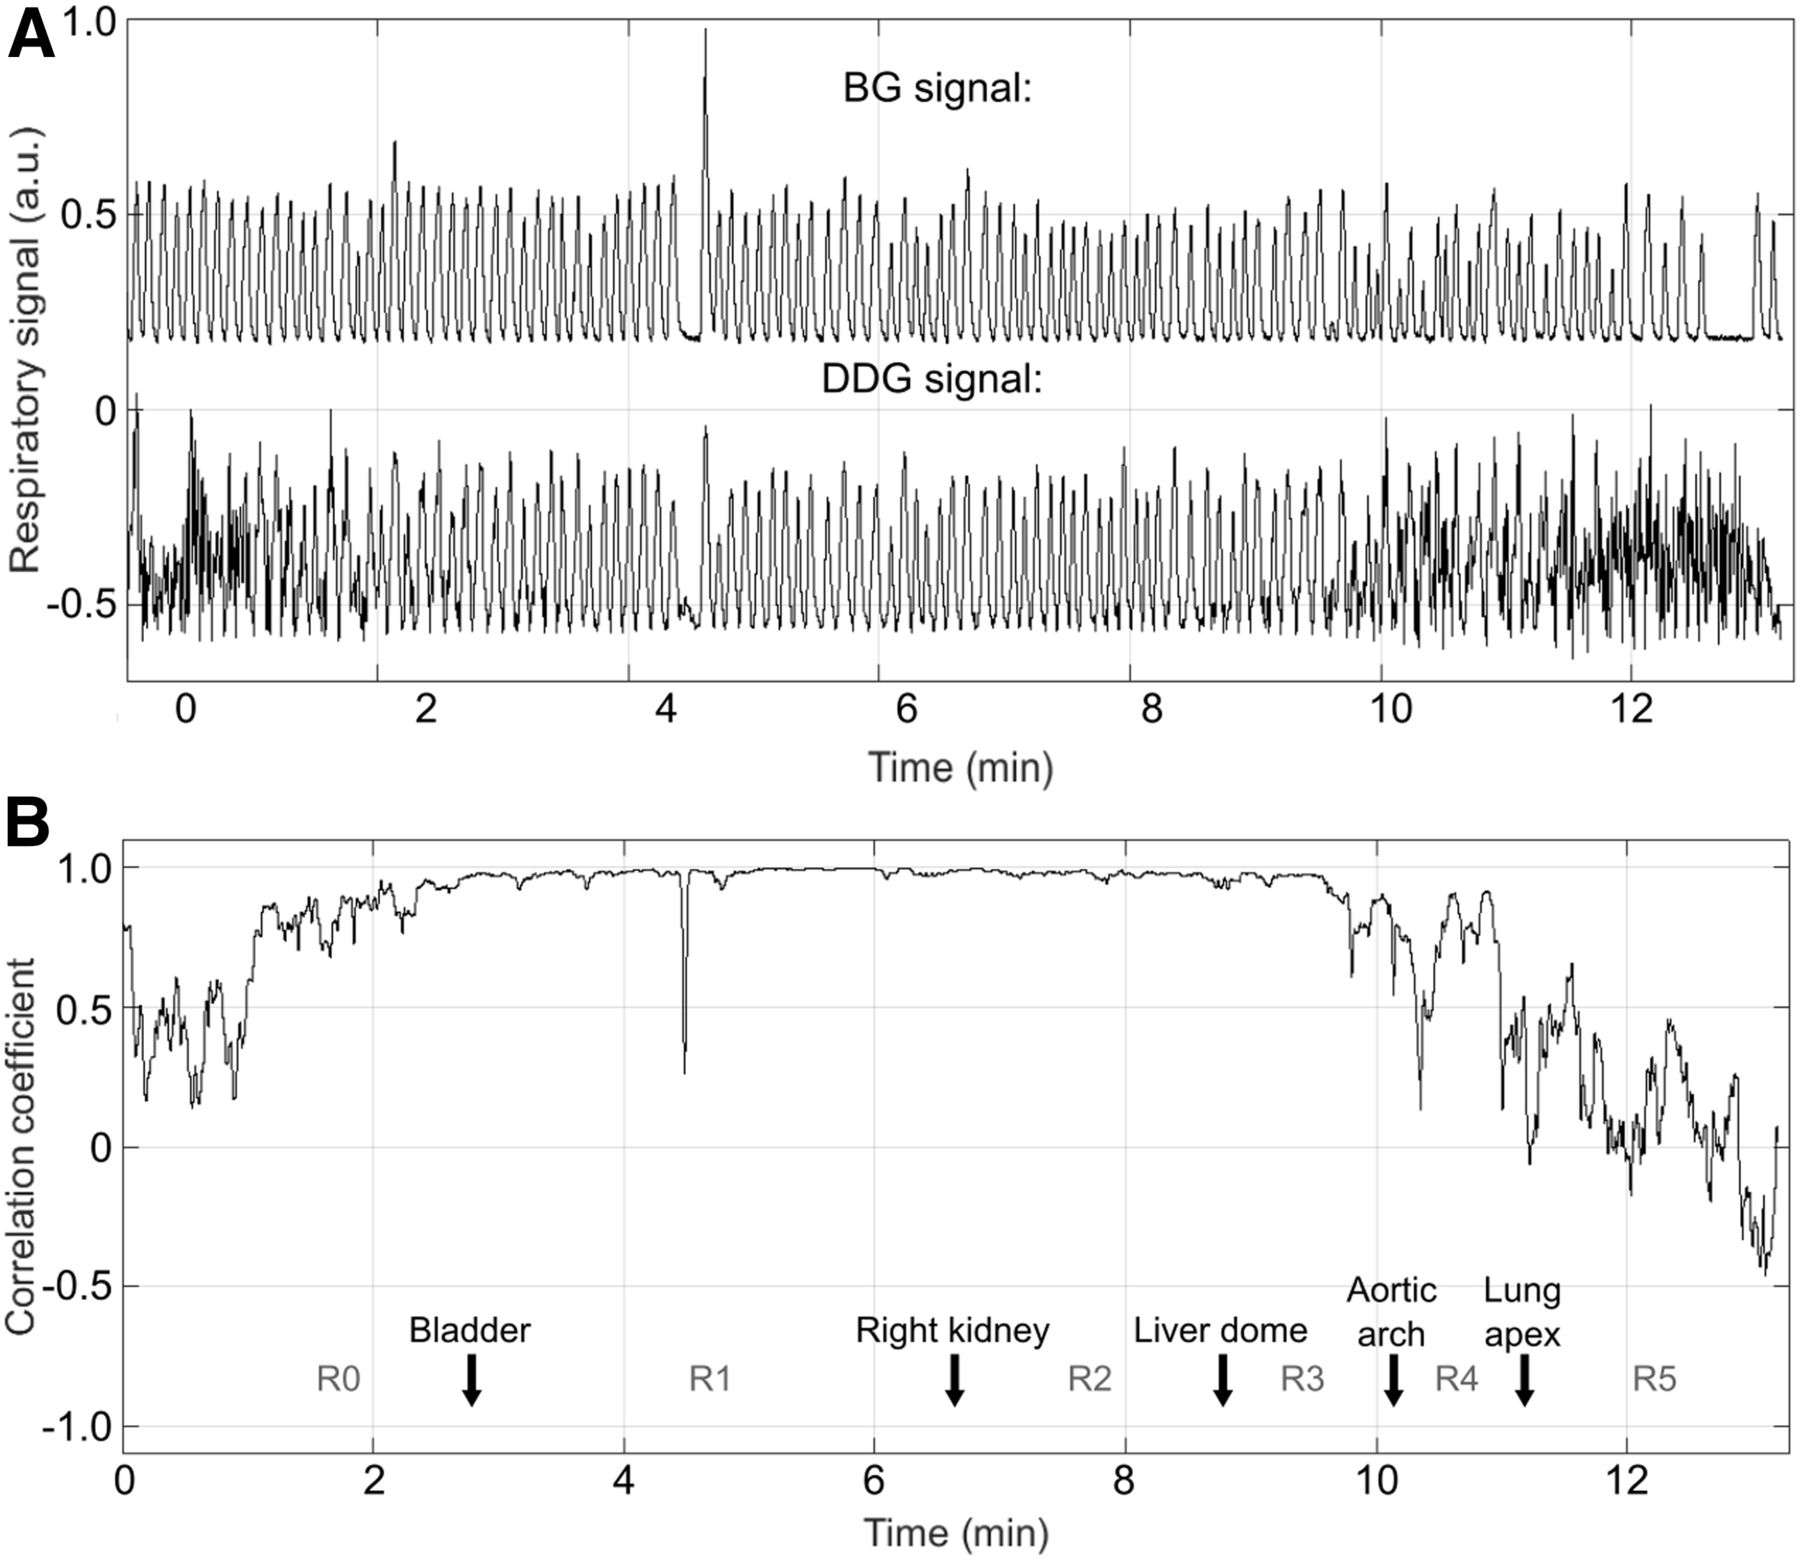
DDG signal calculation typically required 5–10 min on a 2.4-GHz, 16-core, 46-GB random-access-memory system. All 56 signals  demonstrated typical respiratory features between the bladder and the lung apex; other regions exhibited higher noise levels (Fig. 1A). This finding was corroborated in the correlation analysis between
  and
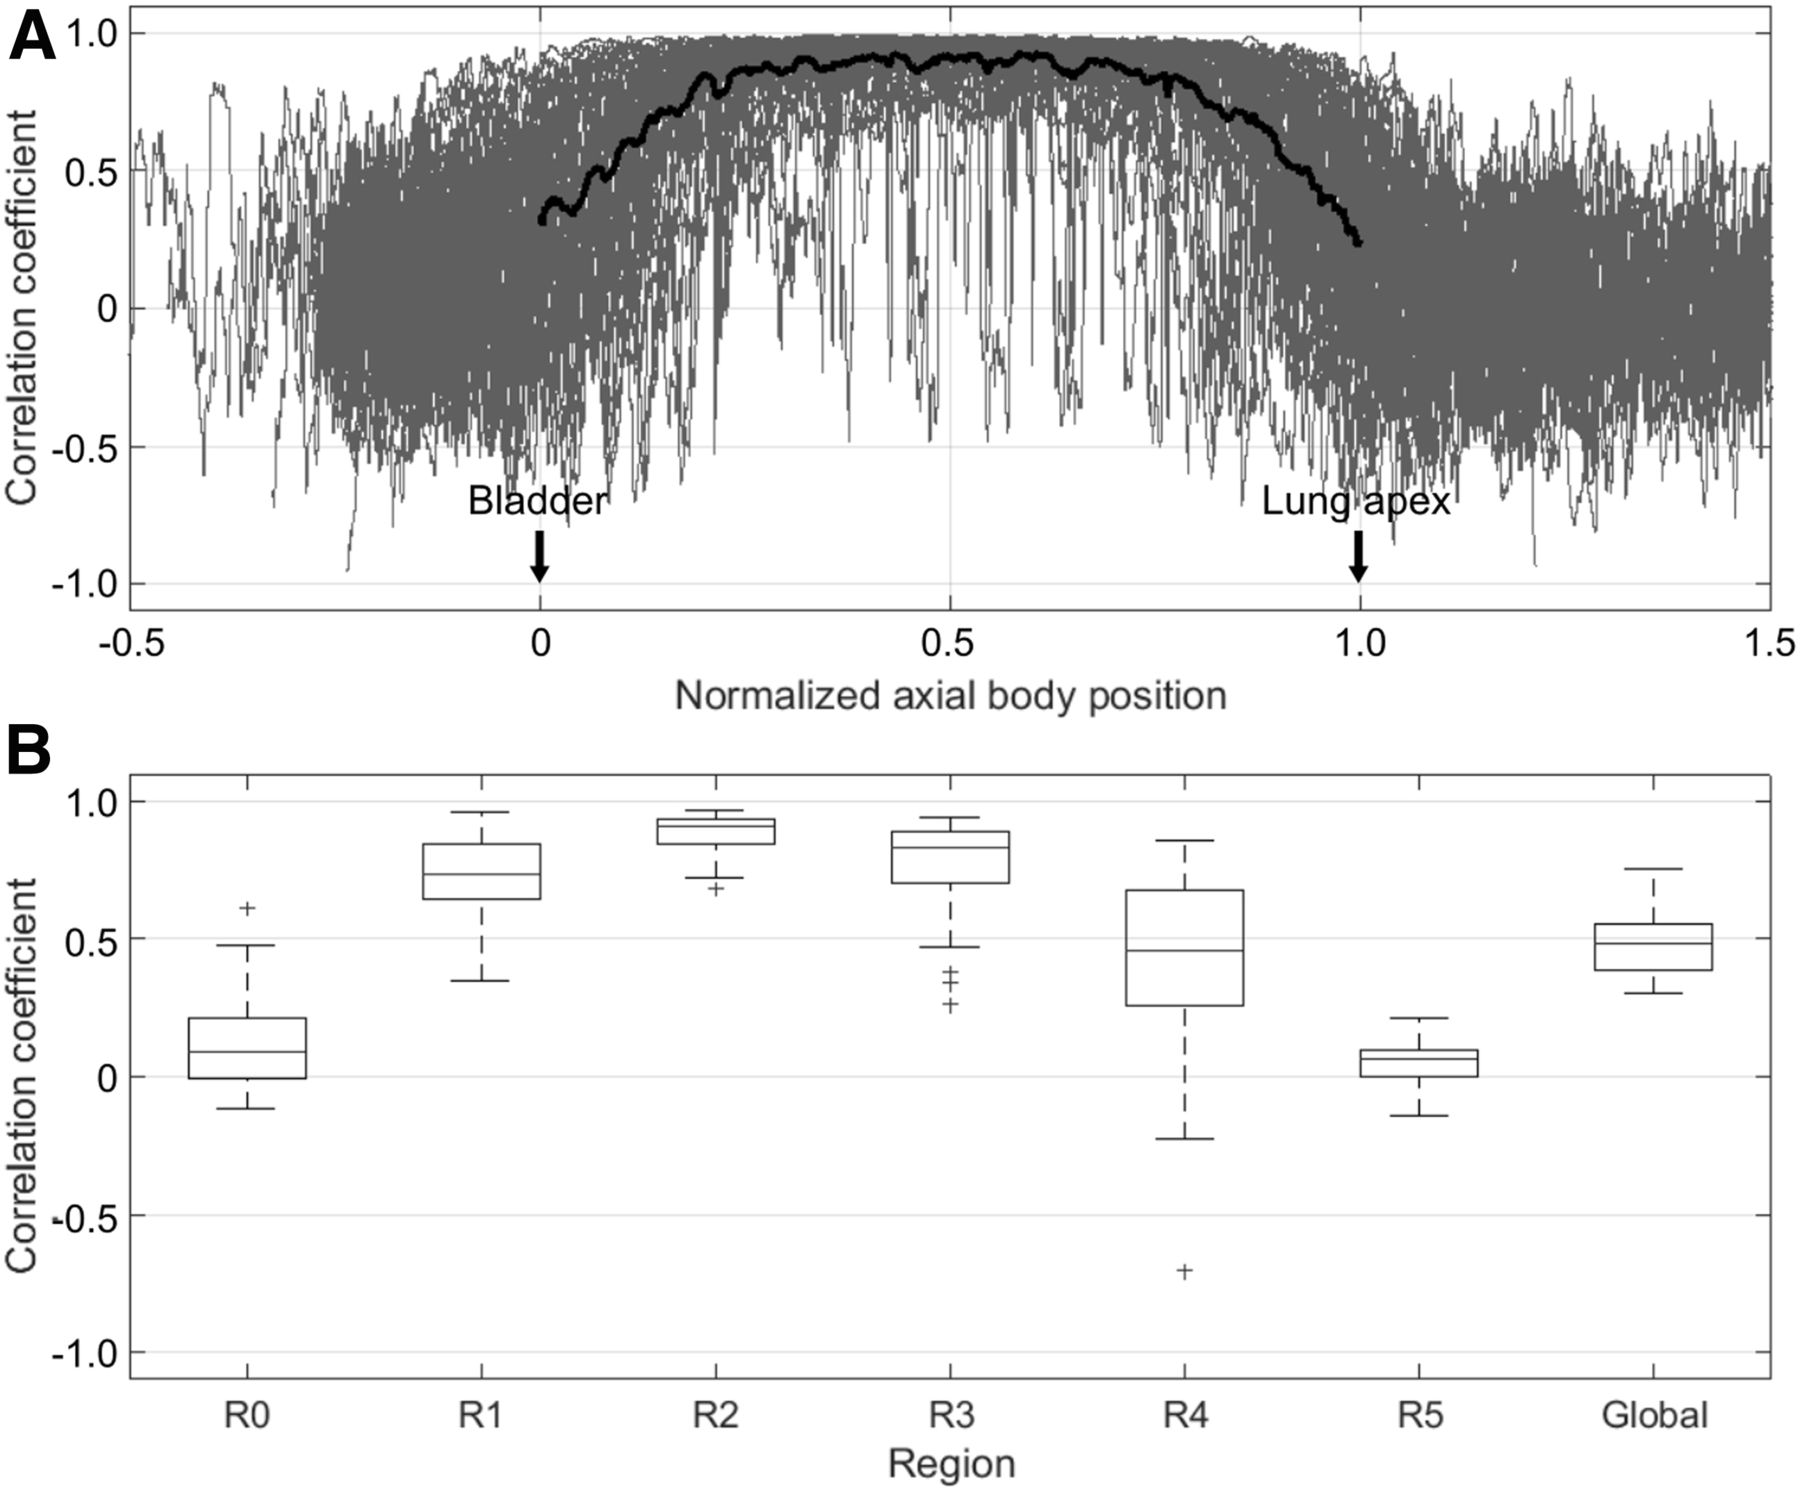
and  (Fig. 1B). Generally, despite considerable individual variation, local correlation coefficients demonstrated values close to 0 below the bladder, increasing to 0.9 around the kidneys and liver and decreasing to 0 above the lung apex (Fig. 2A).

Comparison of respiratory signals (A) and local correlation coefficients (B) for typical case (landmarks passing scanner center are indicated by arrows). a.u. = arbitrary units.

(A) Superposition of local correlation coefficients (gray) for all scans in normalized axial position. Average is indicated by black line. (B) Box plot of regional correlation coefficients for all scans. Asterisks denote outliers.
Regional correlation coefficients consistently showed the highest values in R2 (0.89 ± 0.07), decreasing to smaller values in R0 and R5 (0.12 ± 0.17 and 0.05 ± 0.08, respectively); the global correlation coefficient was 0.48 ± 0.11 (Fig. 2B; Table 1).
In total, 196 lesions were analyzed in 45 of the 56 scans (Table 2). Twenty-six lesions were located in the upper lungs, 13 in the upper mediastinum, 82 in the lower lungs, 20 in the lower mediastinum, 31 in the liver, and 24 in other infradiaphragmatic regions. All lesions were discernible in all reconstructions.
Lesion SUVs and V50% Determined from Static Reconstructions
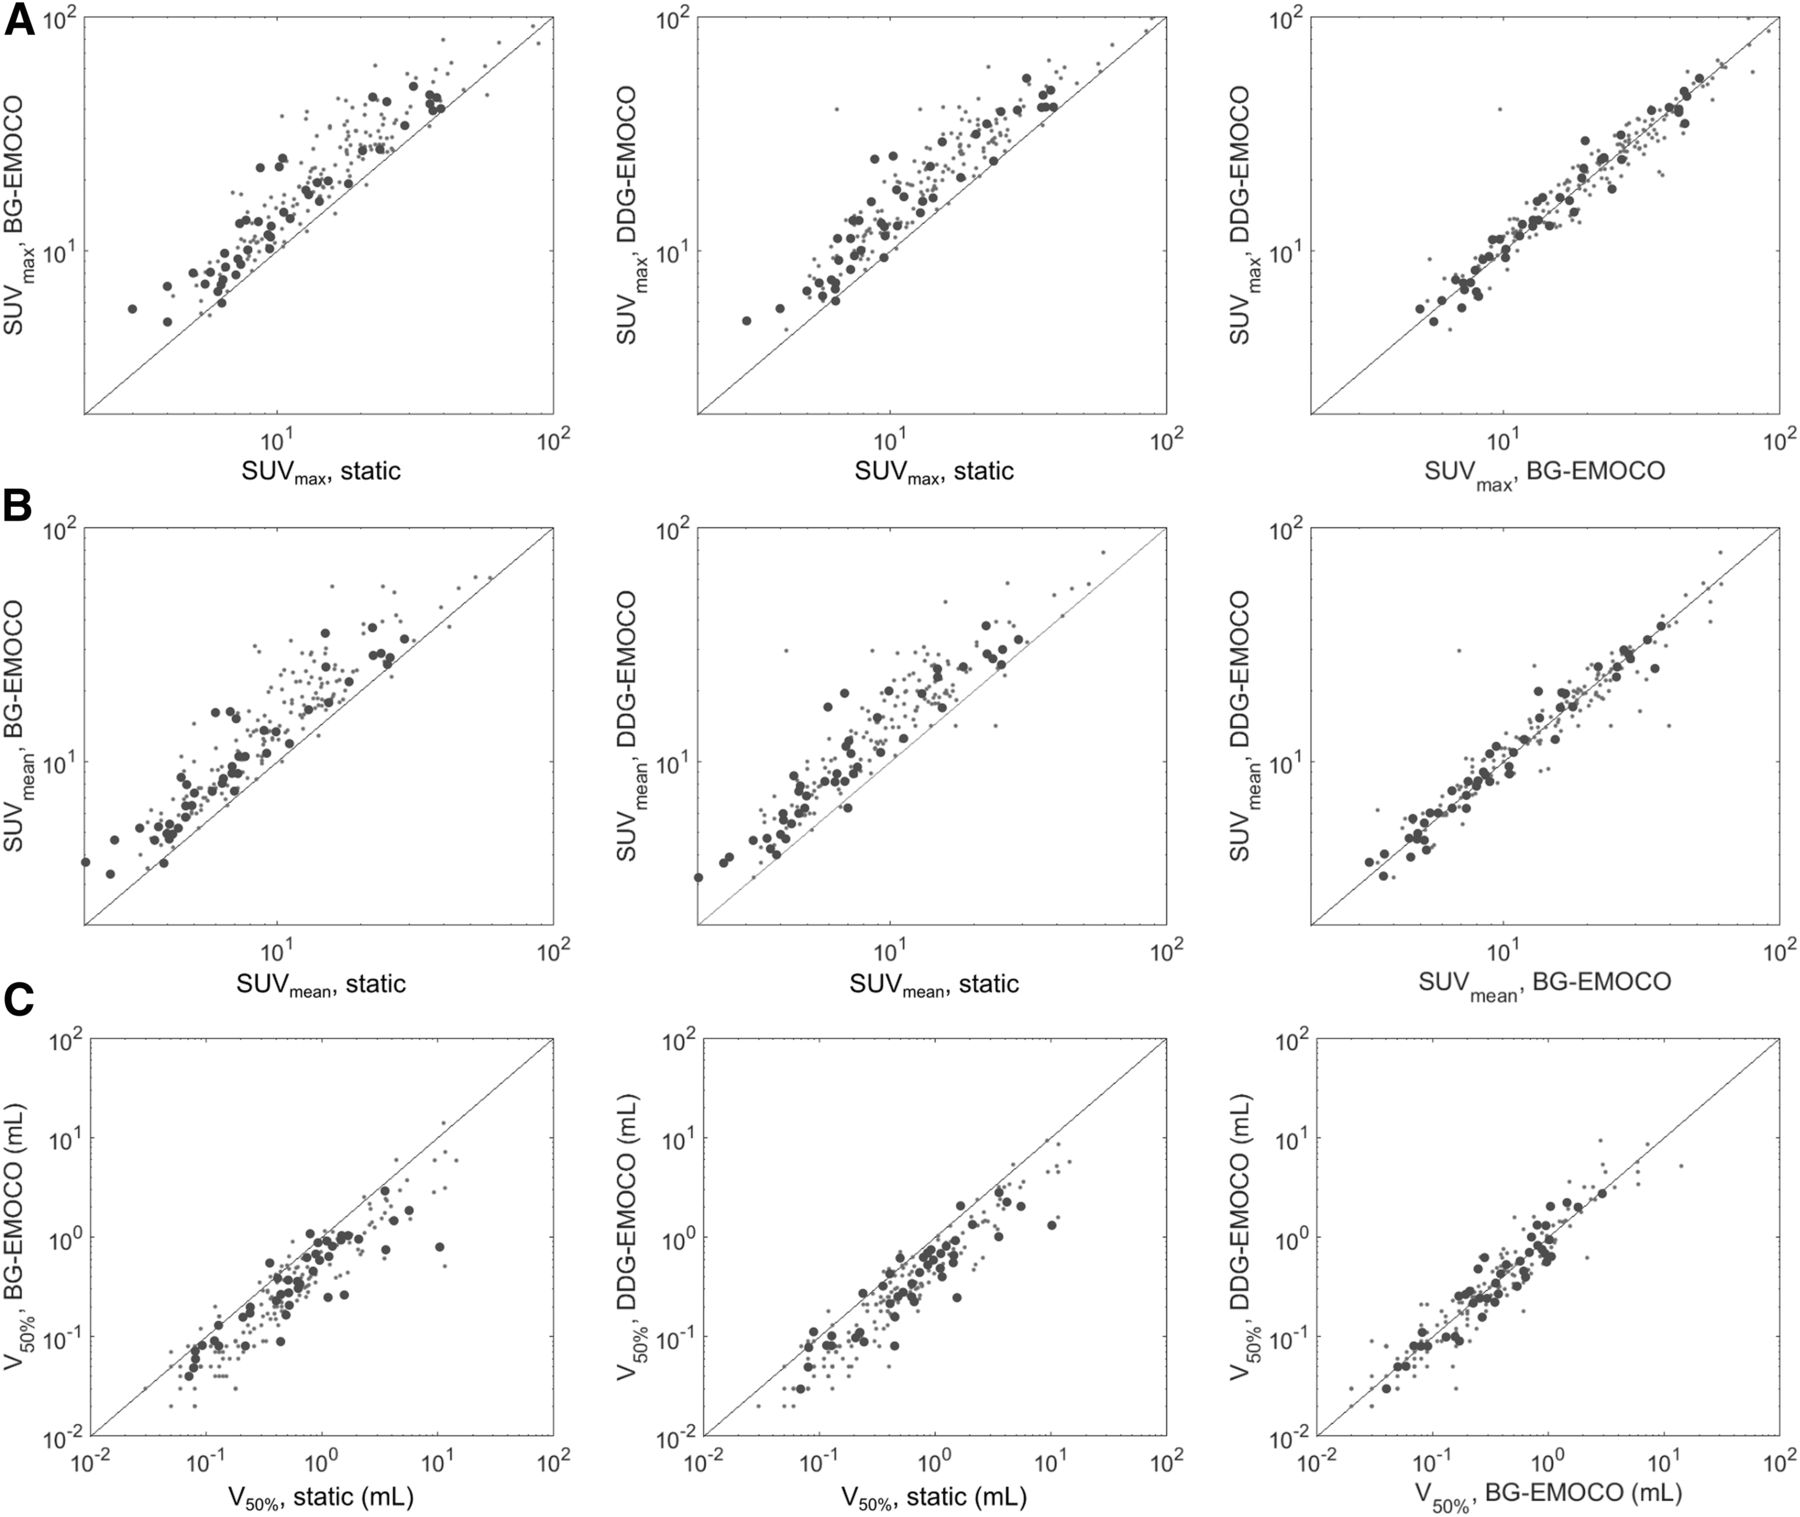
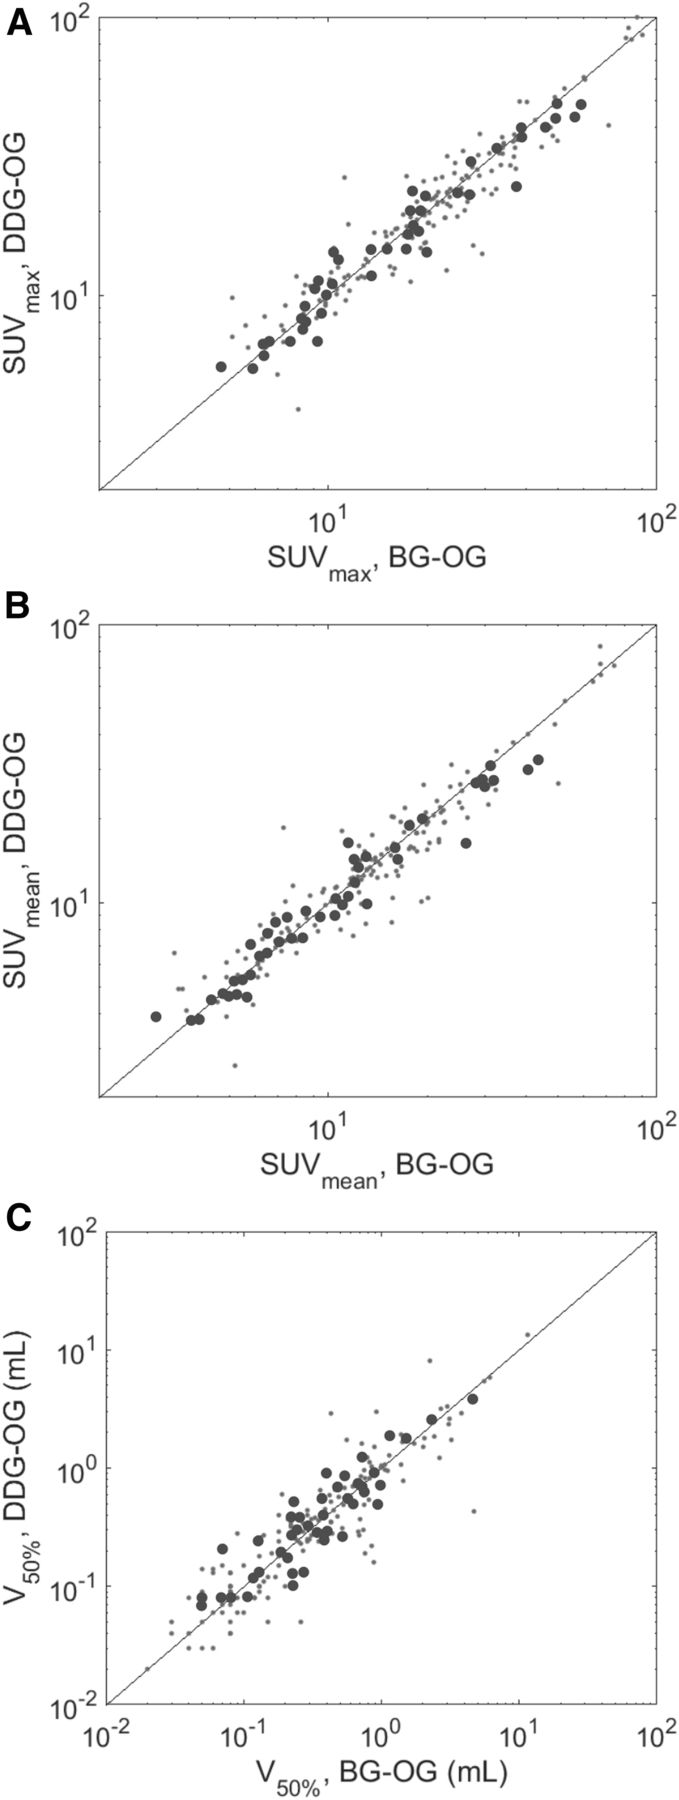
The SUVmax for all lesions was 14.3 ± 13.4, 19.8 ± 15.7, and 20.5 ± 15.6 for static reconstructions, BG-EMOCO, and DDG-EMOCO, respectively (Figs. 3 and 4; Table 3). The respective SUVmean was 9.3 ± 9.1, 13.5 ± 11.6, and 13.7 ± 11.4, and the respective V50% was 0.5 ± 2.4, 0.3 ± 1.4, and 0.3 ± 1.3 cm3. BG-EMOCO and DDG-EMOCO led to values significantly different from the static reconstructions. SUVmax was 19.6 ± 17.1 and 18.9 ± 16.6 for BG-OG and DDG-OG, respectively, and SUVmean was 12.6 ± 12.5 and 12.4 ± 12.2 for BG-OG and DDG-OG, respectively. V50% was 0.3 ± 1.2 cm3 for BG-OG and 0.3 ± 1.3 cm3 for DDG-OG. No significant differences between BG and DDG were observed.

Scatterplots of SUVmax (A), SUVmean (B), and V50% (C) for static, BG-EMOCO, and DDG-EMOCO reconstructions. Subgroup of 1 lesion per scan is denoted by big dots; black line is line of identity.

Scatterplots of SUVmax (A), SUVmean (B), and V50% (C) for BG-OG, and DDG-OG reconstructions. Subgroup of 1 lesion per scan is denoted by big dots; black line is line of identity.
Characteristics of All 196 Lesions for All Correction Strategies
Characteristics of 45 Randomly Chosen Lesions for All Correction Strategies
SUVmax in the subgroup of 1 lesion per scan (n = 45) was 9.5 ± 10.5, 13.4 ± 13.5, and 13.5 ± 13.7; SUVmean was 6.8 ± 7.1, 8.9 ± 9.4, and 8.9 ± 9.2; and V50% was 0.6 ± 1.8, 0.4 ± 0.6, and 0.3 ± 0.6 cm3 for static, BG-EMOCO, and DDG-EMOCO images, respectively (Figs. 3 and 4; Table 4). Differences between static- and either of the EMOCO-derived parameters were highly significant. SUVmax was 15.2 ± 14.6 and 14.6 ± 12.5, SUVmean was 9.5 ± 10.2 and 9.0 ± 8.3, and V50% was 0.3 ± 0.8 and 0.3 ± 0.7 cm3 for BG-OG and DDG-OG, respectively. Again, no significant differences between BG and DDG were seen.
Visual inspection of the PET images demonstrated improved lesion delineation for both OG and EMOCO compared with static reconstructions, although OG was noticeably noisier (Fig. 5). Quality analysis revealed that static reconstructions were judged superior to BG-EMOCO in a single case, inferior in 33, and equal in 11. Similarly, static reconstructions were judged superior to DDG-EMOCO in no case, inferior in 31, and equal in 14. Both BG-EMOCO and DDG-EMOCO were considered significantly superior to static images (P < 0.001; Fig. 6). No significant difference was seen between BG and DDG: 8 BG-EMOCO cases were superior to DDG-EMOCO, 5 cases were inferior, and 32 cases were the same (P = 0.58); DDG-OG was superior to BG-OG in 10 cases, inferior in 6, and equal in 29 (P = 0.45; Fig. 6).

Typical outcome of OG and EMOCO using BG and DDG signals, compared with static reconstruction. Visual improvements of liver lesions (arrows) are apparent.
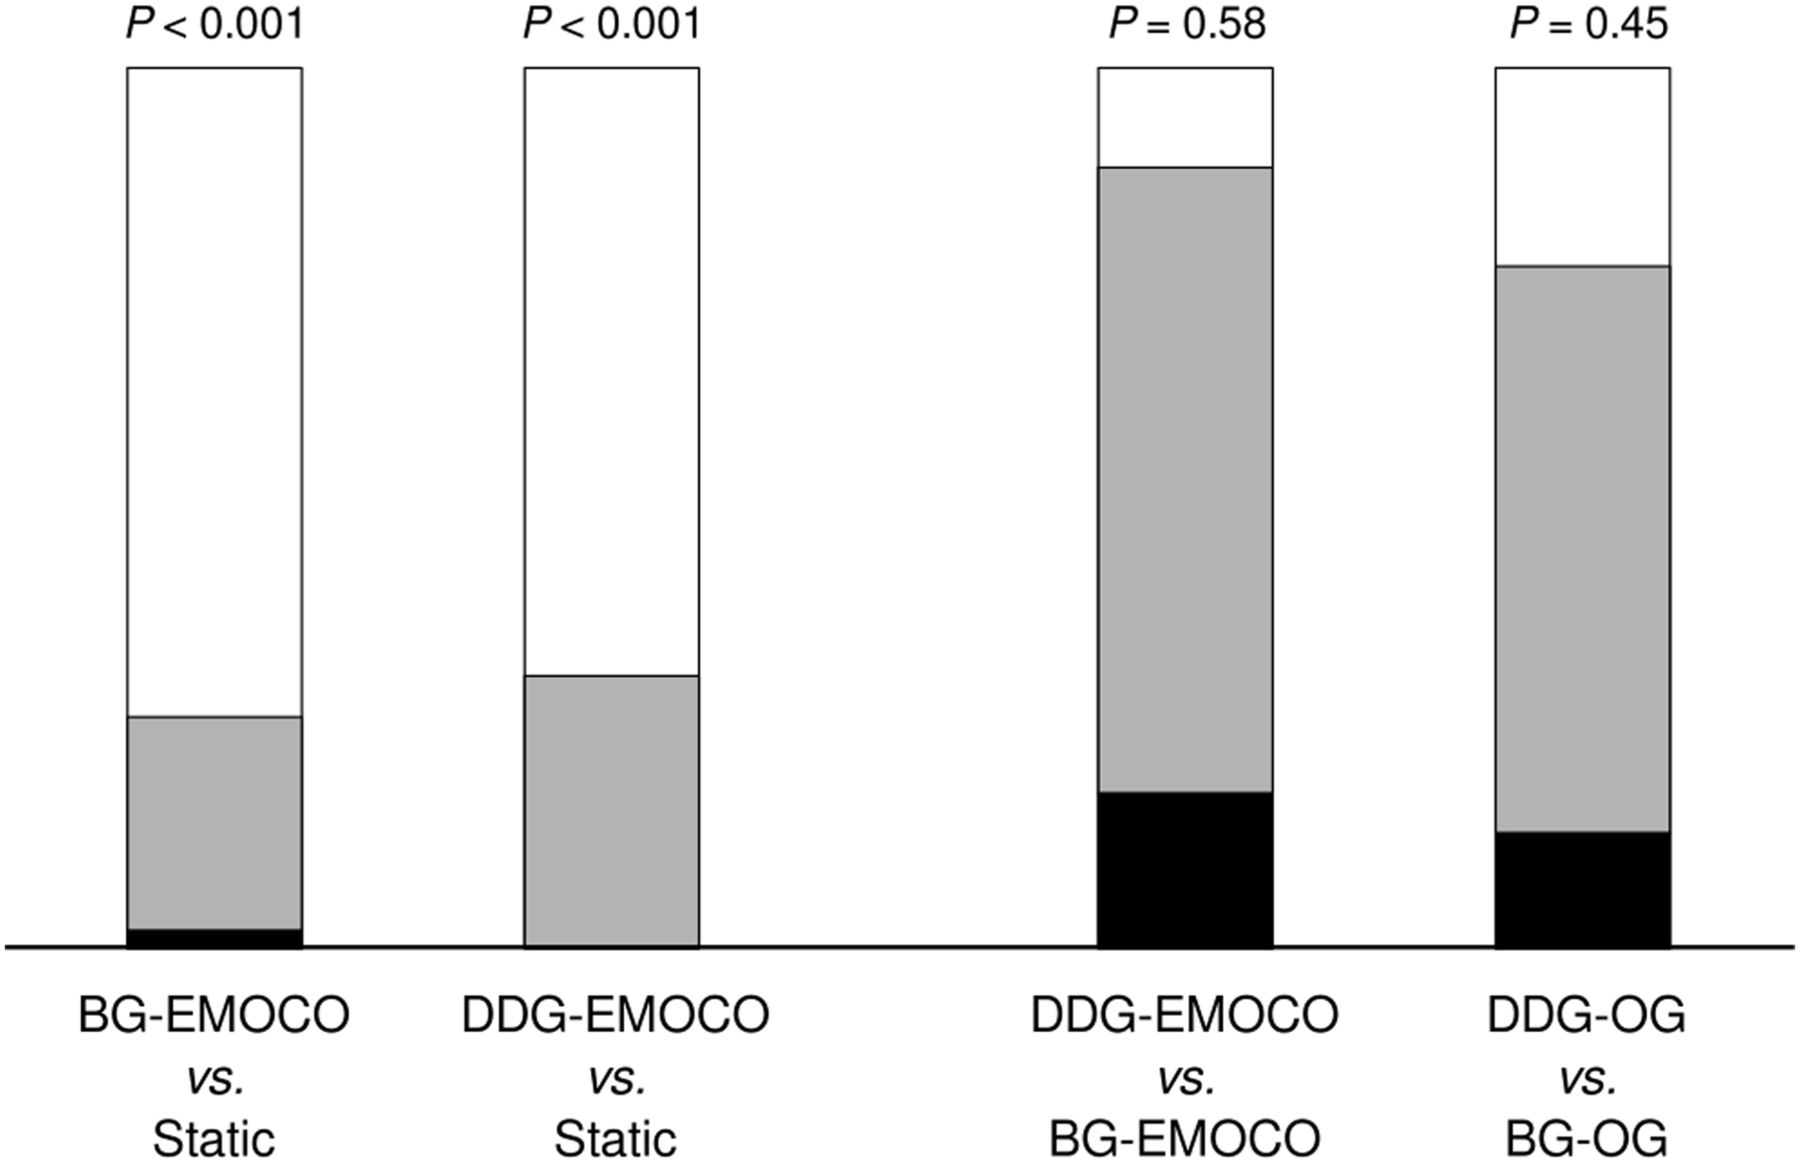
Pairwise visual quality comparison between EMOCO and static reconstructions (left) and between DDG and BG (right) (n = 45). White areas denote cases in which method 1 was superior to method 2; black areas denote cases in which method 1 was inferior; and gray areas denote cases in which quality was equal.
DISCUSSION
First clinical studies already have demonstrated that DDG methods are equivalent to BG methods in terms of image quality and lesion quantification (14,15); accordingly, vendors have started incorporating DDG algorithms into their PET systems (17). However, more studies are needed to ensure that DDG works well in a wide range of applications, radiotracers, and scanning modes (31).
In this respect, our study closes a gap by evaluating a novel CBM-DDG method in a larger patient cohort undergoing whole-body PET. In general, this algorithm resulted in motion-compensated PET images with quality and accuracy comparable to conventional methods, exploiting the advantages of both CBM and DDG in routine scans. An independent study using a similar algorithm but a smaller number of datasets (n = 15) already has demonstrated comparable results, with average regional correlation coefficients of 0.15, 0.69, 0.82, 0.75, 0.46, and 0.07 for regions R0, R1, R2, R3, R4, and R5, respectively (32). However, SUV seemed to be smaller for DDG than for BG, contrasting our results without significant differences.
Some results of our study are of particular interest. The comparison between  and
and  demonstrated considerable correlation even in deep abdominal regions (R0 and R1) in some scans, indicating the presence of respiratory motion there. Unfortunately, because only 4 lesions were detected in R1 in our cohort, no general conclusion can be drawn from the SUV analysis. However, some patients had elevated 18F-FDG uptake in several colon segments; these were visually better defined in both BG- and DDG-derived images than in static images (Fig. 7). A comparison with observations by Walker et al. confirms that respiratory motion plays a significant role in these regions, as these investigators found respiratory information in raw data of regions up to 40 cm below the liver dome (17).
Maximum-intensity projection of scan with elevated colon uptake (arrows; R1 and R2) demonstrating better delineation with BG and DDG.
In general, good correlations in  and
and  were found between the bladder and the lung apex, making possible an imaging workflow that automatically corrects for motion between these boundaries. Decreases in correlation from the lung base to the apex can be explained by smaller respiratory shifts measured by the DDG algorithm toward the apex. This raises the question of whether motion resolution in the upper lung is still sufficient to compete with BG. Surprisingly, an analysis of the lesions located in R4 (n = 39) revealed a slightly larger median SUVmax and SUVmean and a smaller V50% for DDG than for BG (e.g., SUVmax: 17.1 ± 15.9 vs. 17.8 ± 15.4 for BG-EMOCO and DDG-EMOCO, respectively). However, this difference was not statistically significant (with pre-Bonferroni P values of 0.05–0.11 for SUV). Larger cohorts are needed to analyze DDG accuracy in the upper lungs. Nevertheless, this possibility would be in line with some observations of hysteresis effects leading to phase differences in respiration between different body regions (33).
Our study had some additional limitations. First, only 18F-FDG PET/CT datasets were included. Although 18F-FDG is still the radiotracer used most often in clinical scans, other tracers, such as ligands of the prostate-specific membrane antigen, are becoming increasingly popular for PET imaging. It remains to be seen how DDG performs in these scans.
Furthermore, the observed increases in SUV and decreases in V50% were apparently larger than in similar studies (15,34). This finding highlights that lesion quantification is dependent on many factors, especially reconstruction parameters and spatial resolution. We chose to maximize image resolution in order to detect even small differences in performance between BG and DDG. Thus, we did not apply postreconstruction filters, and we reconstructed on a high-resolution grid, leading to higher SUV increases and V50% decreases. These values may not represent typical clinical outcomes; they rather reflect maximal differences in SUV and V50% achieved by gating and motion correction within the settings of this study.
CONCLUSION
The investigated DDG algorithm generated accurate respiratory signals from CBM PET raw data. Gated and motion-corrected images were comparable to a conventional BG approach in terms of lesion quantification and visual quality. The proposed DDG method seems to be a promising motion correction alternative for routine whole-body CBM PET scans.
DISCLOSURE
Florian Büther and Michael Schäfers received project funding by Siemens Healthcare GmbH, Erlangen, Germany. Judson Jones and Paul Schleyer are employees of Siemens Healthcare GmbH, Knoxville, TN. Florian Büther, Robert Seifert, Lars Stegger, and Michael Schäfers have control of any data that might present a conflict of interest for employees or consultants. No other potential conflict of interest relevant to this article was reported.
KEY POINTS
QUESTION: Is DDG as accurate as BG approaches in CBM PET?
PERTINENT FINDINGS: This study demonstrated no significant difference in lesion quantification or visual quality between DDG and BG, and both methods outperformed static reconstructions.
IMPLICATIONS FOR PATIENT CARE: The presented DDG method for CBM may replace BG approaches, leading to simplifications in workflow and patient management.
Acknowledgments
We thank Erika Düx, Umi Kim-Yeo, and Dr. Benjamin Noto for their excellent support during the study.
Footnotes
Published online Feb. 14, 2020.
- © 2020 by the Society of Nuclear Medicine and Molecular Imaging.
REFERENCES
- Received for publication August 28, 2019.
- Accepted for publication January 30, 2020.


