


Abstract
The use of Cerenkov radiation to activate nanoparticles in situ was recently shown to control cancerous tumor growth. Although the methodology has been demonstrated to work, to better understand the mechanistic steps, we developed a mathematic model that integrates Cerenkov physics, light interaction with matter, and photocatalytic reaction engineering. Methods: The model describes a detailed pathway for localized reactive oxygen species (ROS) generation from the Cerenkov radiation–assisted photocatalytic activity of TiO2. The model predictions were verified by comparison to experimental reports in the literature. The model was then used to investigate the effects of various parameters—the size of TiO2 nanoparticles, the concentration of TiO2 nanoparticles, and the activity of the radionuclide 18F-FDG—on the number of photons and ROS generation. Results: The importance of nanoparticle size in ROS generation for cancerous tumor growth control was elucidated, and an optimal size was proposed. Conclusion: The model described here can be used for other radionuclides and nanoparticles and can provide guidance on the concentration and size of TiO2 nanoparticles and the radionuclide activity needed for efficient cancer therapy.
Radionuclides are being used for various medical applications, from imaging for disease diagnosis to therapy. Therapeutic uses include tumor growth control for cancer, in which the high-intensity radiation from the nuclide kills cancer cells. In a recent development, another exciting property of radionuclides—the production of Cerenkov radiation (CR)—was used for imaging (1–6). CR is electromagnetic radiation produced when a charged particle travels in a medium at a speed exceeding that of light in that medium (7). The fast-moving charged ion polarizes the medium along its direction of movement, resulting in the small displacement of electrons. When the electrons relax, spheric waveforms generated along the ion track interfere constructively at a specific angle to the direction of movement and produce electromagnetic radiation (8,9). CR has a broadband emission in which the intensity decreases with increasing wavelength. Moreover, the radiation is generated locally within a given tissue, improving the signal-to-noise ratio for imaging applications. However, CR produces a low light intensity; thus, detecting the signal is often challenging. To overcome this issue, varieties of fluorophores, such as small molecules (10), quantum dots (11,12), and nanoparticles (13), are used to convert Cerenkov light into long-wavelength radiation.
Recently, CR was also used as a light source for chemical and therapeutic applications (14–16). In 2015, Kotagiri et al. (15) demonstrated the use of CR generated by the 18F-FDG radionuclide to activate TiO2 nanoparticles in vivo to produce reactive oxygen species (ROS) and suppress the growth of cancer cells. Since then, there has been growing interest in CR-assisted photodynamic therapy (PDT). TiO2 is a known photocatalyst for energy (17–20) and environmental (21,22) applications. It has a band gap of 3.2 eV and absorbs UV light efficiently—properties that match the high-intensity regimen of CR. Kamkaew et al. (16) reported a system with a 89Zr radionuclide (Cerenkov radiation source) and chlorin e6 (photocatalyst) and demonstrated its advantage in ROS generation through CR. Two radionuclides—68Ga and 18F—were recently studied for their cellular uptake and effectiveness in cancer treatment (23,24).
Although there has been experimental validation of local generation of ROS in the vicinity of tumors using CR (25), there is a need for a mechanistic understanding to better optimize the process and expand clinical deployment. In this regard, it is crucial to establish a quantitative correlation between the CR-produced light signal and the amount of ROS generation. In previous works, the CR yield of various radionuclides was modeled using the Frank–Tamm equation and Monte Carlo simulation (26–30). However, there has been no work on modeling the efficiency of CR activation of TiO2 nanoparticles and the corresponding amount of ROS generation. The photoactivity of TiO2 nanoparticles and the subsequent reaction for ROS generation have been studied—but primarily under activation by an external constant light source (21,31). However, systems containing time-dependent light sources distributed around TiO2 nanoparticles, such as CR generated from distributed radionuclides, are more complex and have not been explored.
We have developed a mathematic model that integrates Cerenkov physics, light extinction, and photocatalytic reaction engineering to identify the mechanistic steps involved in cancer cell destruction in the presence of radionuclides and semiconducting TiO2 nanoparticles. First, we calculated the amount of CR generated by the 18F-FDG radionuclide. Second, we determined the light radiation absorbed by TiO2 nanoparticles. Finally, we calculated the amount of ROS (hydroxyl and superoxide) generated with time. The model predictions were validated with experimental results from the literature. Additionally, we studied the effects of parameters, such as the radioactivity of 18F-FDG and the concentration and size of TiO2 nanoparticles, on the amount of ROS. With the help of this model, the doses of radionuclides and TiO2 nanoparticles of a particular size needed to suppress cancer cell growth can be optimized.
MATERIALS AND METHODS
Figure 1 shows a schematic description of PDT. The system consists of an 18F-FDG radionuclide (CR source), TiO2 nanoparticles (CR absorber), and cancer cells in a biologic fluid. The model primarily accounts for cell death by ROS generated from the activation of a photocatalyst by CR. Other mechanisms due to the radionuclide–nanoparticle interaction, such as ionization and excitation of the nanoparticle by ionizing radiation, are not considered. The effects of these mechanisms on the model are described later in this article. Moreover, the radiolysis of water is negligible with the used radioactivity value (32). Different parts of the integrated model are described next.
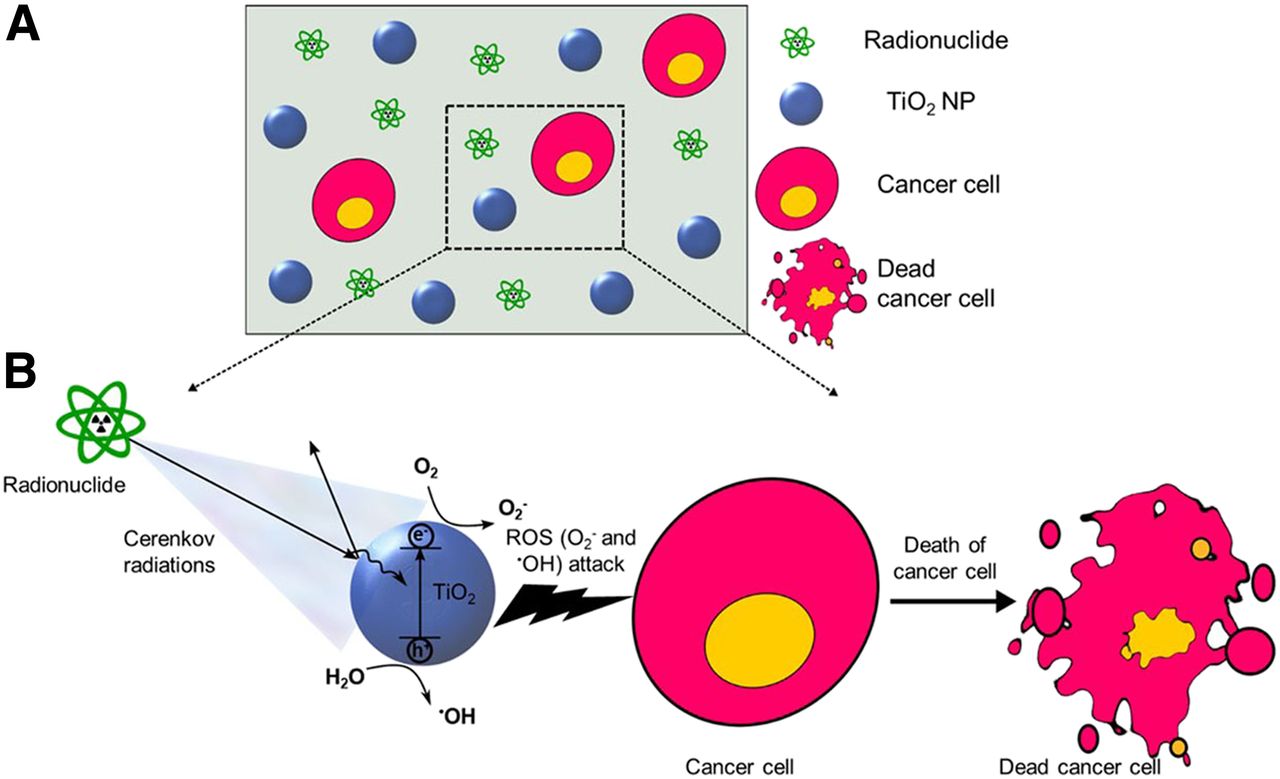
Schematic diagrams of system studied for CR-assisted PDT (A) and mechanism of ROS generation and cancer cell death from CR (B). NP = nanoparticle.
Cerenkov Physics
The number of TiO2 nanoparticles ( , number/cm3) is calculated from the concentration (
 , mol/L) and the size of the TiO2 nanoparticles as
 Eq. 1where
  is the density and
  is the volume of 1 TiO2 nanoparticle of diameter
  . 18F decays to stable 18O nuclei and releases 1 β-particle with a 97% probability, considered to be the source of CR. The number of subatomic β-particles
  generated per second is related to the radioactivity of the 18F-FDG radionuclide (A, Bq), which decreases with time (half-life of 18F, 109.7 min):
 Eq. 2TiO2 nanoparticles and 18F-FDG molecules are considered uniformly dispersed, and the average distance (
 ) between the point of generation of β-particles and TiO2 is determined by
 Eq. 3If the β-particle travels in the medium faster than the speed of light, it generates CR. The number of Cerenkov photons generated from a β-particle per second is described by Frank–Tamm equations (33):
 Eq. 4a
 Eq. 4band
 Eq. 4cHere, Nph is the number of Cerenkov photons per second, l is the β-particle path length, α is a structure constant (1/137), β is the ratio of the velocity of charged particles to the velocity of light in a vacuum (vp/c), n is the refractive index of the medium (assumed constant), λ is the wavelength,
  is the rest mass of the β-particle, and E is the energy of the β-particle. The Cerenkov photons originating from a β-particle move at an angle θ from the trajectory of the β-particle.
The number of photons is calculated at each step along the β-particle trajectory. As the β-particle travels, the loss in its energy is determined from the range–energy relationship (34), and the energy is updated at every step in its path. Because all of the β-particles have different initial energies and follow an energy spectrum, Equation 4a (for Nph) is weighted by the relative probability of a β-particle of a given energy being emitted by the radionuclide; then the values are summed across all of the energies. The probability of each energy was taken from the β-energy spectrum available at the Lund/LBNL nuclear data search website (35). The path length (l) depends on  , which is a function of
  , A, and
  . Therefore, Nph is a function of
  , A, dp, and λ. Once the CR is generated, it travels in the system and undergoes extinction (absorption and scattering) by TiO2 nanoparticles (explained in detail in the next paragraph). Radiation is absorbed by the TiO2 nanoparticles, leading to the generation of electron and hole pairs (Fig. 1B). Electrons and holes react with oxygen and water molecules adsorbed on the nanoparticle surface and produce ROS, superoxide, and hydroxyl radical, respectively. ROS further attack cancer cells in the system and destroy them.
Light Extinction
To quantitatively model the photon flux to TiO2 nanoparticles, we considered the case of 1 β-particle and 1 TiO2 particle, in which the β-particle travels at an angle φ from the line joining the origin of the β-particle and the TiO2 nanoparticle (Fig. 2A). The probability of a β-particle moving in the direction φ is considered in the calculation of the number of Cerenkov photons. Because Cerenkov photons in this system move at θ = 41° with respect to the β-particle, only photons generated within the  part of the path length (Fig. 2A) will intersect with TiO2 and be absorbed.
  and
and  are given by
 Eq. 5aand
 Eq. 5b
 depends on
  and
and  , but
, but  depends only on
  . In other words, the photons of interest are generated in a constant length segment (
 ), but the location of that length segment differs for all of the β-particles, depending on their distance from TiO2 and their trajectory (or angle φ). Once the photons are produced in the length segment
  , they travel in the medium and undergo scattering and absorption phenomena; therefore, the final number of photons reaching TiO2 is small. The photons produced at each step travel different distances (
 ) to reach TiO2 (Fig. 2B):
 Eq. 6Because photons move at an angle θ with respect to the path of the β-particle, there is an angular range of φ beyond which there is no influence of the β-particle on TiO2. In other words, Cerenkov photons do not reach TiO2. Thus, only the β-particle moving within the angular range (Fig. 2C) will contribute to the photon flux:
 Eq. 7The photon flux (number of photons/s⋅cm2) reaching the TiO2 nanoparticle is calculated at each step using Equation 8, taking into account the light extinction. Additionally, TiO2 absorbs only below 380 nm; thus, the photon flux of interest is defined as
  , with a λ of <380 nm:
 Eq. 8Extinction coefficient b is:
 Eq. 9a
 Eq. 9band
 Eq. 9cHere,
  and
and  are the efficiencies of absorption and scattering, respectively; m is the refractive index of TiO2 in water; and
  and
and  are the absorption and scattering coefficients, respectively. To account for all of the β-particles, their individual contributions to
  are summed. Once the photon flux to the TiO2 particle is obtained, the amount of ROS generation is determined.

Schematic diagram depicting model. (A) β-particle (red circle) moves (red arrow) at angle φ to line joining origin of β and TiO2 (hollow blue circle), and photon moves (turquoise arrows) at angle θ to β-trajectory. (B)  part of β trajectory, showing that number of photons and photon flux to TiO2 are calculated at each step with
  . (C) Angular range of interest (peach shading).
Catalytic Reactions and ROS Production
The photocatalytic generation of free radicals is described by the following reaction mechanism (21). TiO2 nanoparticles absorb Cerenkov photons and generate electron (e−) and hole (h+) pairs (Eq. 10a). There is a possibility that electrons and holes can recombine and produce heat (Eq. 10b). Alternatively, the electrons react with the oxygen molecules adsorbed on the TiO2 surface and produce superoxide radicals (Eq. 10c), and the holes react with water molecules and produce hydroxyl radicals (Eq. 10d): Eq. 10a
 Eq. 10b
 Eq. 10cand
 Eq. 10dThe rate of electron–hole pair formation (Eq. 10a) depends on the photon flux and the optoelectronic properties of the TiO2 nanoparticle. In Equations 10a–10d, k1 = 4.37 × 1010 cm−3, k2 = 7.14 × 10⁶ s−1, k3′ = k3
 ≈ 10−19 cm3/s, and k4′ = k4
 = 10−8 cm3/s are the rate constants of reactions taken from the literature (36,37).
  and
and  are the adsorption rate constants of O2 and H2O, respectively. [e−] and [h+] are the electron and hole concentrations (ions per unit surface area of the TiO2 nanoparticle), and
  and
and  (mM) are the concentrations of water and dissolved oxygen, respectively. These rates are used to derive the relationships between the concentration of ROS and the various parameters (
 , A, dp, λ, and φ). The rates of formation of both radicals (superoxide and hydroxyl) are given by
 Eq. 11aand
 Eq. 11bWe assume that the spatial dimension of the system is large enough that any change in the concentration of water resulting from Equations 10a–10d is not significant. Simultaneously, dissolved oxygen is assumed to be available, so that
  also remains constant. It is assumed that the adsorption equilibrium occurs instantaneously. Concentrations of electrons and holes are calculated by applying a mass balance to them:
 Eq. 12aand
 Eq. 12bAt steady state, the rate of generation of electrons (or holes) is equal to the rate of their consumption. Solving Equations 12a and 12b to derive an expression for the concentration of photogenerated electrons yields:
 Eq. 13where
  . Substituting the expression for [e−] from Equation 13 in the expression for the rate of ROS generation yields:
 Eq. 14In Equation 14, a and b are constants:
  and
and 
Hence, the rate of ROS generation depends on  ,
,  , and A. The equation is solved to determine a time variation in the ROS species concentration that can be correlated to tumor cell viability.
RESULTS
Figure 3A shows the CR spectrum, the number of Cerenkov photons/s with a radioactivity of 7.4 MBq/mL, and the concentration of 10-nm TiO2 nanoparticles (2.5 μg/mL). The spectrum followed the 1/λ2 relationship with wavelength, in agreement with the Frank–Tamm equation (Eq. 4). The Cerenkov photon yield per decay from the present study was 1.38 over the wavelength range of 400–800 nm, close to the reported value of 1.3 over the same range (28).
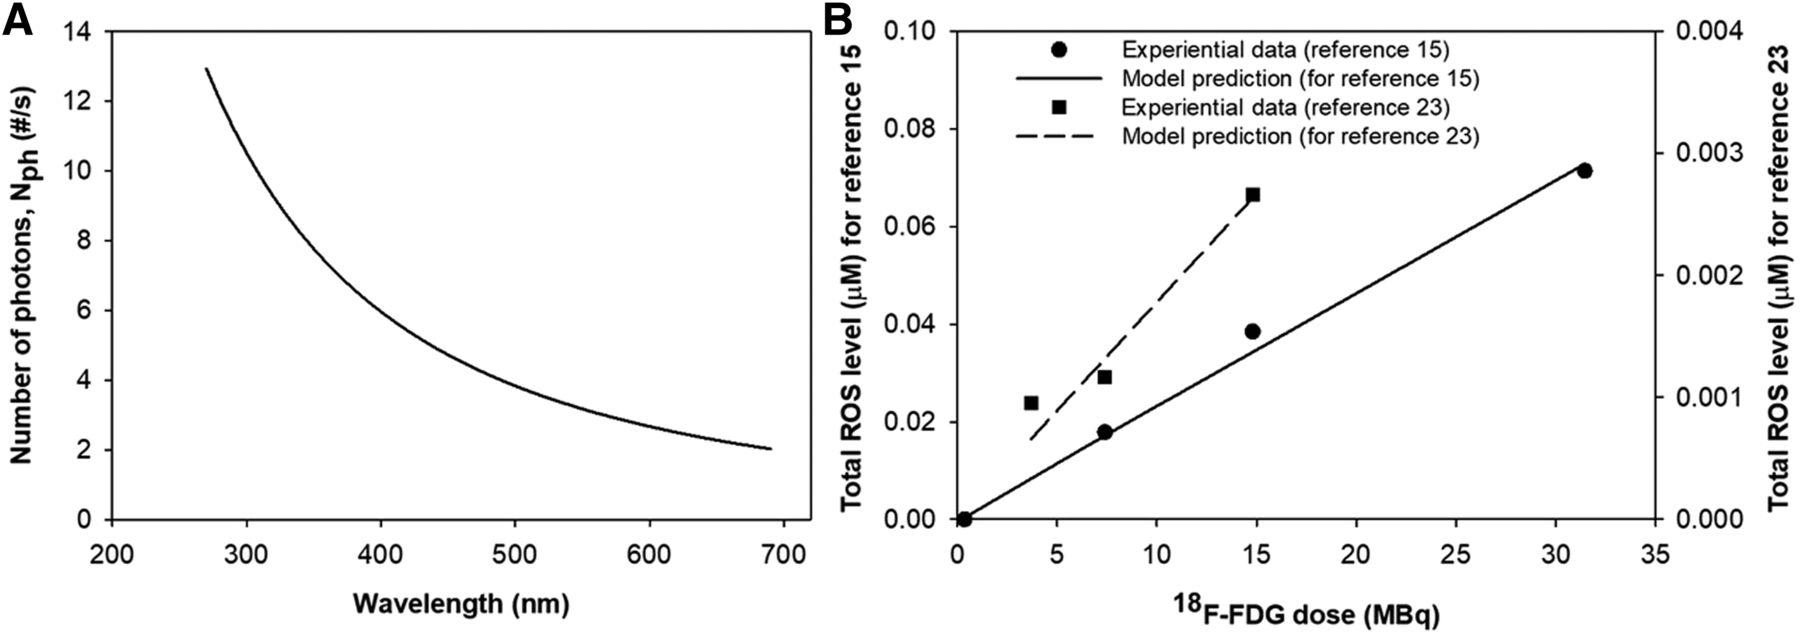
(A) Number of Cerenkov photons generated as function of wavelength. (B) Comparison of model predictions to experimental results reported by Kotagiri et al. (15) and Duan et al. (23). Parameters ( ,
,  , and A) taken from those studies were used to determine equivalent ROS concentration from model. # = numbers.
Next we discuss the role of various system parameters in ROS generation, with the goal of determining the specifications (concentration and size) of TiO2 and the radionuclide activity needed to terminate cancer cell growth.
Model Validation by Comparison to Experimental Results
A comparison of the model prediction to the experimental results from Kotagiri et al. (15) and Duan et al. (23) is shown in Figure 3B (23). Kotagiri et al. (15) used 25-nm TiO2 nanoparticles (concentration, 2.5 μg/mL) and 4 different radioactivity levels (31.45, 14.80, 7.40, and 0.37 MBq) (Fig. 3A). Duan et al. (23) used ≈30-nm TiO2 nanoparticles (concentration, 100 μg/mL) and 14.8, 7.4, and 3.7 MBq of 18F-FDG. Experimental results in both studies revealed that tumor cell viability (percentage of control) was a function of 18F-FDG dose (Figs. 3a and 3b in Kotagiri et al. (15) and Fig. 4b in Duan et al. (23)). Fractional decreases in tumor cell viability were then converted into equivalent intracellular ROS generation using a constant scaling factor (different scaling factors in the 2 studies but the same scaling factor for all data points in a particular study). For validation of the model, the experimental parameters mentioned earlier were used to calculate the ROS concentration from the model. ROS production predicted from the model (solid line, Fig. 3B) agreed well with the experimental data (solid symbols, Fig. 3B) from both studies.
Effect of Radioactivity (or Decay Time)
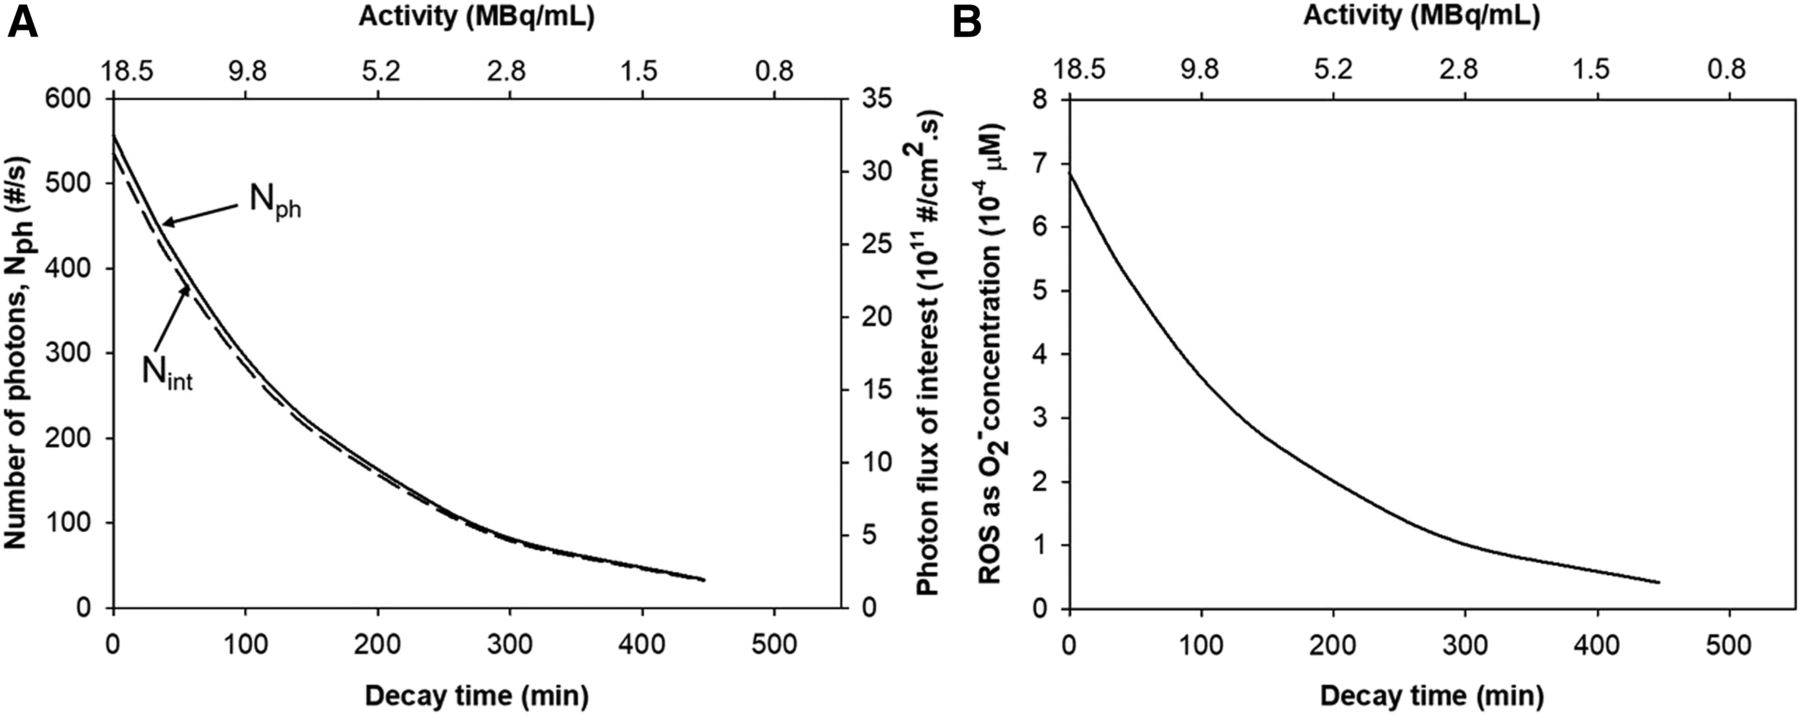
The effect of radioactivity was similar to the effect of decay time according to the following formula: Eq. 15Here,
  is the initial activity of the radionuclide, A is the activity at any time t,
  is the decay constant, and
  is the half-life. The radioactivity decreased exponentially with time; therefore, if the TiO2 nanoparticle size was kept constant at 10 nm and the TiO2 concentration was kept constant at 2.5 μg/mL, the number of photons and photon flux (Fig. 4A) and the ROS concentration (Fig. 4B) also decreased exponentially with decay time.

Effect of decay time (and radioactivity of 18F-FDG) on Nph (solid curve) and Nint (broken curve) (A) and on ROS concentration (B). # = numbers.
Effect of TiO2 Concentration
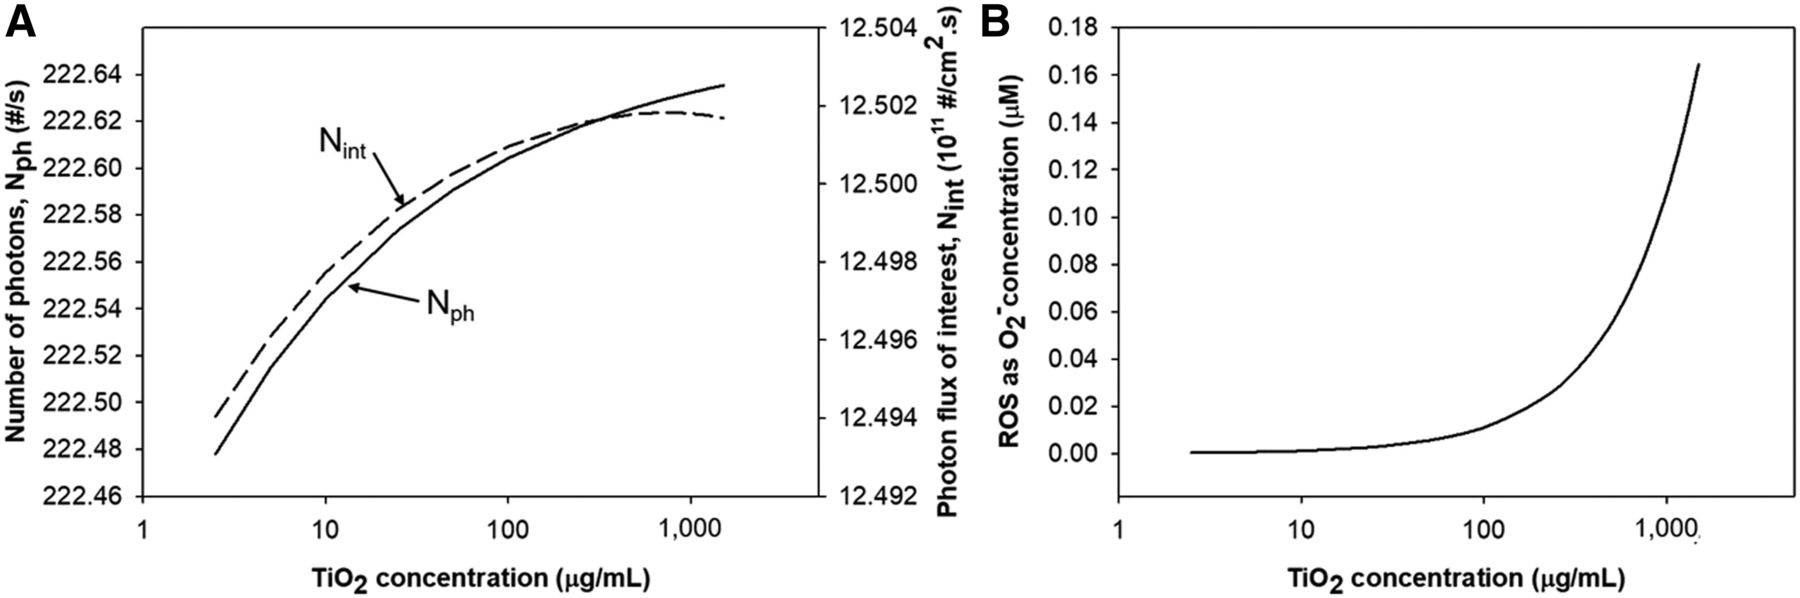
The effect of TiO2 concentration was investigated (Fig. 5) by keeping the  constant at 10 nm and A at 7.4 MBq/mL. As the
  increased, the number of TiO2 nanoparticles (
 ) increased and
  decreased. The important parameters were lengths
  and
and  (Eq. 5). An increase in the concentration led to a decrease in
  , whereas
  remained constant. The smaller the
  , the smaller the energy loss of the β-particle before the production of photons in the
  range. Hence, at higher
  , high-energy β-particles produced more photons, whereas at lower
  , low-energy β-particles produced fewer photons over the same lAB range.

Effect of TiO2 concentration on Nph (solid curve) and Nint (broken curve) (A) and on ROS concentration (B). # = numbers.
The photon flux followed a trend similar to that of the number of photons because of the constant size of the TiO2 nanoparticles. Overall, both  and
and  increased with an increase in concentration (Fig. 5A). Additionally, more TiO2 nanoparticles were present to absorb CR, increasing the ROS yield (Fig. 5B). Mathematically, according to Equation 14, the ROS concentration was proportional to the number of TiO2 nanoparticles and the square root of the photon flux; hence, ROS production rose with
  .
.
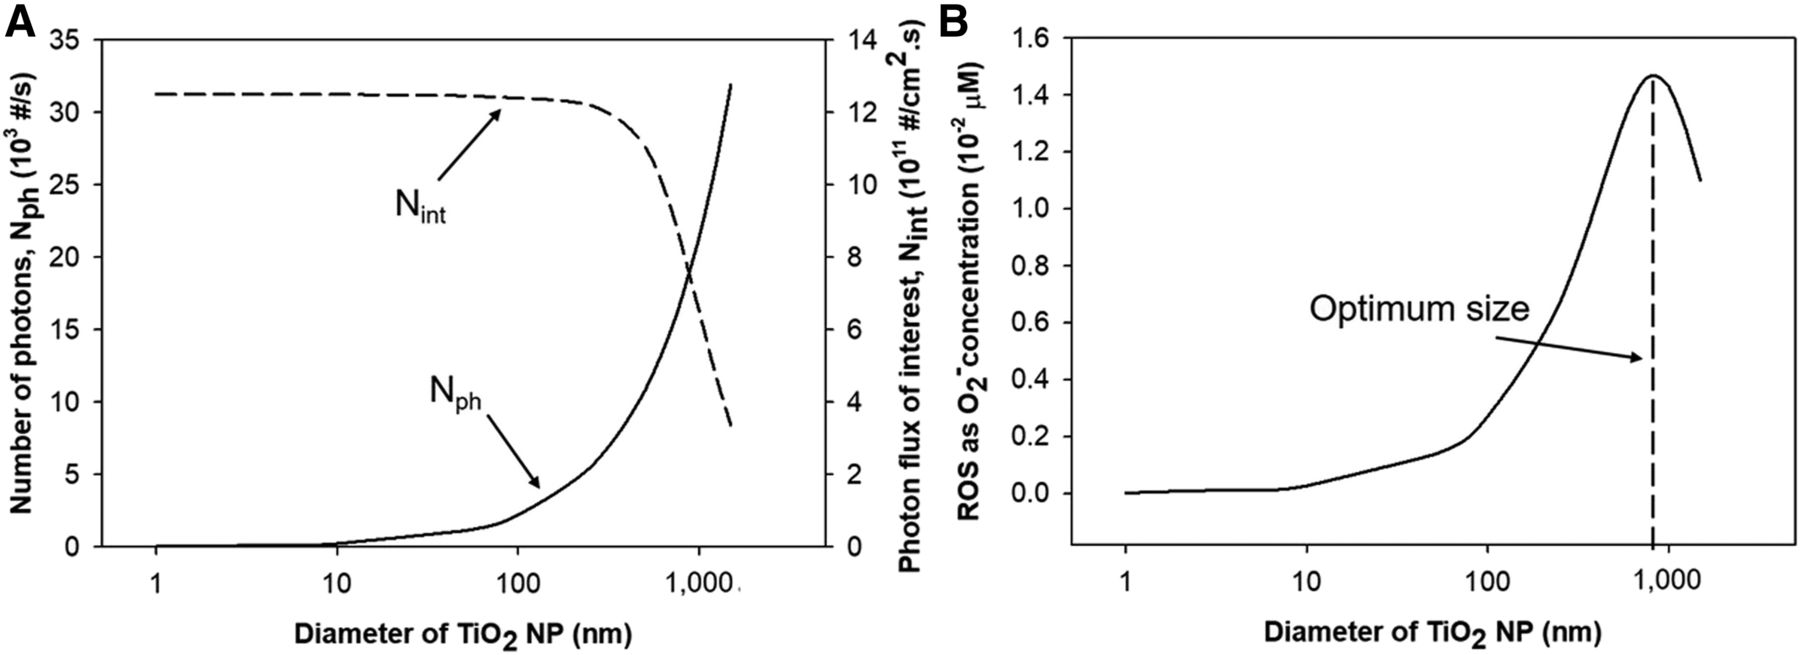
Effect of TiO2 Nanoparticle Size
Figure 6A shows the effect of nanoparticle size ( ) on
) on  and
and  .
.  and A were kept constant at 2.5 μg/mL and 7.4 MBq/mL, respectively. As the size increased,
  decreased and
  increased. Therefore, the larger the
  , the larger the number of Cerenkov photons. If
  were larger, then the
  segment would appear at a greater distance from the origin of the β-particle, so the β-particle would have less energy in the
  range and hence would produce fewer photons. According to Equation 5, as
  increased,
  increased by a larger extent than
  ; hence,
  increased, but
  decreased because of its inverse relationship with
  (Eq. 8).

Effect of TiO2 nanoparticle (NP) size on Nph (solid curve) and Nint (broken curve) (A) and on ROS concentration (B). # = numbers.
Interestingly, the effect on ROS concentration was not monotonous (Fig. 6B); the ROS concentration first increased with  , peaked at about 800 nm, and then decreased. According to Equation 14, the ROS concentration was directly proportional to
  ,
,  ,
,  , and absorption efficiency (
 ). With an increase in
  ,
,  and
and  both decreased, as mentioned earlier, but did not play a significant role compared with the size-dependent optical (absorption and scattering) and electrical properties of the TiO2 nanoparticles. The absorption efficiency of the nanoparticles increased with the size. Conversely, the separation between e− and h+ was efficient at smaller sizes, leading to favorable charge carrier dynamics. Therefore, the optical and electrical properties of TiO2 (photoexcitation and e−–h+ generation) dominated at particle sizes of less than 800 nm, resulting in considerable e− and h+ generation and less recombination. However, with increasing sizes, the properties of the TiO2 nanoparticles became similar to those of the bulk TiO2; that is, the recombination of the charge carrier became much easier, and the photoactivity thus was dominated by the available specific surface area of the particles (21).
DISCUSSION
The CR spectrum from the model followed the Frank–Tamm equation (number of photons α 1/λ2), and the number of photons generated also matched that in a previous report (28). The model was compared with 2 different experimental studies (15,23). The experiments revealed a change in tumor cell viability as a function of the 18F-FDG dose; this change was then converted into the ROS concentration using a constant scaling factor, and this ROS concentration was compared with the ROS concentration predicted from the model using the experimental parameters from those studies. The scaling factor was needed because the studies did not provide the amount of ROS generation; however, the decrease in cell viability is directly correlated to the ROS production. Additionally, although the scaling factors in the 2 studies were different because of the use of different types of TiO2 nanoparticles and cell lines, the same scaling factor was used for all of the data points in a particular study. The model predictions agreed well with the experimental data from both studies and revealed similar trends, thus indicating the robustness of the model. The ROS concentrations in the 2 studies could not be cross-compared because of the different types of TiO2 nanoparticles used in those studies and their distinct optoelectronic properties. A comparison to additional data would further enhance the validity of the model; however, because of the novel and innovative nature of this methodology, not many studies have reported such data.
Having validated the model, we tested its capabilities in a series of design simulations to illustrate its potential use in guiding PDT. The effects of radionuclide dose (A), TiO2 concentration ( ), and size (
 ) on the amount of ROS generation were studied.
  generation and ROS concentration rose with A. This feature will provide guidance on the dose of a radionuclide and the time interval of injection for continued therapeutic effects.
  also directly affected ROS production. The higher the concentration, the larger the
  and the
  . Furthermore, more TiO2 nanoparticles were present to absorb the photons; therefore, more ROS was produced at a higher TiO2 concentration. The upper limit of the concentration was ultimately constrained by the distance between the β-particles and TiO2, which tended toward zero at very high
  , and the cytotoxicity of the TiO2 particles. There has been only 1 study (16) on the effect of photocatalyst concentration on cancer cell viability. In that study, cell viability was reported to decrease (as ROS concentration increased) linearly with an increase in the photocatalyst concentration, supporting the model predictions.
The effect of  was not monotonous. Although
  decreased with an increase in
  , the amount of ROS increased at smaller particle sizes, peaked at about 800 nm, and then decreased. Therefore, there is an optimum size of TiO2 particles for producing the highest ROS concentration. However, the optimal size of 800 nm observed in the model might not be practical for delivering particles to a tumor. Therefore, a balance should be sought by decreasing the size and increasing the concentration of TiO2 particles. Until now, there has been no study on the effect of the size of TiO2 nanoparticles on the number of Cerenkov photons and cancer cell viability (ROS production). However, the size of nanoparticles is an important parameter and affects their reactivity, as shown in the literature as well (21,38).
The model can be used easily for any kind of nanoparticle and radionuclide to determine the CR-assisted production of ROS. There are 4 other important points to consider for future work. First, the refractive index of the medium changes with the addition of a radionuclide and nanoparticles, and there is no direct formula to account for the change. A higher refractive index decreases the threshold energy for β-particles to produce CR and, therefore, more photons are generated. Second, the mechanism of ROS generation is complex. Because the present study is the first—to our knowledge—to show a detailed pathway of cancer cell death caused by radionuclides and semiconductor nanoparticles, we described a simple reaction mechanism for ROS generation. However, other complex reaction and ROS products (H2O2 and singlet oxygen) have been reported in the literature (36,37). Third, more experimental investigation is needed to provide data for continued model validation. Fourth, the presence of other mechanisms, such as direct excitation and ionization of nanoparticles by ionizing radiation, may also contribute to ROS generation, as reported in previous studies (24,39). Direct excitation of nanoparticles was demonstrated by measuring the radiance output of nanoparticles in the presence of radionuclides that emitted β-particles with less energy than the Cerenkov threshold. The enhancement of the emitted radiance output compared with that in the system without nanoparticles implied the direct excitation of nanoparticles with ionizing radiation. Ionization of nanoparticles by ionizing radiation was determined by measuring the characteristic x-rays produced during ionization (24). For a system of 18F-FDG radionuclides with activity (<30 MBq) that emits mainly the β+ and TiO2 nanoparticles considered in the present work, these mechanisms play small roles. However, they are significant when the radioactivity is high and when nanoparticles with high-atomic-number elements (e.g., Eu2O3, Gd2O3) are used.
To the best of our knowledge, there has not been any study on the theoretic determination of the contributions of these mechanisms to ROS generation. It will be of interest to determine the contribution of each individual mechanism to ROS generation and PDT; such a determination was beyond the scope of the present study. However, the model described in the present study still quantifies the contribution of CR to ROS generation and provides a fair idea about the size and concentration of TiO2 nanoparticles to be used for the effective suppression of cancer cells. Nonetheless, it is also important to experimentally measure ROS generation in this kind of system. The consideration of other mechanisms (described earlier) will affect the scaling factor used to compare the model prediction of the ROS level with the experimental results, and the scaling factor will change because the model will then include ROS generated from these mechanisms.
CONCLUSION
We integrated Cerenkov physics, light scattering, and photocatalytic reaction engineering to understand the detailed mechanism of ROS production (directly attributed to cell death) in the presence of radionuclides and TiO2 semiconductor nanoparticles. CR is produced when a β-particle (the decay product of a radionuclide) moves at a very high speed in the medium. CR, which is dominant in the UV region, is absorbed by the locally present photoactive TiO2 nanoparticles—resulting in the generation of e− and h+ pairs. The charge carriers then react with the medium and produce ROS, which result in cell death. Furthermore, different system parameters (size of TiO2 nanoparticles, concentration of TiO2, and radioactivity of the nuclide) influence the number of Cerenkov photons and ROS generation. The results suggested an optimum TiO2 particle size for maximum ROS production as a result of the dependence of light absorption, scattering efficiencies, and charge separation on the particle size. These models can also be used for other types of radionuclide and semiconducting materials and can provide a framework for developing and deploying cancerous tumor–mitigating strategies.
DISCLOSURE
Partial support for this work was provided by NIH grant U54CA199092 to the Center for Multiple Myeloma Nanotherapy (CMMN). Shalinee Kavadiya acknowledges support from the Solar Energy Research Institute for India and the U.S. (SERIIUS), funded jointly by U.S. Department of Energy subcontract DE AC36-08G028308 (Office of Science, Office of Basic Energy Sciences, and Energy Efficiency and Renewable Energy, Solar Energy Technology Program, with support from the Office of International Affairs) and Government of India subcontract IUSSTF/JCERDC-SERIIUS/2012 (dated November 22, 2012). No other potential conflict of interest relevant to this article was reported.
Footnotes
Published online Oct. 5, 2018.
- © 2019 by the Society of Nuclear Medicine and Molecular Imaging.
REFERENCES
- Received for publication June 4, 2018.
- Accepted for publication September 19, 2018.


Jump to section
Related Articles
Cited By...
- No citing articles found.