


Abstract
The aim of this study was to associate and predict B-rapidly accelerated fibrosarcoma valine 600 (BRAFV600) mutation status with both conventional and radiomics 18F-FDG PET/CT features, while exploring several methods of feature selection in melanoma radiomics. Methods: Seventy unresectable stage III–IV melanoma patients who underwent a baseline 18F-FDG PET/CT scan were identified. Patients were assigned to the BRAFV600 group or BRAF wild-type group according to mutational status. 18F-FDG uptake quantification was performed by semiautomatic lesion delineation. Four hundred eighty radiomics features and 4 conventional PET features (SUVmax, SUVmean, SUVpeak, and total lesion glycolysis) were extracted per lesion. Six different methods of feature selection were implemented, and 10-fold cross-validated predictive models were built for each. Model performances were evaluated with areas under the curve (AUCs) for the receiver operating characteristic curves. Results: Thirty-five BRAFV600 mutated patients (100 lesions) and 35 BRAF wild-type patients (79 lesions) were analyzed. AUCs predicting the BRAFV600 mutation varied from 0.54 to 0.62 and were susceptible to feature selection method. The best AUCs were achieved by feature selection based on literature, a penalized binary logistic regression model, and random forest model. No significant difference was found between the BRAFV600 and BRAF wild-type group in conventional PET features or predictive value. Conclusion: BRAFV600 mutation status is not associated with, nor can it be predicted with, conventional PET features, whereas radiomics features were of low predictive value (AUC = 0.62). We showed feature selection methods to influence predictive model performance, describing and evaluating 6 unique methods. Detecting BRAFV600 status in melanoma based on 18F-FDG PET/CT alone does not yet provide clinically relevant knowledge.
See an invited perspective on this article on page 1543.
Melanoma is the most aggressive and deadliest type of skin cancer. It belongs to one of the most common cancers worldwide, and its incidence is rising (1). Approximately 50% of melanomas contain a B-rapidly accelerated fibrosarcoma (BRAF) mutation, of which the most common is BRAF valine 600 (BRAFV600). The BRAF mutation causes constitutive activation of the mitogen-activated protein kinase pathway, which drives tumor growth, cell proliferation, and metastasis (2,3). BRAF mutation determination is the decisive factor for commencing first-line BRAF inhibition in metastatic melanoma: a pivotal moment in clinical decision making. Similarly crucial are staging, restaging, and follow-up in metastatic melanoma, which is reliant on 18F-FDG PET/CT imaging (2). BRAF mutation prediction based on PET/CT could combine these 2 clinical crossroads. In melanoma, the potential of PET/CT-based prediction has been mainly explored in conventional PET features and visual assessments, whereas current developments in precision medicine increase the need for in-depth tumor characterization (4). Unlocking this information traditionally would necessitate extensive pathologic research of all individual tumor lesions: an invasive manner to determine each lesion’s biologic constitution. Radiomics analysis provides the ability to extract a possibly infinite amount of quantitative imaging features representing tumor characteristics, circumventing these negatives while venturing beyond. In colorectal and lung cancer, several PET radiomics features have been associated with disease-specific mutations, with area under the receiver operating characteristic curve (AUC) of their mutation prediction models ranging between 0.33 and 0.79 (5–7).
Between performing a scan and model building, several steps are required in radiomics analysis. An important challenge in the current state of radiomics analysis is the small patient sample size combined with infinite possibilities for image feature extraction. Feature selection and reduction is therefore necessary to avoid false-positive outcomes. Within previous research in other cancer types, a large variety of methods prevail, from preselection and prereduction to statistical corrections after analysis (8). Since feature selection impacts which features are ultimately chosen for a prognostic or diagnostic model, a uniform approach would be ideal. No previous PET radiomics research in melanoma is available; therefore, it is unclear how these methods would perform in melanoma. The aim of this study was to associate and predict BRAFV600 mutation status with both conventional and radiomics 18F-FDG PET/CT features, while exploring several methods of feature selection in melanoma radiomics.
MATERIALS AND METHODS
Patients
Melanoma patients receiving BRAF inhibitors or immunotherapy were searched from June 2014 until March 2017. Eligible patients were the first consecutive 35 BRAFV600 mutated or 35 BRAF wild-type patients. Inclusion criteria were unresectable stage III–IV pathology-confirmed melanoma, known BRAFV600 mutation status, and measurable disease on baseline 18F-FDG PET/CT. BRAFV600 mutation status was determined by mutation analysis. Patients with rat sarcoma (RAS) mutations and systemic therapy (chemotherapy, BRAF inhibitors, or immunotherapy) 3 mo before baseline PET/CT were excluded (Fig. 1 provides the other exclusion criteria). Radiotherapy and any invasive local intervention within 3 mo before baseline PET/CT were registered. The institutional review board approved this retrospective study, and the requirement to obtain informed consent was waived.
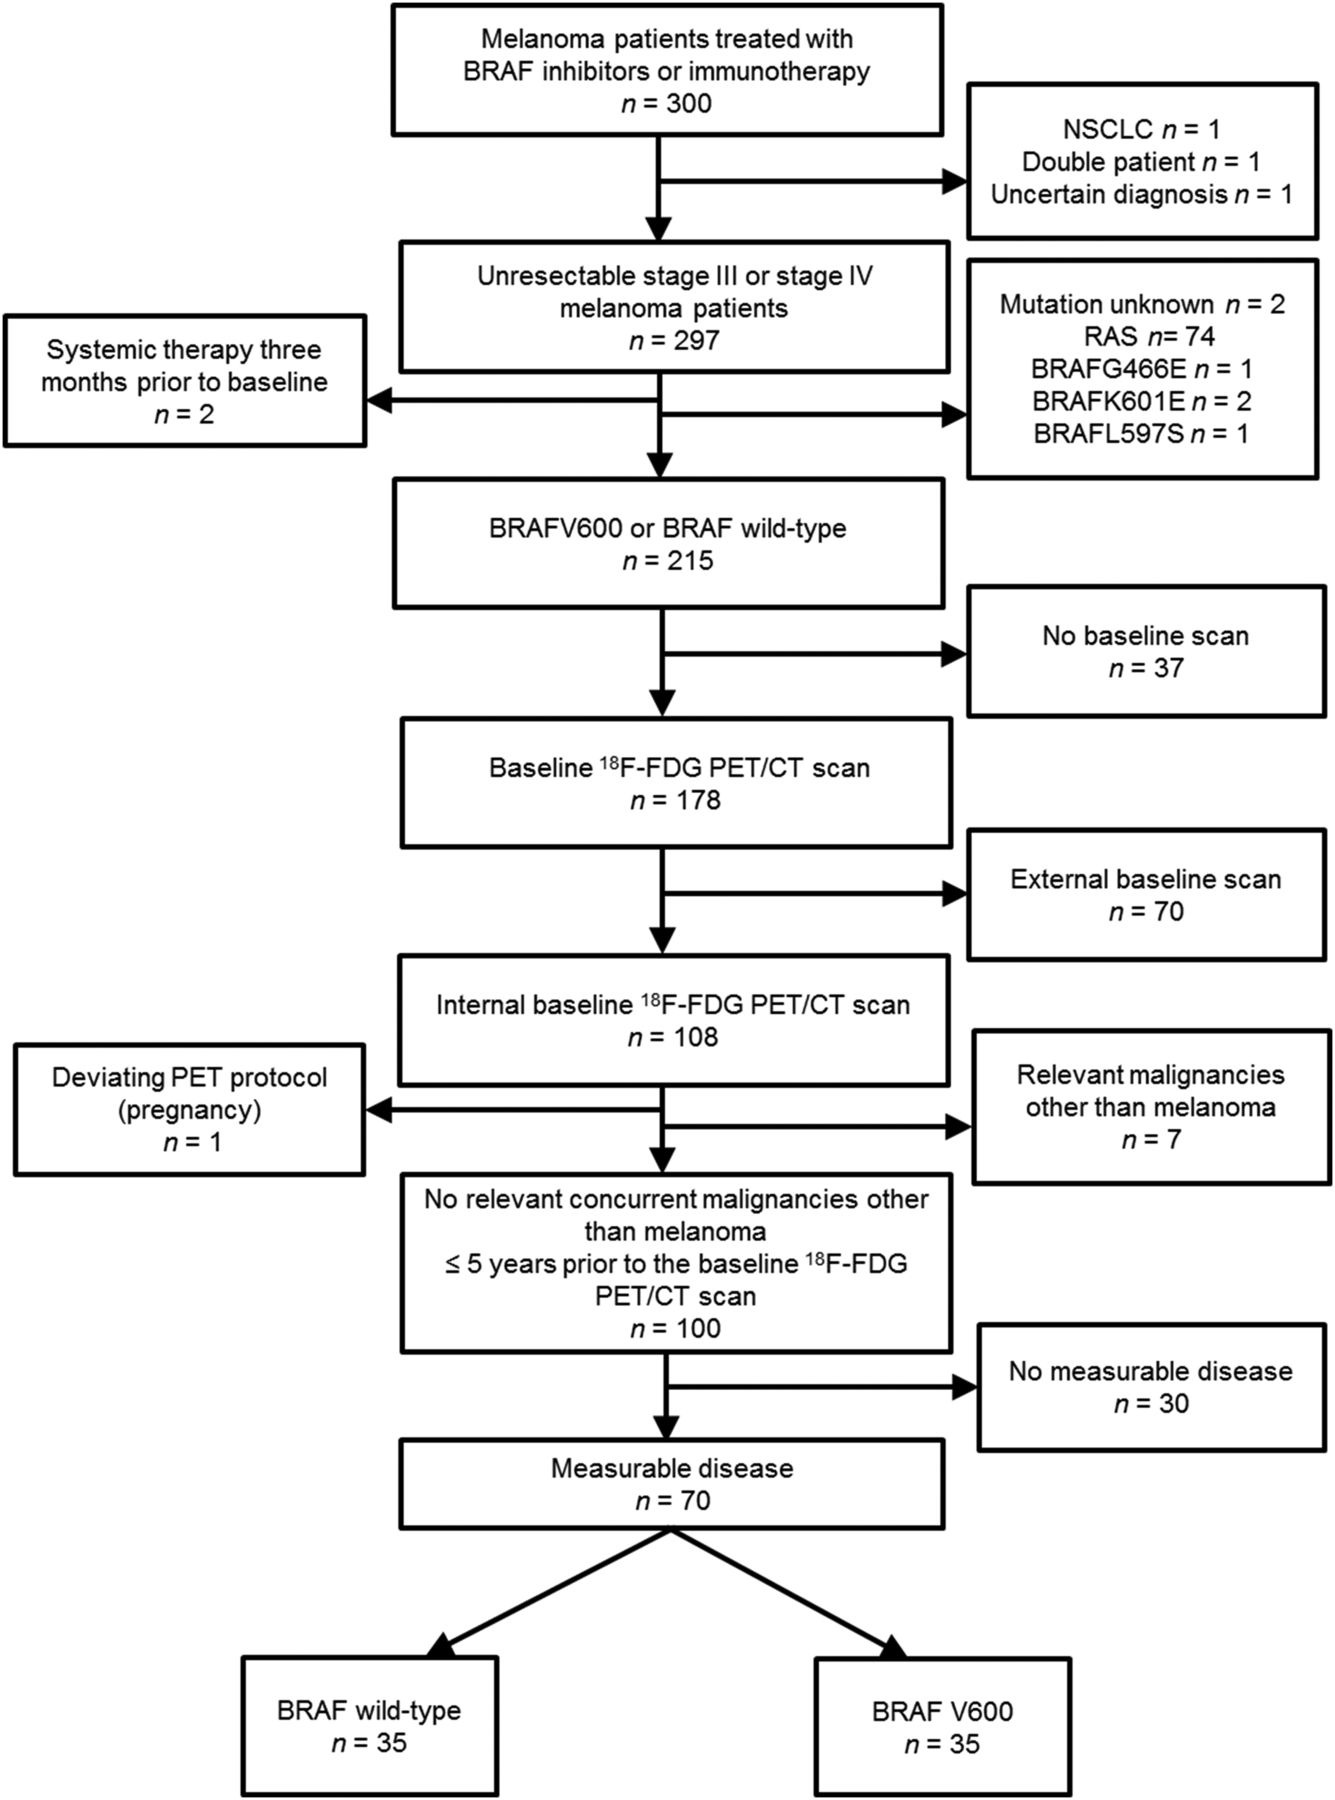
Patient selection flowchart.
18F-FDG PET/CT Imaging
18F-FDG PET/CT imaging was performed 60 min after intravenous injection of 190–260 MBq of 18F-FDG after fasting for at least 6 h. Patients’ injected dose was body mass index–based, and blood glucose levels before injection were required to be less than 200 mg/dL. Patients were scanned on a cross-calibrated (with calibration phantoms) Phillips Gemini TF time-of-flight 16 or Phillips Gemini TF big-bore PET/CT scanner, with 1–3 min per bed position. The systems were from the same vendor and have the same type of acquisition and image reconstruction methods, and the same settings were used. PET images were reconstructed using BLOB ordered-subsets time-of-flight with 3 iterations, 31 subsets, no filter, voxel size of 4 × 4 × 4 mm, slice thickness of 4 mm, and image matrix of 144 × 144 pixels. This resulted in a postreconstruction resolution at 1 cm after line-of-response construction of 4.3 mm. Low-dose CT scans were performed for attenuation correction and anatomic correlation (40 mAs, 140 keV, 5-mm slices).
Image and Quantitative PET/CT Analysis
Tumor lesion size was measured in the axial plane on the concurrent low-dose CT scan or on a baseline diagnostic CT or MRI scan acquired within 1 mo from the baseline PET/CT using OsiriX MD (Pixmeo Sarl, version 7.0.3). Measurable disease was defined by lesions of at least 2 cm or (if the tumor was indiscernible on CT) an equivalent metabolic active tumor volume (MATV) of at least 4.2 cm3, in line with PERCIST 1.0 to avoid partial-volume effects (9). Of the measurable lesions in each patient, the 3 lesions with the highest SUVmax per organ were considered target lesions. Target lesions were delineated by a threshold of 50% of the SUVmax without background correction (9). The specified body organ regions were according to melanoma’s metastasis pattern: lymph nodes, lung, liver, bone, subcutaneous, intramuscular, and other. Lesions with prior radiotherapy were excluded as target lesions. Quantitative PET/CT analysis was performed using in-house software tools (Fig. 2) (10,11).
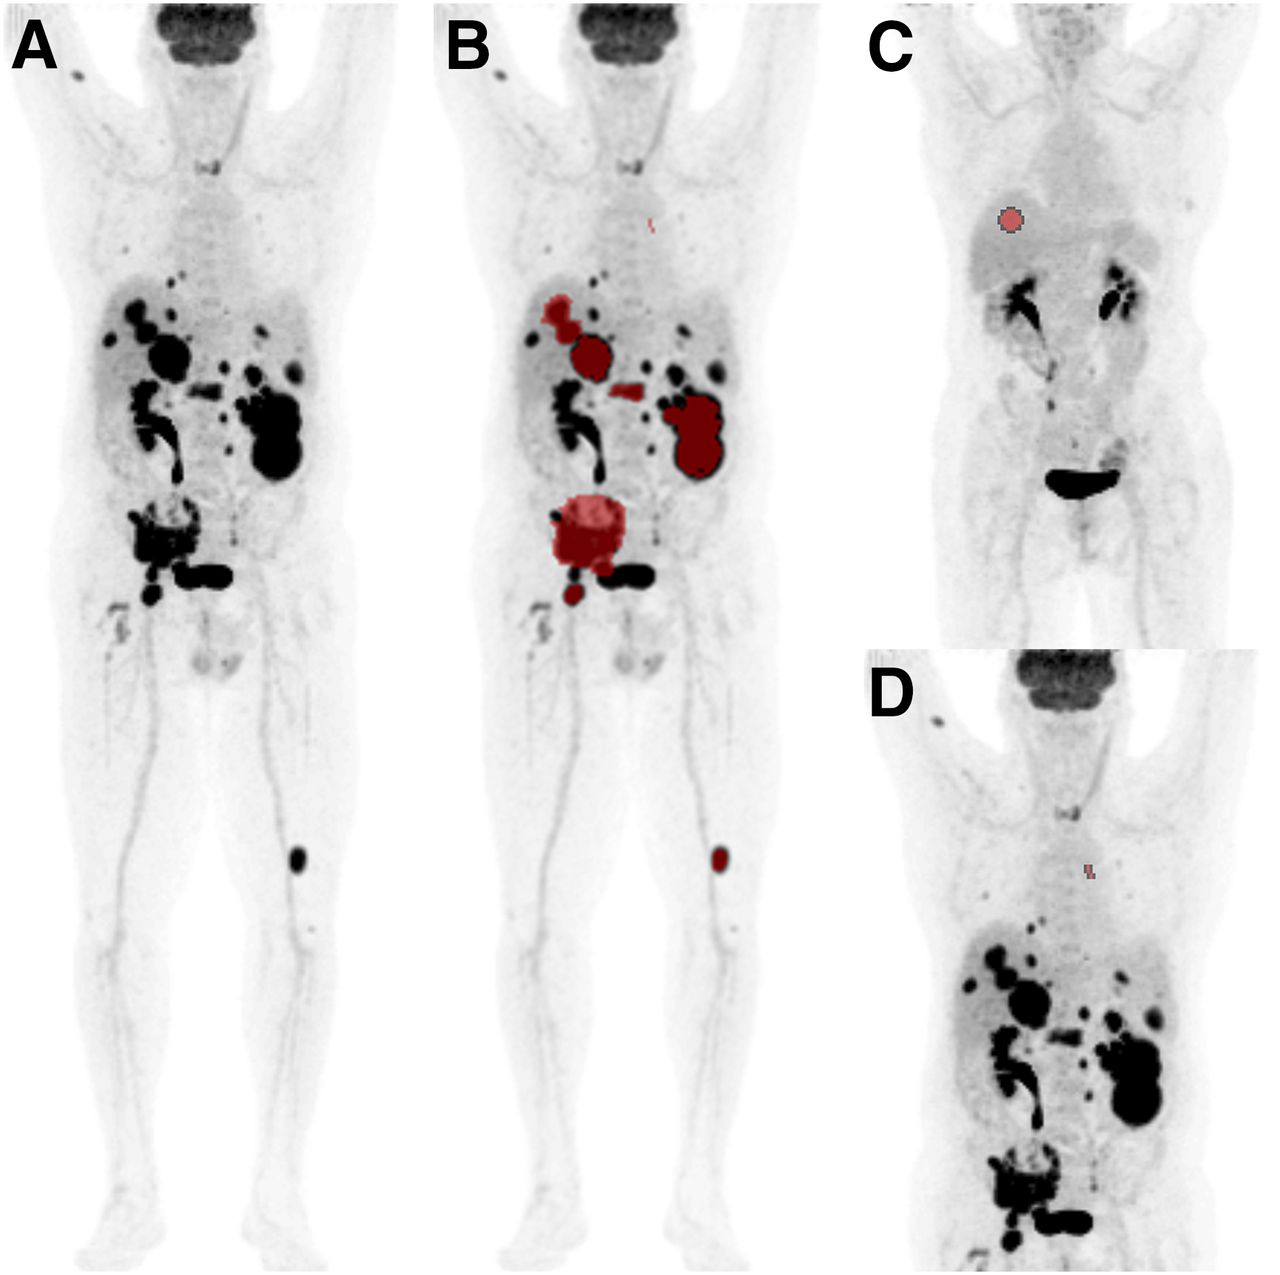
Anterior maximum-intensity-projections (A) with semi-automatic delineation of target lesions (B), liver (C), and blood pool (D).
For radiomics analysis, 480 features were extracted, pertaining to morphology (n = 22), local intensity (n = 2), intensity-based statistics (n = 18), intensity-volume histogram (n = 6), intensity histogram (n = 24), and texture (n = 408) (Supplemental Table 1; supplemental materials are available at http://jnm.snmjournals.org). Texture features were based on the gray level co-occurrence matrix (GLCM), gray level run length matrix (GLRLM), gray level size zone matrix (GLSZM), gray level distance zone matrix (GLDZM), neighborhood gray tone difference matrix (NGTDM), and neighboring gray level dependence matrix (NGLDM) with up to 8 matrix calculation methods. The features underwent 2 × 2 × 2 mm voxel resampling and discretization with a fixed bin size of 0.25 SUV (10). All image-processing and feature calculations conform with the image biomarker standardization initiative (12). Conventional PET features measured per lesion were MATV, SUVmax, SUVpeak, SUVmean, and total lesion glycolysis (TLG, defined as SUVmean × MATV). Uptake interval times, liver and blood pool SUVmean were measured (13).
Statistical Analysis
A sample size calculation was performed combining a mean melanoma SUVmax from prior studies (14) and an expected biologically relevant difference of at least 20% in SUVmax between the mutated and nonmutated groups. This expected difference was based on a minimum biologically relevant SUV difference (9,15). Assuming that mean SUVmax in the BRAF wild-type group is 7.6 and SD of SUVmax is 5.4, with 60 patients and 3 lesions per patient, a difference between the 2 groups of at least 20% can be detected with a power of 80%. Such a difference corresponds to a mean SUVmax of at least 9.1 in the BRAFV600 group. These calculations are based on a mixed-effects model with the logarithm of SUVmax as the outcome. All continuous variables were assessed for normality combining visual (histograms) and statistical inspection (Shapiro–Wilk test). Normally distributed patient characteristics were compared between BRAFV600 and BRAF wild-type groups with an independent-samples t test. Not-normally distributed variables were log-transformed to achieve normality. If the transformation did not solve the distributional issue, a Mann–Whitney U test was conducted. Categoric patient characteristics and target lesion distribution were compared between groups with a Pearson χ2 test or Fisher exact test.
Conventional PET features were compared between patient groups with mixed models, to account for multiple lesions from the same patient. The SUV metrics, TLG, MATV, and longest diameter were analyzed with linear mixed models, whereas prior local intervention was analyzed with generalized linear mixed models. Mutation status was used as a fixed effect, and patient was used as a random effect in the models. To facilitate interpretation of the mixed-model analysis, the original means instead of the log-transformed values were reported. To predict the BRAFV600 mutation with the conventional PET features, first the best binary logistic regression model of each feature and combination was determined, and then it was used for the final binary logistic regression and random forest (RF) model.
Six different methods for radiomics feature selection were applied: a correlation matrix of all features (method 1); a correlation matrix of all features with the conventional PET features SUVpeak, MATV, and TLG (method 2); a principal-component analysis (PCA) (method 3); selection of features from prior studies (method 4); a penalized binary logistic regression analysis of all features (method 5); and an RF model of all features (method 6) (16). In method 1, correlation between any 2 features was calculated, and from highly correlated pairs (Spearman correlation > 0.75) the one feature that had an average highest correlation with all other features was removed. Method 2 followed the same principle, except feature reduction was first based on all radiomics features with SUVpeak, TLG, and MATV and then on the remainder of features. Method 3 began as method 1 did, but with a threshold Spearman correlation higher than 0.85, considering its predictive nature. The residual features were standardized based on mean = 0 and SD = 1 for entry into the PCA, a dimensionality reduction method. PCA, using mathematic projection, transforms the data into a set of orthogonal variables called principal components, which get ranked based on the data variance along them. The highest data variance is represented by the first principal component, whereas the subsequent ones achieve the highest possible variance orthogonal to the prior. From the first 10 principal components, the 20 most important features per each were extracted. Finally, the 20 most important features over all 10 principal components were determined. The number of features was based on the standard statistical practice of approximately 10 observations per radiomics feature in line with Collarino et al. and Chalkidou et al. (17,18). Since we had 179 lesions, approximately up to 20 features could be included in a model. In method 4, 10 features repeatedly reported as robust in prior studies (10,19–23) were selected, focusing on the best test–retest repeatability. Method 5 was built with all radiomics features; regression coefficients were penalized using the elastic net regularization correcting for group effect (collinearity) and removing less relevant coefficients (24). Method 6 was construed from all radiomics features, without recursive feature elimination. RF is an ensemble method for building prediction models and is especially useful for high-dimensional data for which the number of features exceeds the number of observations. RF builds several decision trees and eventually averages the results. Here, 1,000 trees were used for predicting the mutation class, and 21 variables were randomly sampled at each split.
After feature selection methods 1–4, the final features were inserted in a binary logistic regression model and RF model to predict the BRAFV600 mutation. All models were cross-validated via 10-fold cross-validation repeated 10 times, and their respective AUCs were composed. Statistical analysis was performed with SPSS (IBM, version 22.0) and R software (version 3.4.4) with, respectively, the nonlinear mixed effects and linear mixed effects 4 package for the linear mixed model and generalized linear mixed model (25,26). Caret and RF packages were used for the RF models, and generalized linear models with lasso or elastic net regularization were used for the penalized binary logistic regression (27–29). A P value of less than 0.05 was considered significant.
RESULTS
Seventy patients were identified, 35 patients per BRAFV600 or BRAF wild-type group (Fig. 1). Patient characteristics are listed in Table 1. Per patient, 1–10 target lesions were analyzed. The BRAFV600 and BRAF wild-type groups showed no statistically significant differences in SUV metrics, MATV, TLG, longest diameter, or prior local intervention (Table 2). SUV metrics and TLG stratified per organ region showed the same result (Supplemental Table 2). The liver and blood pool SUVmean were tested for confounding, which was not found (data not shown). The best conventional PET features prediction model was achieved by inserting all 5 features: SUVmean, SUVmax, SUVpeak, TLG, and MATV (Fig. 3A; Supplemental Table 3A). Radiomics analysis was performed on 176 lesions (3 lesions from scans with a different voxel matrix were excluded). Four of the 480 radiomics features maintained a value of 1 for all lesions and were removed, which were from the neighboring gray level dependence matrix: dependence count percentage (averaged over 2D slices and directions), dependence count percentage (3D volume), dependence count percentage (2D merged over all slices), and from the intensity histogram: minimum. After removal of high correlations in method 1, 23 features remained from the 476 with AUCs of 0.55 (Fig. 3B; Supplemental Table 3B). Method 2 resulted in 26 features after removal of high correlations with AUCs of 0.54–0.56 (Fig. 3C; Supplemental Table 3C). In method 3 the correlation-based prereduction resulted in 49 features, which underwent PCA. The first 10 principal components explained about 80% of the variance (Supplemental Fig. 1). Twenty of the most important features were selected from them with AUCs of 0.57–0.59 (Fig. 3D; Supplemental Table 3D). The following 10 features were selected based on prior studies: entropy, joint entropy (GLCM), inverse different moment (GLCM), inverse difference moment normalized (GLCM), difference entropy (GLCM), sum average (GLCM), sum entropy (GLCM), high gray level run emphasis (GLRLM), short run emphasis (GLRLM), and zone percentage (GLSZM) (10,19–23). The multiple aggregation methods used in our dataset meant this translated to 52 features, which were reduced back to 10 by removing features highly correlated with entropy, resulting in AUCs of 0.60–0.62 (Fig. 3E; Supplemental Table 3E). Method 5 selected 17 features (Supplemental Fig. 2), and the 20 most important features are listed for method 6; both had AUCs of 0.62 (Figs. 3F–3G; Supplemental Fig. 3).
Patient Characteristics and Target Lesion Distribution
Conventional PET Features and BRAFV600 Mutation Association
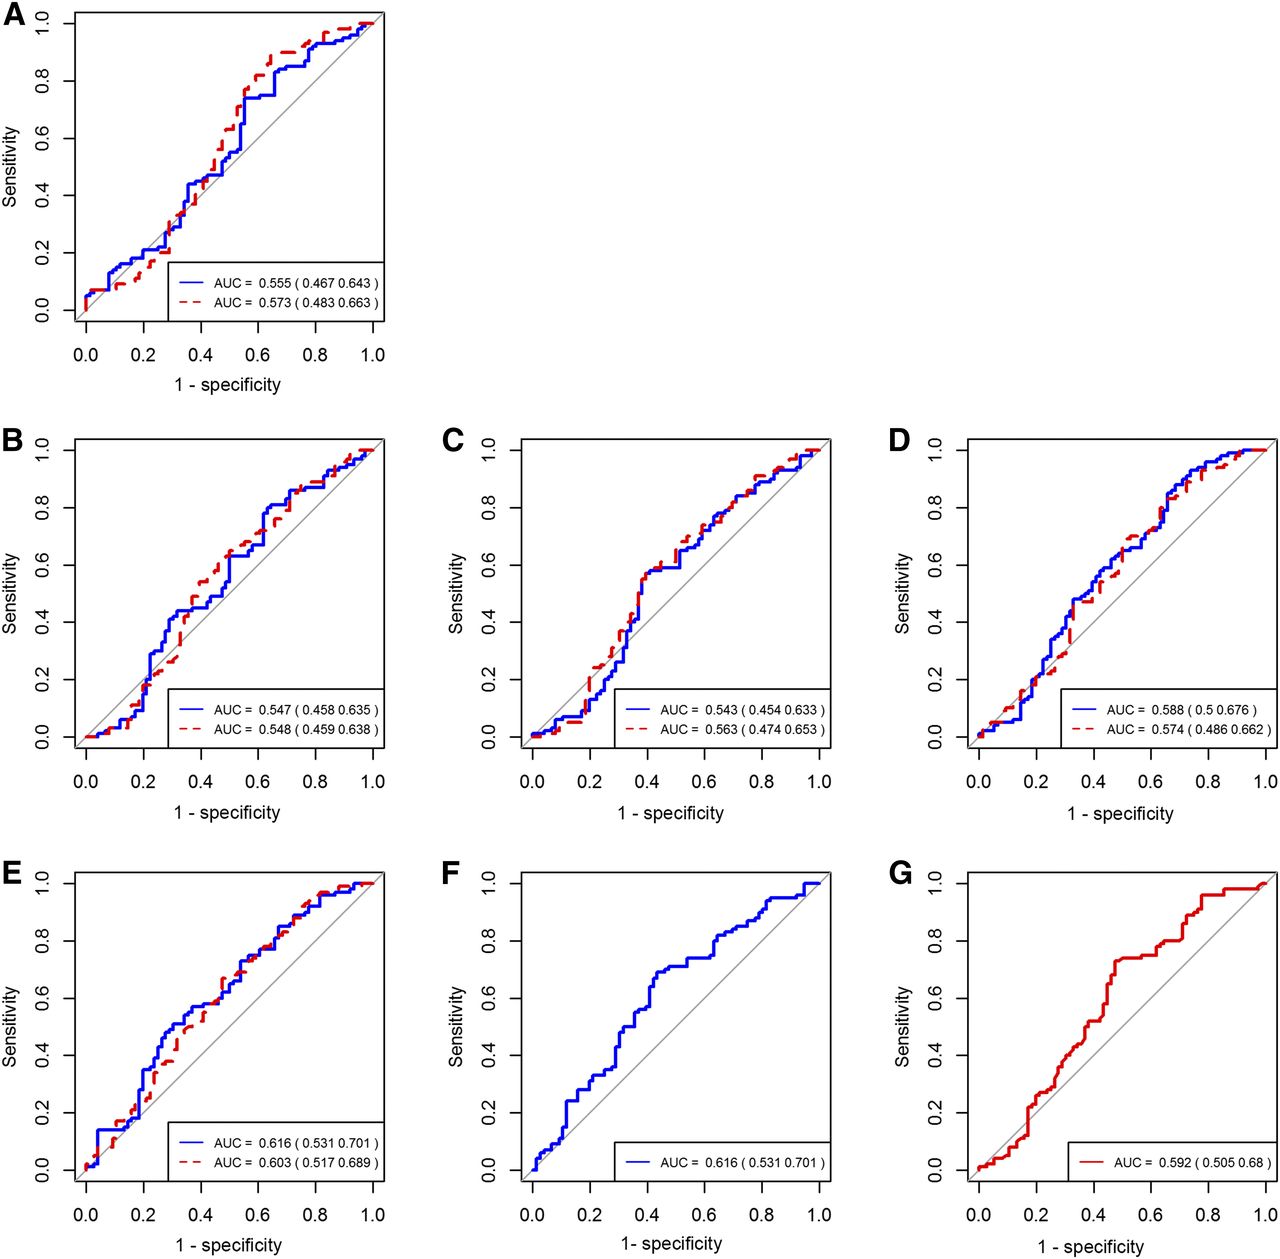
BRAFV600 prediction AUC. Shown are conventional PET features (A), method 1 (B), method 2 (C), method 3 (D), method 4 (E), method 5 (F), and method 6 (G), displayed with 95% confidence intervals in parentheses. Blue (straight) line = binary logistic regression; red (dashed) line = RF.
DISCUSSION
To the best of our knowledge, this is the first melanoma study to predict BRAFV600 mutation status with 18F-FDG PET/CT features, while exploring several methods of feature selection in melanoma radiomics. Based on the driving effect of the BRAF mutation on the mitogen-activated protein kinase pathway and glucose metabolism in colorectal and thyroid cancer, with BRAF inhibitors in melanoma showing suppression of glycolysis and 18F-FDG uptake, a mutation-based difference in 18F-FDG uptake would be expected (30–32). However, no relationship between conventional PET features and BRAFV600 mutational status was found, either as an association or as a prediction. This result is, for most, inconsistent with prior research in thyroid and colorectal cancer, except for prior results in 2 thyroid cancer subtypes and 1 recent melanoma study (31,33,34). Conventional SUVmax predicts the BRAF mutation in thyroid cancer with an AUC of 0.75 and achieves a predictive accuracy of 75% in predicting KRAS/BRAF status in colorectal cancer (31,35). In Chang et al. (35), the AUC of the SUVmax-based prediction model for BRAF changed from 0.75 to 0.93 for lesions larger than 1 cm, and to 0.64 for lesions smaller than 1 cm. By including only lesions 2 cm or larger, we aimed to reduce such partial-volume effects, making their influence on our low predictive result less probable. In contrast, Hatt et al. (36) have proposed the inclusion of tumor volumes larger than 10 cm3 for radiomics research without excluding smaller lesions, instead reporting their correlation with volume. However, this study contained a variety of cancer types without melanoma patients and no metastatic disease. Tumor volumes larger than 10 cm3 in metastatic melanoma are rarer; therefore, our cutoff seems more practical and clinically relevant for this patient cohort, while taking the volume effect into account.
Radiomics features provide a more in-depth tumor characterization than purely 18F-FDG uptake, such as tumor heterogeneity. Considering the influence of mutations on tumor phenotype, linking mutational status to the tumor phenotype provided by radiomics is the next logical step. Our AUCs varied from 0.54 to 0.62, delivering low diagnostic predictive values. In models 1–3, the confidence intervals included the value 0.50, making them as valid as random chance. PET radiomics-based RAS mutation prediction in colorectal cancer shows AUCs of 0.65–0.79, and AUCs of 0.52–0.67 for epidermal growth factor receptor mutations in lung cancer, which is in line with our findings (5–7). According to sample size calculations for our study, we had a sufficient number of patients to significantly detect our predetermined clinically relevant effect in the conventional PET features analysis, which we did not find. As is often the case in radiomics, the sample size was modest for prediction model building, and future multicenter studies with standardized protocols could provide a solution for this. Based on our results, BRAF status in melanoma cannot yet be determined on 18F-FDG PET/CT scans alone and pathology remains the gold standard.
We explored several feature selection methods in melanoma radiomics. Highly correlated features essentially represent similar information and carry little individual added value when both are used in a predictive model: feature redundancy. In our first 3 methods, we used correlation matrices to reduce feature redundancy. Our results show that the extent of redundancy elimination varies dependent on the correlation coefficient cutoff chosen, use of subsequent PCA, and addition of conventional PET features. Raising the cutoff by 0.10 led to a 113% increase of selected features (49 vs. 23). Cutoffs of 0.90–0.95 have been used in PET radiomics studies in lung and vulvar cancer (7,17). Interestingly adding conventional PET features SUVpeak, MATV, and TLG did not reduce more variables and even added 1 more variable than expected, compared with method 1. We showed that the PCA provided the best feature reduction and highest AUC of these 3 methods.
In the final 3 methods we demonstrated a basic selection method and the yield of forgoing reduction. Previous studies have analyzed the radiomics robustness in several cancer types, providing a starting point for selection (10,19–23). We chose often-mentioned robust features emphasizing good repeatability because multiple delineation methods were not analyzed. Considering the wide variability in choice, we focused on 10 features. Until more research has been done and consensus has been reached, this method is susceptible to the researchers’ individual choices, making extrapolation difficult unless the same features are chosen. The simplest method of feature selection based on prior studies achieved the AUC value of 0.62, which was similar to values achieved with the penalized binary logistic regression model and RF model, and higher than the other 3 models. Thus, highly advanced statistical methods do not always have the highest accuracy.
Our study has several limitations, the first being its retrospective nature, which hinders the standardization of PET protocols and reconstruction methods, another common problem in radiomics research. Overall, this effect was minimized in our study, since it was single-center and our scanners were cross-calibrated. In our study, 3 scans were found to be equal to the others except for the voxel matrix reconstruction. Since this influences radiomics feature calculation but not conventional PET measurements, these lesions were excluded from the radiomics analysis. Contrary to other studies, clinical predictors were not added to the prediction models. As often the case in radiomics, the sample size was modest for prediction model building, and future multicenter studies with standardized protocols could provide a solution for this. During cross-validation of the models, no separate external cohort was used, which would ensure a better extrapolation to the intended patient cohort. As this study shows, in PET melanoma radiomics research, as in all radiomics research, it is imperative to realize that the chosen feature selection method influences model performance and that researchers should make an informed decision on which method to choose. However, with our current knowledge, 18F-FDG PET/CT–derived features alone do not yet adequately predict BRAF status in melanoma.
CONCLUSION
BRAFV600 mutation status is not associated with, nor can it be predicted with, conventional PET features, whereas radiomics features were of low predictive value (AUC = 0.62). We showed feature selection methods to influence predictive model performance, describing and evaluating 6 unique methods. Detecting BRAFV600 status in melanoma based on 18F-FDG PET/CT alone does not yet provide clinically relevant knowledge.
DISCLOSURE
Unrelated to this work John Haanen has provided consultation, attended advisory boards, and/or provided lectures for Pfizer, Bayer, MSD, BMS, IPSEN, Novartis, Roche/Genentech, Neon Therapeutics, Celsius Therapeutics, Gadeta BV, Immunocore, Seattle Genetics and AZ/MedImmune for which the Netherlands Cancer Institute received honoraria, and through his work the Netherlands Cancer Institute received grant support from BMS, MSD, GSK, Novartis and Neon Therapeutics. No other potential conflict of interest relevant to this article was reported.
KEY POINTS
QUESTION: Can conventional or radiomics-based 18F-FDG PET/CT features predict BRAFV600 mutation in melanoma, and does radiomics feature selection influence this?
PERTINENT FINDINGS: This retrospective cohort study shows that BRAFV600 mutation status is not associated with, nor can it be predicted with, conventional PET features and that radiomics features were of low predictive value (AUC = 0.62), after extraction of features from baseline 18F-FDG PET/CT scans. Feature selection methods influenced model performance.
IMPLICATIONS FOR PATIENT CARE: Detecting BRAFV600 status in melanoma based on 18F-FDG PET/CT alone does not yet provide clinically relevant knowledge.
Acknowledgments
We thank Simone Pieplenbosch for her technical support and Katarzyna Jóźwiak for her additional statistical review.
Footnotes
Published online Sep. 3, 2019.
- © 2019 by the Society of Nuclear Medicine and Molecular Imaging.
REFERENCES
- Received for publication March 6, 2019.
- Accepted for publication August 5, 2019.


Jump to section
Related Articles
Cited By...
- No citing articles found.