


Abstract
Our purpose was to prospectively investigate optimal evaluation of qualitative and quantitative 18F-FDG PET/CT in response evaluations 12–14 wk after neoadjuvant chemoradiotherapy (nCRT) in esophageal cancer patients. Methods: This was a side study of the prospective diagnostic pre-SANO trial. 18F-FDG PET/CT scans at baseline and at 12–14 wk after nCRT were qualitatively assessed for the presence of tumor. Maximum SUVs normalized for lean body mass (SULmax) were measured in all scans. The primary endpoint was the proportion of false-negative patients with tumor regression grade (TRG) 3–4 (>10% vital residual tumor) in qualitative and quantitative analyses. Receiver-operating-characteristic curve analysis for TRG1 versus TRG3–4 using SULmax, SULmax tumor-to-esophagus ratio, and Δ%SULmax was performed to define optimal cutoffs. Secondary endpoints were sensitivity, specificity, negative predictive value, and positive predictive value for TRG1 versus TRG2–4. Results: In total, 129 of 219 patients were analyzed. Qualitative 18F-FDG PET/CT was unable to detect TRG3–4 in 15% of patients. Sensitivity, specificity, negative predictive value, and positive predictive value in qualitative analysis for detecting TRG1 versus TRG2–4 was 80%, 37%, 42%, and 77%, respectively. In 18 of 190 patients (10%) with follow-up scans after nCRT, 18F-FDG PET/CT identified new interval metastases. Quantitative parameters did not detect TRG3–4 tumor in 27%–61% of patients. The optimal cutoff for detecting TRG1 versus TRG2–4 was a post-nCRT SULmax of 2.93 (area under receiver-operating-characteristic curve, 0.70). Conclusion: Qualitative and quantitative analyses of 18F-FDG PET/CT are unable to accurately detect TRG3–4 and to discriminate substantial residual disease from benign inflammation-induced 18F-FDG uptake after nCRT. However, 18F-FDG PET/CT is useful for the detection of interval metastases and might become useful in an active surveillance strategy with serial 18F-FDG PET/CT scanning.
- 18F-FDG PET/CT
- esophageal cancer
- neoadjuvant chemoradiotherapy
- response evaluation
- tumor regression grade
Esophageal cancer is the eighth most common type of cancer worldwide, with an overall 5-y survival of 35% after primary esophagectomy (1). Since the introduction of neoadjuvant chemoradiotherapy (nCRT), long-term survival rates have increased to 45%–50% (2–4). nCRT using carboplatin and paclitaxel with 41.4 Gy of concurrent radiotherapy induces a pathologically complete response (ypT0 N0) in 29% of patients (5). This has raised the question of whether an active surveillance approach can be applied after nCRT. In such an approach, patients without signs of residual disease after nCRT have regular follow-up clinical investigations. Esophagectomy will be offered only to patients with proven locoregional recurrence, in the absence of distant metastases. To explore the feasibility of an active surveillance strategy, reliable clinical response evaluations (CREs) are needed. For this purpose, a diagnostic multicenter trial has been performed (pre-SANO trial, Netherlands Trial Register NTR4834) comprising endoscopy, bite-on-bite biopsies, endoscopic ultrasound with fine-needle aspiration of suspected lymph nodes, and 18F-FDG PET/CT for response evaluation after nCRT (6,7). The use of 18F-FDG PET/CT as a surveillance test is a topic of debate. According to the study protocol, primary 18F-FDG PET/CT analyses were performed visually (6). Using visual assessment, 18F-FDG PET/CT correctly identified 85% of all tumor regression grade (TRG) 3–4 tumors (i.e., >10% vital tumor cells in the resection specimen) (7). Many other 18F-FDG PET/CT variables have been suggested to correlate with tumor response after nCRT (8–11). Therefore, in this side study of the pre-SANO trial, we performed an in-depth analysis of secondary qualitative and quantitative 18F-FDG PET/CT parameters to detect residual disease after nCRT.
MATERIALS AND METHODS
Patients
Details of the multicenter prospective pre-SANO trial have been described previously (6,7). A flowchart illustrating the design of the trial is shown in Supplemental Figure 1 (supplemental materials are available at http://jnm.snmjournals.org) (6). Briefly, the trial included patients with potentially curable adenocarcinoma or squamous cell carcinoma of the esophagus or esophagogastric junction, who were to undergo surgical resection preceded by nCRT consisting of 5 weekly cycles of carboplatin (area under the curve, 2 mg/mL per minute) and paclitaxel (50 mg/m2 of body surface area) with 41.4 Gy radiotherapy in 23 fractions (5). 18F-FDG PET/CT was performed at the time of diagnosis. At the first CRE (CRE-1), 4–6 wk after completion of nCRT, 18F-FDG PET/CT was performed on patients with histologically proven residual disease, to detect interval distant metastases. In the absence of disseminated disease, these patients were scheduled for immediate surgery. If the endoscopic biopsy results were negative at CRE-1, surgery was postponed for another 4–6 wk and the patients underwent a second CRE 1–2 wk before surgery (CRE-2). During CRE-2, all patients underwent 18F-FDG PET/CT, with the objective being to assess locoregional response and to detect possible distant metastases. Subsequently, the patients underwent endoscopy with bite-on-bite biopsies and endoscopic ultrasound with fine-needle aspiration of suspected lymph nodes of 18F-FDG–positive lesions. According to the study protocol, patients were scheduled for surgery after CRE-2 if no distant metastases were detected. When surgery was further postponed (e.g., because of patient preference or poor physical condition), another 18F-FDG PET/CT scan and endoscopy (CRE-3) were performed preceding the planned surgery (6). The trial was approved by the medical–ethical committee of the Erasmus Medical Center (MEC-2013-211). All patients provided written informed consent.
18F-FDG PET/CT was performed according to version 1.0 of the European Association of Nuclear Medicine (EANM) guidelines and EANM Research Ltd. qualifications (12,13). All participating institutions applied the same scanning protocol. Scanning took place at 60 ± 5 min after intravenous injection of a 2.3 MBq/kg dose of 18F-FDG (12). Only attenuation-corrected and ordered subset expectation maximization–reconstructed images were used in the analyses.
Before scanning, all patients were asked to fast for at least 6 h and to drink 1–2 L of water. Patients’ weight and height were recorded. Blood glucose levels were required to be less than 8.0 mmol/L. Patients had to be in resting condition before scanning. Modern equipment, including multislice CT (16-slice or better) and, if possible, time-of-flight PET, was used. PET/CT scanners were calibrated for quantitative SUV measurements, according to EANM Research Ltd. qualifications (13).
Qualitative Assessments
For qualitative analysis, the baseline scan and last 18F-FDG PET/CT scan before surgery (CRE-2 or CRE-3) were examined. CRE-1 scans were excluded, since we expected that 4–6 wk after nCRT the effect of radiation-induced esophagitis would still be substantial (14,15). For assessment of distant dissemination, all follow-up scans were included.
Baseline scans that were not 18F-FDG–avid, with tumor not clearly distinguishable from background, were excluded from analysis. These patients were described separately (Supplemental Table 1) (7). Furthermore, patients lacking a follow-up 18F-FDG PET/CT study were excluded.
The presence of residual tumor was centrally assessed by an experienced nuclear medicine physician, who was masked to all clinical information except weight, height, injected 18F-FDG activity, and time interval between injection and PET acquisition. In cases of disagreement with the original report, a second masked nuclear medicine physician reviewed the study independently and a consensus agreement between both reviewers was established.
During review, a lesion was considered 18F-FDG–positive when any uptake in the lesion was above the adjacent esophageal background uptake. To dichotomize qualitative analysis, the PET scan was classified as 18F-FDG–negative when no uptake was seen. An 18F-FDG–positive scan included locoregional 18F-FDG–positive residual lesions, locoregional progression, presence of hematogenous metastases, or a combination of these.
Additionally, confidence scores were assigned for the primary tumor, lymph nodes, and hematogenous metastases (1 = benign/no uptake; 2 = probably benign/minimal uptake; 3 = equivocal; 4 = probably malignant; 5 = malignant). In this scoring system, a lesion was considered probably malignant if any focal abnormal accumulation of 18F-FDG was observed. A scan was scored as benign when the uptake in the lesion did not differ from the surrounding normal background uptake. A lesion was scored as probably benign in the case of diffuse, minimal uptake of 18F-FDG above the background. A lesion was scored as equivocal if focal accumulation could not be distinguished, nor could the lesion be classified as benign. During qualitative analysis using confidence scores, an 18F-FDG–negative scan included confidence scores 1 and 2. An 18F-FDG–positive scan comprised scores 3–5.
Quantitative Assessments
Global volumes of interest were manually drawn over the primary tumor and visual lymph nodes using Osirix MD, version 6.5.2 (Pixmeo). The same was done for the reference regions of the physiologic esophagus, liver, and blood pool. In the follow-up 18F-FDG PET/CT scans, the volumes of interest were placed in the same locations. SUVs normalized for lean body mass for maximum (SULmax) and mean (SULmean) values were calculated from the activity values inside the volume of interest. The association between the blood pool and liver SUVmean and body weight was determined in all CRE scans using the James equation, since no patients had an extreme body mass index (13). The same was done for the blood pool and liver SULmean, to determine the parameter (SUV or SUL) for quantitative assessments. SUVmax measurements were corrected for lean body mass, since SUV showed weight dependency (P < 0.001 for both SUVmean of the blood pool and SUVmean of the liver), which disappeared with SUL (P = 0.58 for SULmean of the blood pool; P = 0.27 for SULmean of the liver) (13).
Histopathology
All resection specimens were reviewed by an expert upper-gastrointestinal pathologist. The reference standard was the pathologic response in the resection specimen according to the TRG system of Chirieac, as this is the most commonly used system in The Netherlands (TRG1, 0%; TRG2, 1%–10%; TRG3, 11%–50%; and TRG4, >50% vital residual tumor cells) (16). An arbitrary TRG4 was assigned to patients who had irresectable tumor (T4b) during surgery.
Outcomes
The primary outcome was the proportion of false-negative TRG3–4 residual tumors by qualitative and quantitative examination of 18F-FDG PET/CT scans. Quantitative parameters included SULmax at tumor, SULmax ratio (SULmax tumor/SULmax esophagus), absolute ΔSULmax, and Δ%SULmax. It was considered acceptable for minimal residual tumor (TRG2) to be undetected by PET, because it is expected that TRG2 tumor will become detectable during active surveillance before it has developed into irresectable tumor (6).
Secondary outcomes comprised sensitivity, specificity, negative predictive value (NPV), and positive predictive value (PPV) for detection of TRG1 versus TRG2–4 in qualitative and quantitative analysis of 18F-FDG PET/CT.
Statistical Analysis
The sample size calculation was explained in detail earlier (6,7). The χ2 test was used to calculate the association between qualitative PET outcomes and TRG. Receiver-operating-characteristic (ROC) curve analysis was performed for TRG1 versus TRG3–4 for the PET parameters SULmax at tumor, SULmax ratio, absolute ΔSULmax, and Δ%SULmax. Area under the ROC curve was calculated with a 95% confidence interval. Cutoffs were defined using the Youden index (17). For qualitative results and for the quantitative optimal cutoffs, sensitivity, specificity, NPV, and PPV were calculated for differentiation between TRG1 and TRG2–4, using standard formulas.
All tests were 2-sided. P values of less than 0.05 were considered statistically significant. Statistical analysis was performed using IBM SPSS Statistics (version 24; IBM Corp.) for Macintosh (Apple).
RESULTS
Patients
Clinicopathologic characteristics are shown in Table 1. At CRE-2/3, 129 patients were eligible for analysis of 18F-FDG PET/CT at a median time of 11 wk (interquartile range, 10–12 wk) after nCRT (CRE-2, n = 126; CRE-3, n = 3; Fig. 1). In the remaining 56 of 78 patients with positive biopsy results at CRE-1, 18F-FDG PET/CT was performed at a median time of 7.4 wk (interquartile range, 6.0–8.3 wk) after nCRT.
Baseline Characteristics of Study Population (7)
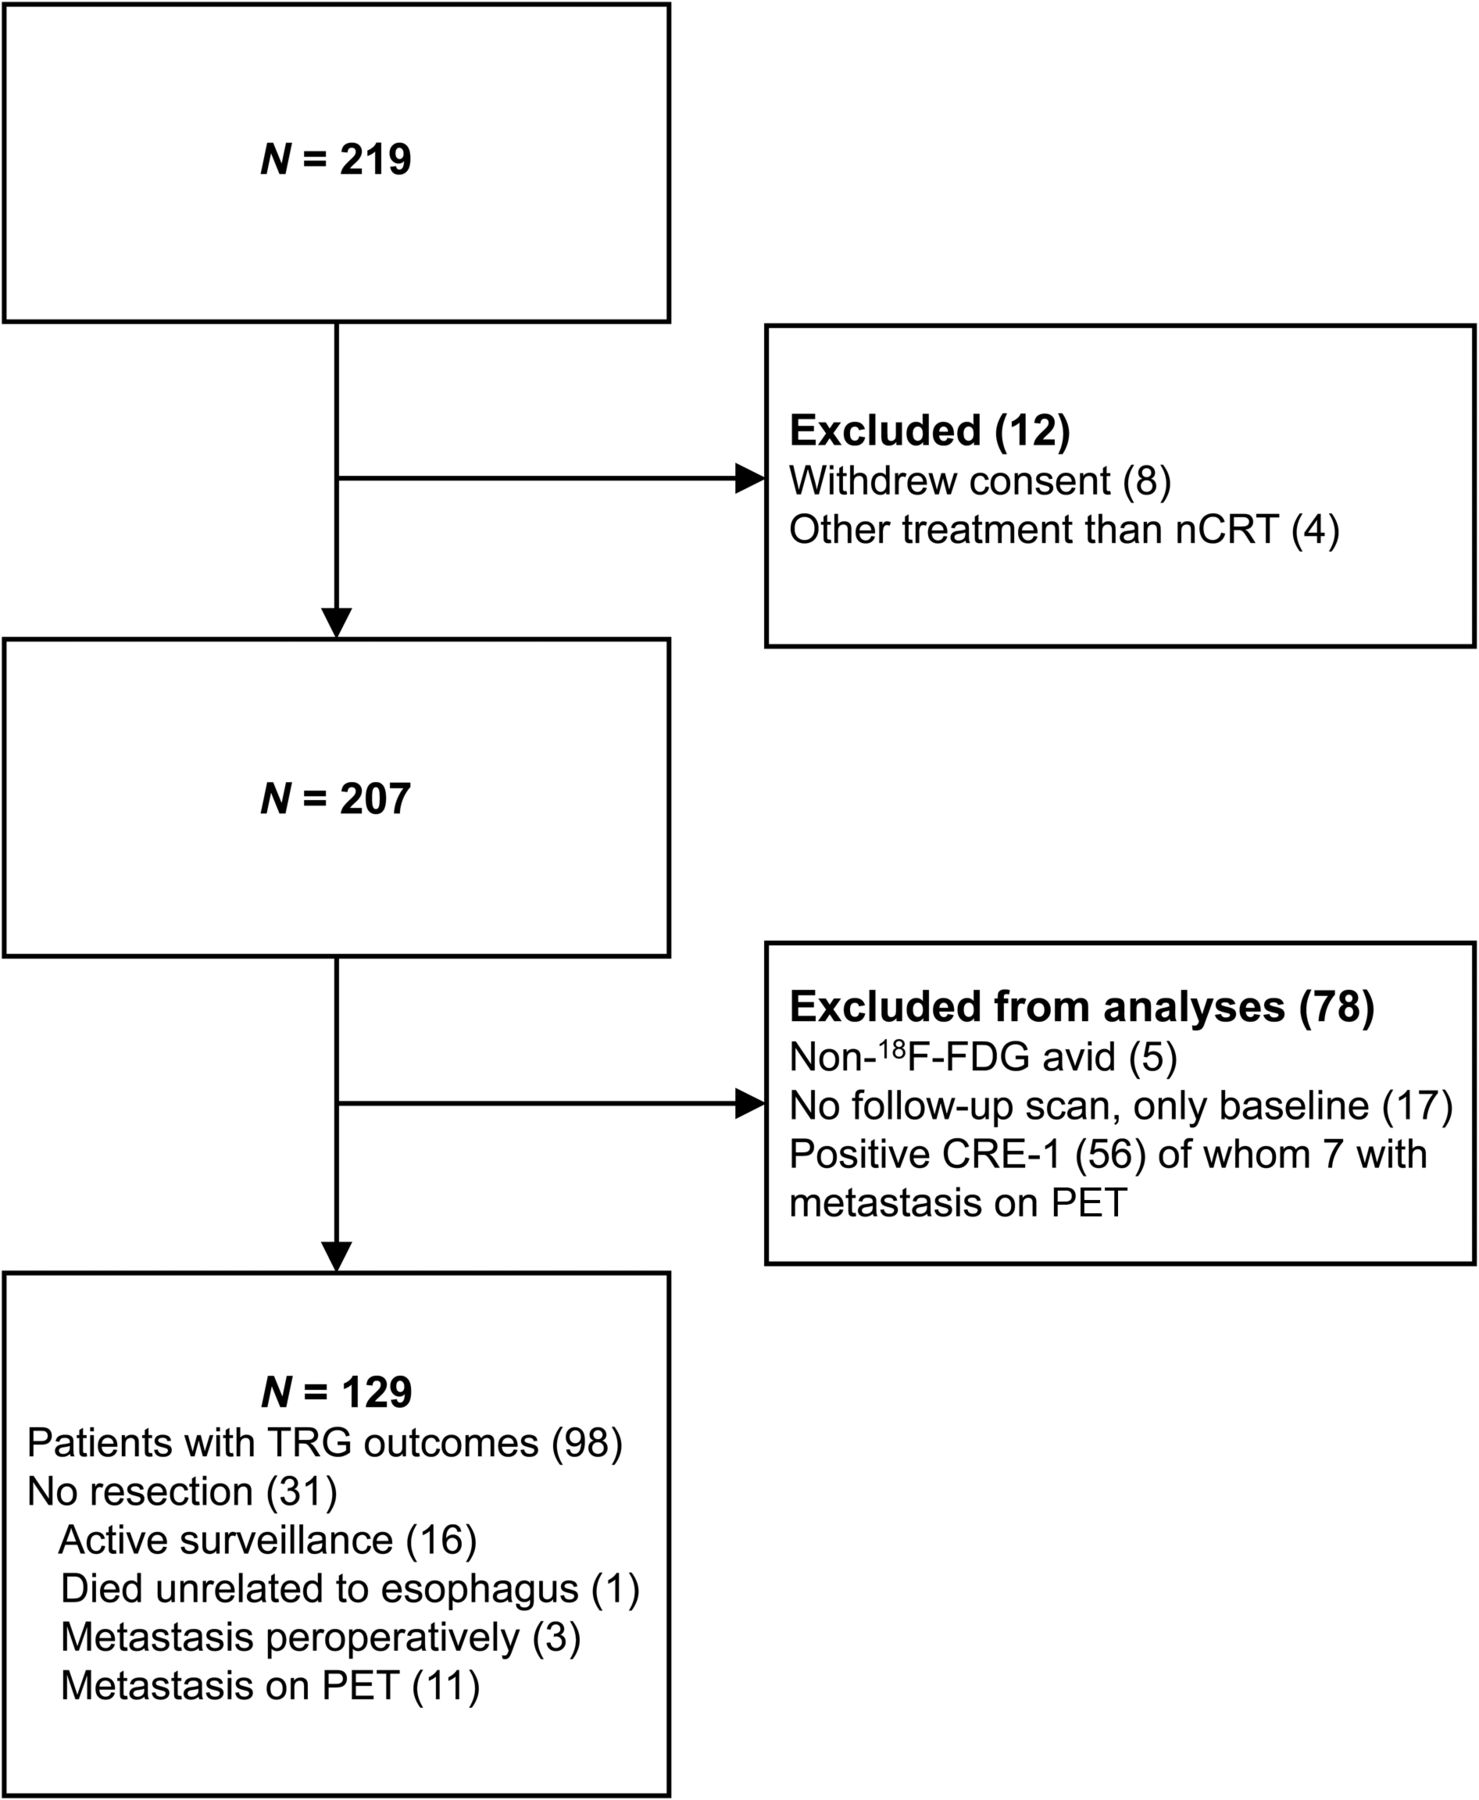
Flowchart of final inclusion of 129 patients at CRE-2/3 (7).
At CRE-2/3, surgery was performed 4.2 wk (interquartile range, 3.0–5.3 wk) after the last 18F-FDG PET/CT study. Nineteen patients had surgery more than 6 wk after CRE-2/3 18F-FDG PET/CT (median, 8.0 wk; interquartile range, 6.6–8.7 wk).
In 3 patients, metastases were detected perioperatively and resection was not performed (peritoneal metastasis, n = 2; liver metastasis, n = 1). Two patients had irresectable tumors (T4b).
Baseline 18F-FDG PET/CT scans were acquired 61.0 ± 9.1 min after injection of 212 ± 64.3 MBq of 18F-FDG. For CRE scans (CRE-1/2/3), the acquisition took place 61.9 ± 8.8 min after injection of 206 ± 55.8 MBq of 18F-FDG. Because the injection-to-scan interval did not influence the SULmean of the blood pool, patients were not excluded on the basis of the injection-to-scan interval (Supplemental Fig. 3). At baseline and at CRE-1/2/3, glucose levels were 5.9 ± 1.3 mmol/L and 6.8 ± 1.5 mmol/L, respectively, and did not significantly correlate with the blood pool SULmean (P = 0.08 and P = 0.22, respectively). Patients with a serum glucose level higher than 8 mmol/L (at baseline, n = 17; at CRE-1/2/3, n = 19) were therefore also included. Five patients had noisy images. However, these scans were still adequate for visual analysis.
Qualitative 18F-FDG PET/CT Analysis
At CRE-2/3, no statistically significant association was found between qualitative PET and TRG (P = 0.19). Six of 41 patients with TRG3–4 had visually negative 18F-FDG PET/CT results (false-negative TRG3–4; 15%), whereas 17 of 27 patients had TRG1 but positive 18F-FDG PET/CT results (false-positives; 63%) (Table 2). The sensitivity, specificity, NPV, and PPV of TRG1 versus TRG2–4 were 57 of 71 (80%,), 10 of 27 (37%), 10 of 24 (42%), and 57 of 72 (77%), respectively. The outcomes of patients who were excluded from analyses are shown in Supplemental Table 1 (7).
Results of Qualitative Dichotomous 18F-FDG PET/CT Analysis at CRE-2/3 (7)
Some 190 patients were included for analysis of detection of interval metastases on 18F-FDG PET/CT (17 had no follow-up scan). Some 38 of 190 patients (20%) had suspicion of distant metastases on PET/CT. In 18 of 38 patients, metastases were pathologically confirmed (true-positives, 10%; squamous cell carcinoma, n = 1; adenocarcinoma, n = 17). In 20 of 38 patients, metastases were ruled out on the basis of negative histologic findings or after correlation with other imaging and clinical parameters.
Adding confidence scores to qualitative 18F-FDG PET/CT analyses showed an overlap in TRG for all confidence scores, especially for TRG2 (Fig. 2). No statistically significant association between confidence scores and TRG was found (P = 0.072). More clinically false-negative patients with TRG3–4 (12/41, 29%) and fewer false-positives for TRG1 (13/27, 48%) were seen than with the dichotomous method of qualitative analysis. The resulting sensitivity, specificity, NPV, and PPV for TRG1 versus TRG2–4 were 44 of 71 (62%), 14 of 27 (52%), 14 of 41 (34%), and 44 of 57 (81%), respectively.
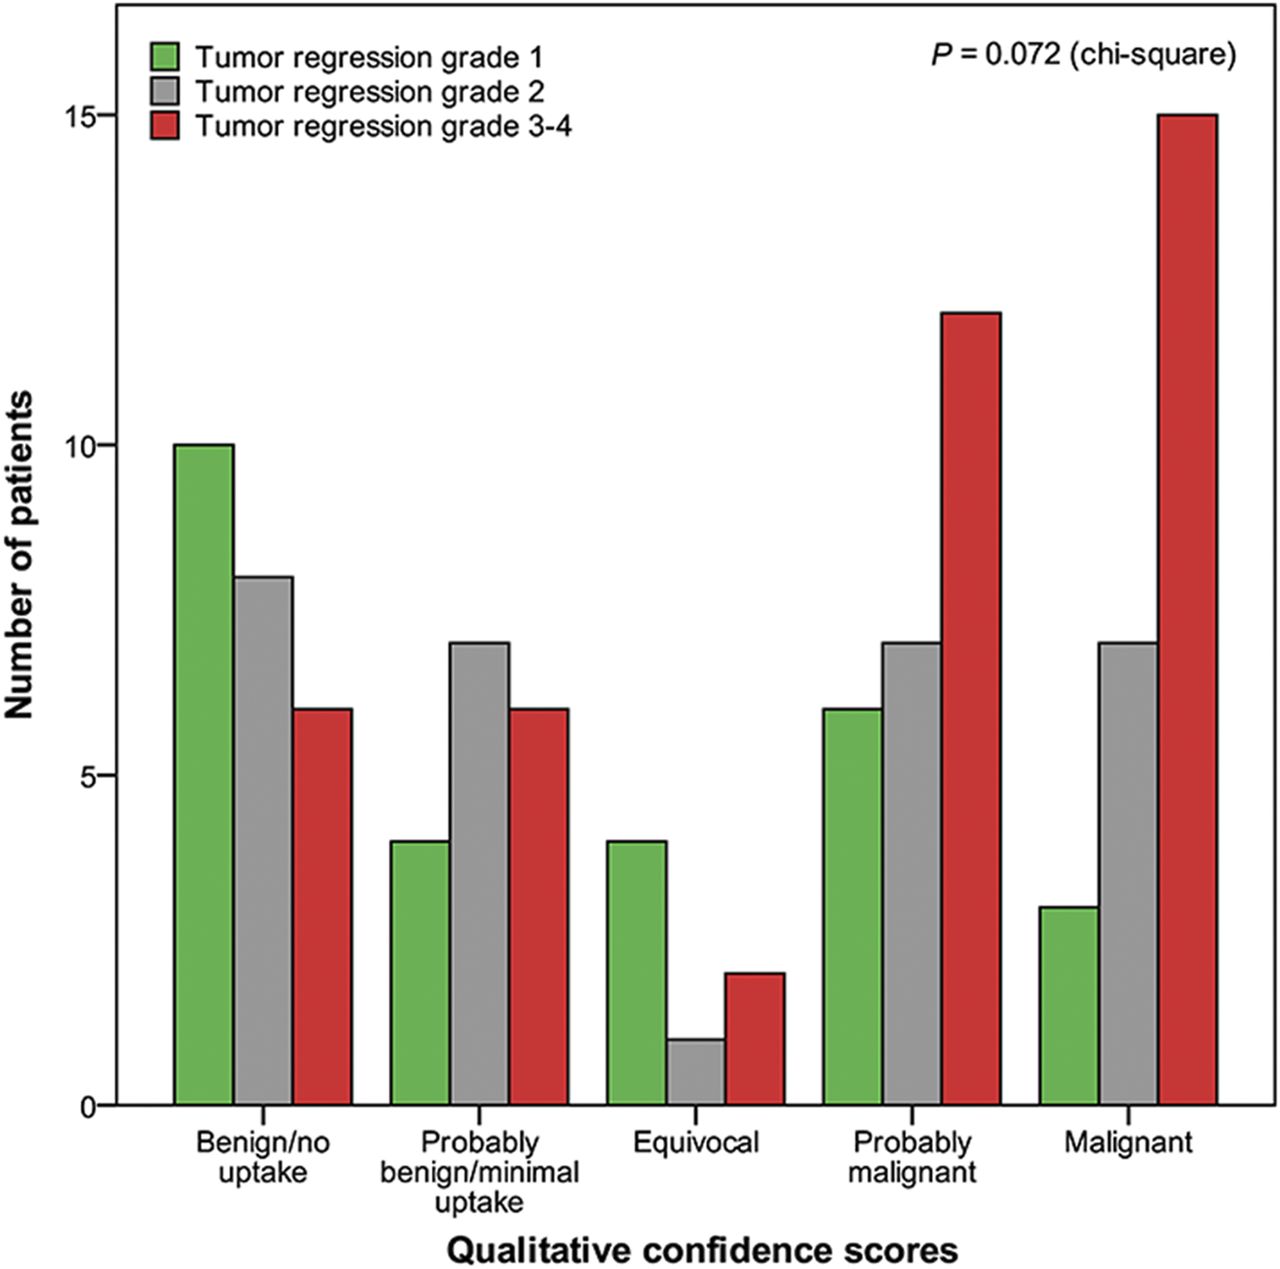
Qualitative 18F-FDG PET/CT confidence scores subdivided by TRG at CRE-2/3 (n = 98).
Sixteen of 129 patients underwent active surveillance after CRE-2, with 18F-FDG PET/CT performed for qualitative assessment (Fig. 1). An example of serial follow-up is shown in Figure 3, in a patient in whom the 18F-FDG PET/CT findings turned positive again 12 wk after a clinically complete response at CRE-2.

18F-FDG PET/CT at baseline (A) and at 12 wk (B) and 24 wk (C) after completion of nCRT. Initial clinically complete response at 12 wk was followed by increase in 18F-FDG avidity at 24 wk. In view of these findings, esophagectomy was performed, and residual tumor was found in resection specimen. Resection was radical, and tumor margins were free of disease (ypT3 N1R0, grade 3).
Quantitative 18F-FDG PET/CT Analysis
In all patients with TRG outcomes (i.e., availability of surgical resection specimen), CRE SULmax, Δ%SULmax, and SULmax ratios were 3.0 ± 1.1, −57 ± 30, and 1.6 ± 0.56, respectively, in patients with TRG1; for TRG2, these were 3.6 ± 1.4, −46 ± 31, and 1.8 ± 0.78, respectively; and for TRG3–4, these were 4.2 ± 2.1, −49 ± 21, and 2.1 ± 0.82, respectively. In Supplemental Figure 2, the overlap is visualized in the parameters CRE SULmax, Δ%SULmax, and SULmax for the different TRG outcomes. Furthermore, there is an overlap in the low ranges of both SULmax and SULmax ratio for qualitatively 18F-FDG–positive and 18F-FDG–negative scans, in patients with TRG3 or TRG4 (Fig. 4).
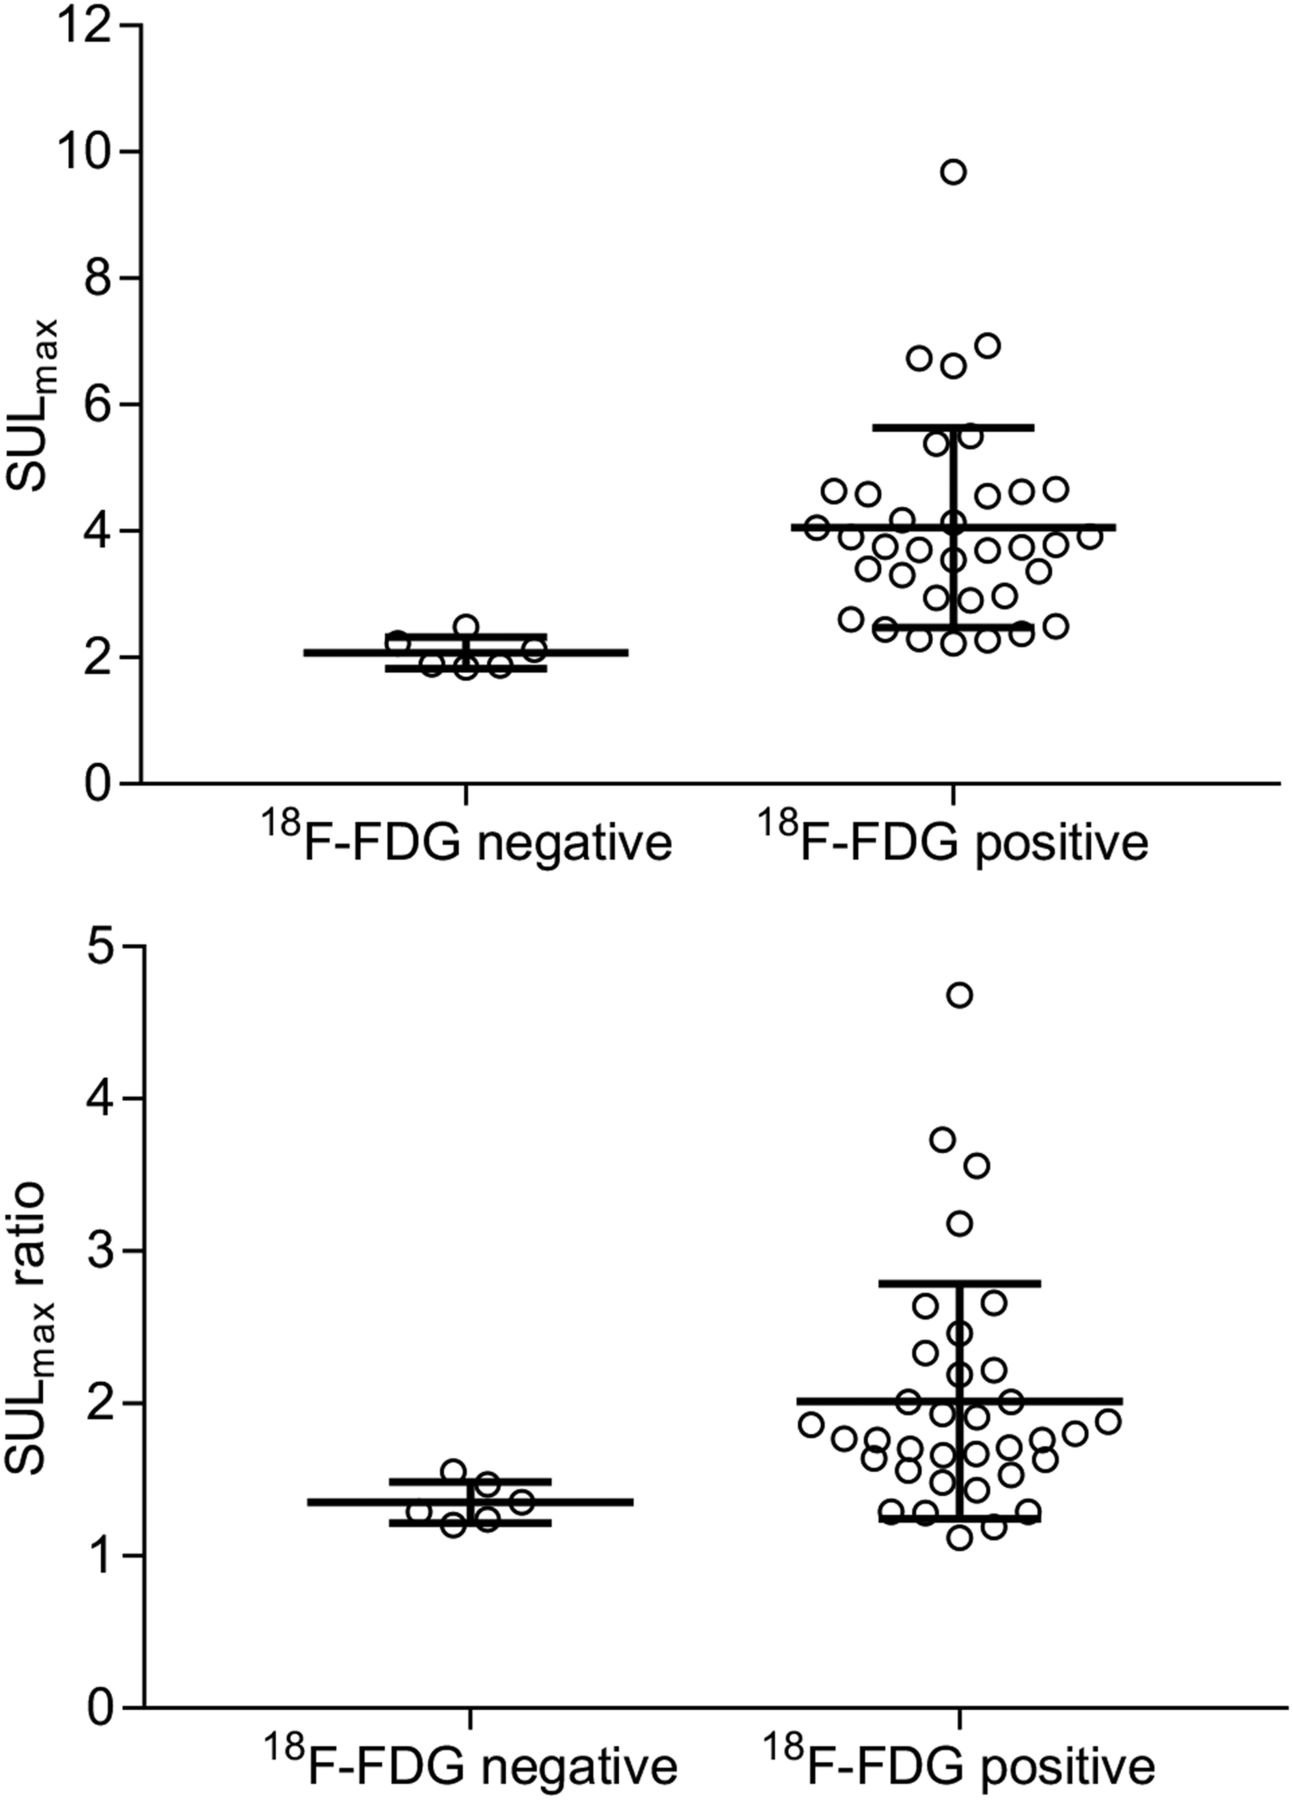
SULmax and SULmax tumor-to-esophagus ratio at CRE-2/3 for qualitatively 18F-FDG–positive and 18F-FDG–negative scans in TRG3–4 tumors.
The ROC curves of CRE-2/3 SULmax, SULmax ratio, and Δ%SULmax are shown in Figure 5 and Table 3. For TRG1 versus TRG3–4, optimal accuracy is seen using SULmax at a cutoff of 2.93 (area under ROC curve, 0.70; optimal cutoff, 2.93; sensitivity, 66%; specificity, 74%).

(A) ROC curve analysis of SULmax tumor and SULmax tumor-to-esophagus ratio at CRE-2/3 in predicting TRG1 vs. TRG3–4. (B) ROC curve analysis of absolute and percentage ΔSULmax at CRE-2/3 in predicting TRG1 vs. TRG3–4.
Accuracy of 18F-FDG PET/CT in Predicting TRG3–4 Vs. TRG1 at CRE-2/3 with Optimal Cutoffs
The results of implementing the optimal cutoffs for quantitative parameters are displayed in Supplemental Table 2. With an optimal SULmax cutoff of 2.93, in 14 of 41 patients with TRG3–4 the disease was undetected (34% false-negative). Using this cutoff, sensitivity, specificity, NPV, and PPV for TRG1 versus TRG2–4 were 43 of 71 (61%), 20 of 27 (74%), 20 of 48 (42%), and 43 of 50 (86%), respectively.
An optimal cutoff of 1.47 for SULmax ratio did not detect 11 of 41 TRG3–4 (27%). The sensitivity, specificity, NPV, and PPV for TRG1 versus TRG2–4 were 45 of 71 (63%), 16 of 27 (59%) 16 of 42 (38%), and 45 of 56 (80%), respectively.
For absolute ΔSULmax at an optimal cutoff of 4.03, 23 of 41 (56%) TRG3–4 were undetected. The sensitivity, specificity, NPV, and PPV for TRG1 versus TRG2–4 were 31 of 70 (44%), 8 of 27 (30%), 8 of 47 (17%), and 31 of 50 (62%), respectively.
With Δ%SULmax at an optimal cutoff of a decrease of 56.31%, 25 of 41 (61%) TRG3–4 tumors were undetected. Consequently, the sensitivity, specificity, NPV, and PPV for TRG1 versus TRG2–4 were 31 of 70 (44%), 7 of 27 (26%), 7 of 46 (15%), and 31 of 51 (61%), respectively.
DISCUSSION
This study prospectively explored strategies for optimal evaluation of qualitative and quantitative 18F-FDG PET/CT for detection of locoregional residual disease in patients with esophageal cancer at 10–12 wk after nCRT.
First, qualitative assessment by visual dichotomous analysis of 18F-FDG PET/CT scans was unable to detect TRG3–4 tumor in 15% of patients. 18F-FDG PET/CT had a relatively high sensitivity of 80% for detecting TRG2–4 versus no tumor (TRG1) but yielded a specificity of only 37%. Adding confidence scores to the visual interpretation of 18F-FDG PET/CT scans did not increase accuracy (Fig. 2). This illustrates the difficulty of visual response assessment on 18F-FDG PET/CT at this specific time point after nCRT, when small tumor lesions apparently cannot be distinguished reliably from physiologic esophageal metabolism or postradiation esophagitis.
Quantitative analysis only moderately discriminated TRG3–4 from TRG1, as areas under the ROC curve did not exceed 0.7. The post-nCRT 18F-FDG PET/CT parameters were falsely negative for TRG3–4 in 27%–61% of the patients, using the optimal cutoffs. For discriminating TRG2–4 from TRG1, the optimal cutoff for SULmax was 2.93, with an accuracy of only 64%. Thus, quantitative analysis of 18F-FDG PET/CT alone appears insufficiently accurate to identify pathologic response. Moreover, quantitative assessment did not identify visually 18F-FDG false-negatives (Fig. 4). The overlap between qualitative and quantitative outcomes in false-positive TRG1 and false-negative TRG3–4 indicates that many patients are misqualified by both methods (Supplemental Tables 3–4). Biologic factors may be the underlying cause of this misqualification.
To our knowledge, this was the first prospective study that systematically assessed the role of 18F-FDG PET/CT in prospective CRE after nCRT for esophageal cancer. 18F-FDG PET/CT for locoregional response evaluation was performed 12 wk after nCRT. Shortly after nCRT, typically at 6 wk, a false-positive PET signal is expected because of radiotherapy-induced inflammation and tumor necrosis. On the basis of knowledge from lymphoma and breast cancer, we hypothesized that PET/CT might be more accurate at 12 wk after nCRT (12,18).
In previous studies on 18F-FDG PET/CT in response evaluation, scans were often performed at shorter intervals after nCRT (during nCRT or within 6 wk after completion of nCRT) (14,15,19,20). Definitions of pathologically complete response varied from TRG1 of the primary tumor to ypT0 N0 and no more than 10% residual tumors cells. A comparable study assessed the association between any visible 18F-FDG uptake (5–7 wk after nCRT) and any residual tumor in the resection specimen, demonstrating a sensitivity, specificity, and accuracy of 74%, 22%, and 53%, respectively (15). This finding is in line with the qualitative analysis of the present study. The longer period allowed recovery from radiotherapy-induced esophagitis and may have contributed to the improved accuracy of 18F-FDG PET/CT in the present study. Several studies investigated the association between complete metabolic response (defined as SUVmax < 4 and N0) and pathologically complete response (defined as ypT0 N0) (14,19,20). Sensitivity, specificity, NPV, and PPV were 51%–67%, 46%–67%, 63%–82%, and 27%–79%, respectively, demonstrating only a modest diagnostic accuracy of quantitative 18F-FDG PET/CT analysis. With quantitative SULmax in the present study, comparable findings for TRG1 versus TRG2–4 were found (sensitivity, 74%; specificity, 60%; NPV, 64%; and PPV, 86%).
It is currently unknown whether it is safe to postpone surgery in patients with a minimal amount of residual tumor (TRG2). We expect that detection of tumor recurrence may be timely—that is, within the window of opportunity (when complete resection is still possible)—during systematic rigorous follow-up. However, the duration of this window of opportunity is probably limited. This issue is being investigated in the ongoing randomized SANO trial (Surgery as Needed for Esophageal Cancer; NTR6803), comparing active surveillance with immediate surgery in clinically complete responders 12 wk after nCRT (7,21).
In serial follow-up, the use of qualitative and quantitative 18F-FDG PET/CT might be more promising. When a single 18F-FDG PET/CT scan after nCRT is used, no distinction can be made between small, but vital, residual tumor and physiologic esophageal metabolism or radiation-induced esophagitis. Over time, however, an increase in 18F-FDG signal is expected to reflect tumor recurrence. Decreasing SUL would be compatible with recovery from radiation-induced esophagitis or other phenomena such as Candida infection and gastroesophageal reflux disease (22). To enable reliable detection of small 18F-FDG changes, we advocate consistent and strict scanning protocols during follow-up.
Apart from being used for response evaluation after nCRT, 18F-FDG PET/CT is useful for detection of interval metastases. Other studies, with a shorter time to response assessments, all have reported detection rates of about 8% for interval metastases (23–27). The 10% detection rate for interval metastases in the present study suggests that a prolonged interval from nCRT to surgery may help to avoid unnecessary surgery in patients with subclinical metastases.
This study included both adenocarcinoma and squamous cell carcinoma—a difference from current guidelines that recommend different treatment regimens for the two histologic subtypes (28). However, on the basis of the successful results of the CROSS regimen in both adenocarcinoma and squamous cell carcinoma, we decided to continue this approach in the current study (5). Another limitation is that, because of the multicenter design, not all baseline and follow-up 18F-FDG PET/CT scans were acquired on the same scanner. We strongly recommend high-quality scanning using the same scanner at CRE-2 and thereafter, to allow detection of small lesions (lymph nodes, systemic metastases) at these time points. Also, some patients had a prolonged interval between the last 18F-FDG PET/CT scan and surgery (Supplemental Table 5). The amount of residual disease at the time of these scans may not have been representative for TRG in the resection specimen. We therefore stress the importance of a short interval between the last 18F-FDG PET/CT scan and surgery in diagnostic studies, to prevent falsely negative results.
CONCLUSION
The value of 18F-FDG PET/CT for detection of locoregional recurrence during response evaluation after nCRT for esophageal cancer is limited, both qualitatively and quantitatively. Distinction of a small TRG3–4 tumor from surrounding physiologic metabolism or postradiation esophagitis is difficult and may lead to false-positive and false-negative results. A clinically useful cutoff for detection of residual tumor by SUL cannot be determined. Quantitative measurements might be applicable to support qualitative interpretation to monitor metabolism during serial follow-up in an active surveillance strategy, provided that each follow-up scan is performed on the same scanner and using the same protocol. Most importantly, qualitative assessment of 18F-FDG PET/CT is useful for the detection of interval metastases (10%) at 12 wk after nCRT. The value of 18F-FDG PET/CT and other diagnostic modalities in an active surveillance approach will be further investigated from the results of the current SANO trial (7,21).
DISCLOSURE
This study was funded by the Dutch Cancer Foundation (KWF Kankerbestrijding, project EMCR 2014-7430). No other potential conflict of interest relevant to this article was reported.
KEY POINTS
QUESTION: What is the diagnostic accuracy of qualitative and quantitative 18F-FDG PET/CT in response evaluations 12–14 wk after nCRT in esophageal cancer patients?
PERTINENT FINDINGS: In a prospective cohort of 129 patients, qualitative 18F-FDG PET/CT was unable to detect TRG3–4 in 15%. Quantitative standardized uptake parameters were not able to accurately discriminate residual disease from postradiation inflammatory processes.
IMPLICATIONS FOR PATIENT CARE: 18F-FDG PET/CT is important for detection of interval metastases but is not accurate enough to rule out residual disease 12 wk after nCRT.
Footnotes
Published online Mar. 15, 2019.
- © 2019 by the Society of Nuclear Medicine and Molecular Imaging.
REFERENCES
- Received for publication December 24, 2018.
- Accepted for publication March 4, 2019.


Jump to section
Related Articles
Cited By...
- No citing articles found.