
Main menu

  • Home
  • Content
    • Current
    • Ahead of print
    • Past Issues
    • JNM Supplement
    • SNMMI Annual Meeting Abstracts
    • Continuing Education
    • JNM Podcasts
  • Subscriptions
    • Subscribers
    • Institutional and Non-member
    • Rates
    • Journal Claims
    • Corporate & Special Sales
  • Authors
    • Submit to JNM
    • Information for Authors
    • Assignment of Copyright
    • AQARA requirements
  • Info
    • Reviewers
    • Permissions
    • Advertisers
  • About
    • About Us
    • Editorial Board
    • Contact Information
  • More
    • Alerts
    • Feedback
    • Help
    • SNMMI Journals
  • SNMMI
    • JNM
    • JNMT
    • SNMMI Journals
    • SNMMI

User menu

  • Subscribe
  • My alerts
  • Log in
  • My Cart

Search

  • Advanced search
Journal of Nuclear Medicine
  • SNMMI
    • JNM
    • JNMT
    • SNMMI Journals
    • SNMMI
  • Subscribe
  • My alerts
  • Log in
  • My Cart
Journal of Nuclear Medicine

Advanced Search

  • Home
  • Content
    • Current
    • Ahead of print
    • Past Issues
    • JNM Supplement
    • SNMMI Annual Meeting Abstracts
    • Continuing Education
    • JNM Podcasts
  • Subscriptions
    • Subscribers
    • Institutional and Non-member
    • Rates
    • Journal Claims
    • Corporate & Special Sales
  • Authors
    • Submit to JNM
    • Information for Authors
    • Assignment of Copyright
    • AQARA requirements
  • Info
    • Reviewers
    • Permissions
    • Advertisers
  • About
    • About Us
    • Editorial Board
    • Contact Information
  • More
    • Alerts
    • Feedback
    • Help
    • SNMMI Journals
  • View or Listen to JNM Podcast
  • Visit JNM on Facebook
  • Join JNM on LinkedIn
  • Follow JNM on Twitter
  • Subscribe to our RSS feeds
Meeting ReportInstrumentation & Data Analysis Track

PET-MR Attenuation Correction using 3D Multi-Echo Dixon-Based UTE Sequence

Paul Han, Debra Horng, Xiaochun Lai, Georges El Fakhri, Jinsong Ouyang and Chao Ma
Journal of Nuclear Medicine May 2018, 59 (supplement 1) 652;
Paul Han
1Harvard Medical School Boston MA United States
2Massachusetts General Hospital Boston MA United States
3Massachusetts General Hospital Boston MA United States
  • Find this author on Google Scholar
  • Find this author on PubMed
  • Search for this author on this site
Debra Horng
2Massachusetts General Hospital Boston MA United States
3Massachusetts General Hospital Boston MA United States
1Harvard Medical School Boston MA United States
  • Find this author on Google Scholar
  • Find this author on PubMed
  • Search for this author on this site
Xiaochun Lai
1Harvard Medical School Boston MA United States
2Massachusetts General Hospital Boston MA United States
3Massachusetts General Hospital Boston MA United States
  • Find this author on Google Scholar
  • Find this author on PubMed
  • Search for this author on this site
Georges El Fakhri
1Harvard Medical School Boston MA United States
2Massachusetts General Hospital Boston MA United States
3Massachusetts General Hospital Boston MA United States
  • Find this author on Google Scholar
  • Find this author on PubMed
  • Search for this author on this site
Jinsong Ouyang
2Massachusetts General Hospital Boston MA United States
3Massachusetts General Hospital Boston MA United States
1Harvard Medical School Boston MA United States
  • Find this author on Google Scholar
  • Find this author on PubMed
  • Search for this author on this site
Chao Ma
2Massachusetts General Hospital Boston MA United States
3Massachusetts General Hospital Boston MA United States
1Harvard Medical School Boston MA United States
  • Find this author on Google Scholar
  • Find this author on PubMed
  • Search for this author on this site
  • Article
  • Figures & Data
  • Info & Metrics
Loading

Abstract

652

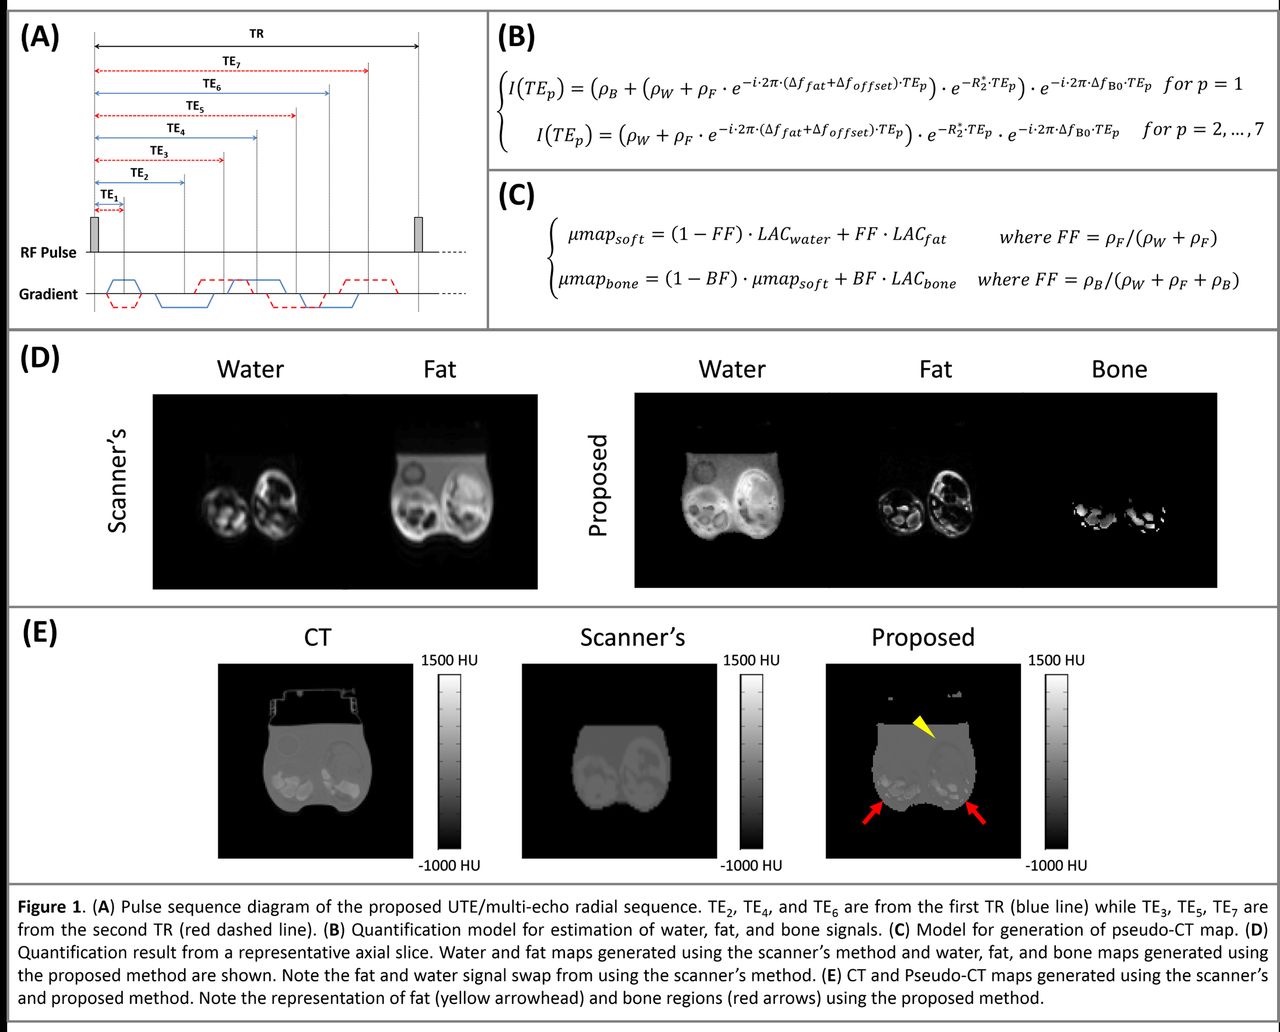
Objectives: Accurate estimation of PET attenuation coefficients (AC) is a challenging problem in PET/MR1. Current MR-based AC method widely used in the PET/MR scanners segments an MR image into different tissue classes (e.g., air, lung, fat, and soft-tissue) and then assigns a single AC value for each class. This method does not account for intra- and/or inter-subject variations2-5, and can lead to unacceptable biases especially in areas such as bone6. Thus, accurate representation of bone AC with a continuous variation is necessary for reliable PET/MR imaging7-8. In this work, we propose a new MR acquisition method that integrates UTE and multi-echo Dixon in a single acquisition and a new quantification method to represent continuous variation of water, fat and bone AC using MR. The performance of the proposed method is evaluated via a phantom study. Methods A phantom was made by placing a pig tibia containing muscle, fat, and bone inside a plastic container. The container was then filled with 5% gelatin containing radioactive 18F to resemble background soft-tissue. The phantom was first imaged using a whole-body PET-MR scanner (mMR, Siemens Healthcare, Erlangen, Germany). The PET list-mode acquisition was performed for 10 min. MR acquisition was performed using the proposed 3D UTE/multi-echo Dixon sequence (Fig.1A) with the following imaging parameters: resolution = 1.875×1.875×1.875 mm3, TE = 70, 2110, 2810, 3550, 4250, 4990, 5690 μs, and acquisition time = ~1 min. UTE/multi-echo Dixon images were reconstructed using non-uniform fast Fourier transform (NUFFT)9 and SENSE10 reconstruction. The phantom was then imaged using a CT scanner (Biograph 64, Siemens Healthcare, Erlangen, Germany) with tube peak voltage = 120 kVp and tube current time product 30 = mAs. The CT images were reconstructed with in-plane resolution = 0.56×0.56 mm2 and slice-thickness = 1 mm. Water, fat, and bone signals were estimated using the signal model shown in Fig.1B. I(TEp) denote the image from the pth echo time with p = 1,⋯, 7, ρB, ρW, and ρF each denote the proton density signals of bone, water and fat, respectively, R2[asterisk] denote the single representative relaxation rate of both water and fat, Δffat denote the chemical shift of main-peak fat with respect to water, Δfoffset denote frequency offset to account for different fat components, and ΔfB0 denotes the frequency offset due to magnetic field inhomogeneity (B0). The pseudo-CT map was generated using the model shown in Fig.1C. μmapsoftdenotes the AC map of soft tissue only, FF denotes fat fraction, LACwater denotes the linear AC (LAC) of water (0.100 cm-1 at 511 keV5), LACfat denotes the LAC of fat (0.086 cm-1 at 511 keV5), μmapbonedenotes the AC map containing bone, BF denotes bone fraction, and LACbone denotes the linear AC (LAC) of bone (0.172 cm-1 at 511 keV5). The AC maps obtained by the proposed method were compared with those obtained by the two-point Dixon method implemented by the manufacturer and those from the CT scan as the ground truth using Pearson’s linear correlation. Results Noticeable swap of fat and water signals were observed from the water and fat images obtained from the scanner’s method (Fig.1D). Water, fat and bone maps were successfully obtained using the proposed method (Fig.1D). Continuous bone AC was successfully obtained using the proposed method over the bone region (Fig.1E). The pseudo-CT map generated from the proposed method showed visually similar representation over fat (yellow arrowhead) and bone regions (red arrows), showing higher correlation (r=0.90) with the CT map compared to the pseudo-CT map generated from the scanner’s method (r=0.85). Conclusion The proposed method can be used to obtain continuous water, fat and bone AC using MR and potentially can be used to generate subject-specific AC maps in PET/MR applications. Acknowledgements This work was partially supported by the National Institutes of Health (T32EB013180, R01CA165221, R01HL118261, R21EB021710, and P41EB022544).

Figure
  • Download figure
  • Open in new tab
  • Download powerpoint
Previous
Back to top

In this issue

Journal of Nuclear Medicine
Vol. 59, Issue supplement 1
May 1, 2018
  • Table of Contents
  • Index by author
Article Alerts
Sign In to Email Alerts with your Email Address
Email Article

Thank you for your interest in spreading the word on Journal of Nuclear Medicine.

NOTE: We only request your email address so that the person you are recommending the page to knows that you wanted them to see it, and that it is not junk mail. We do not capture any email address.

Enter multiple addresses on separate lines or separate them with commas.
PET-MR Attenuation Correction using 3D Multi-Echo Dixon-Based UTE Sequence
(Your Name) has sent you a message from Journal of Nuclear Medicine
(Your Name) thought you would like to see the Journal of Nuclear Medicine web site.
Citation Tools
PET-MR Attenuation Correction using 3D Multi-Echo Dixon-Based UTE Sequence
Paul Han, Debra Horng, Xiaochun Lai, Georges El Fakhri, Jinsong Ouyang, Chao Ma
Journal of Nuclear Medicine May 2018, 59 (supplement 1) 652;

Citation Manager Formats

  • BibTeX
  • Bookends
  • EasyBib
  • EndNote (tagged)
  • EndNote 8 (xml)
  • Medlars
  • Mendeley
  • Papers
  • RefWorks Tagged
  • Ref Manager
  • RIS
  • Zotero
Share
PET-MR Attenuation Correction using 3D Multi-Echo Dixon-Based UTE Sequence
Paul Han, Debra Horng, Xiaochun Lai, Georges El Fakhri, Jinsong Ouyang, Chao Ma
Journal of Nuclear Medicine May 2018, 59 (supplement 1) 652;
Twitter logo Facebook logo LinkedIn logo Mendeley logo
  • Tweet Widget
  • Facebook Like
  • Google Plus One
Bookmark this article

Jump to section

  • Article
  • Figures & Data
  • Info & Metrics

Related Articles

  • No related articles found.
  • Google Scholar

Cited By...

  • No citing articles found.
  • Google Scholar

More in this TOC Section

Instrumentation & Data Analysis Track

  • Deep Learning Based Kidney Segmentation for Glomerular Filtration Rate Measurement Using Quantitative SPECT/CT
  • The Benefit of Time-of-Flight in Digital Photon Counting PET Imaging: Physics and Clinical Evaluation
  • Preclinical validation of a single-scan rest/stress imaging technique for 13NH3 cardiac perfusion studies
Show more Instrumentation & Data Analysis Track

PET/MR Quantitation (Image Generation)

  • Attenuation Correction of PET/MR Using Deep Neural Network Based on Dixon and ZTE MR Images
  • Impact of attenuation map generation schemes in lesion quantification in prostate cancer patients with PET/MRI
Show more PET/MR Quantitation (Image Generation)

Similar Articles

SNMMI

© 2025 SNMMI

Powered by HighWire