


Article Figures & Data
Figures
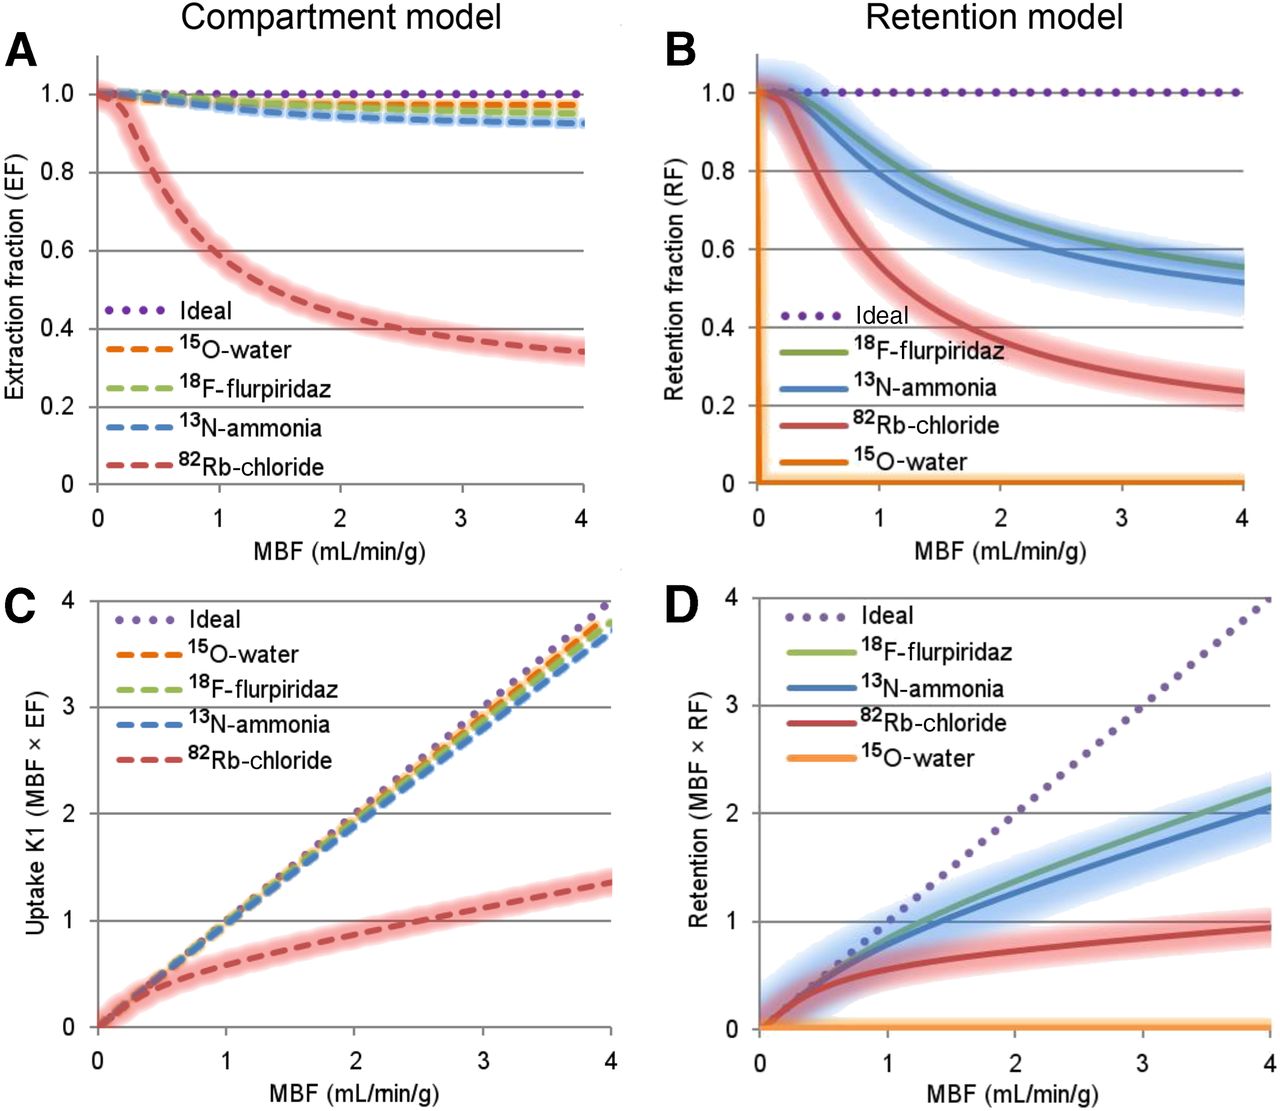
- FIGURE 1.
Radiotracer unidirectional extraction fractions (A) used with compartmental modeling of tracer uptake rates K1 (C), and radiotracer retention fractions (B) used with simplified retention modeling of tracer net uptake (D). Underlying data were obtained from previous publications (14,22,221,228,229). Limited data suggest that properties of 18F-flurpiridaz are similar to those of 13N-ammonia. Shaded regions represent variability in reported values.
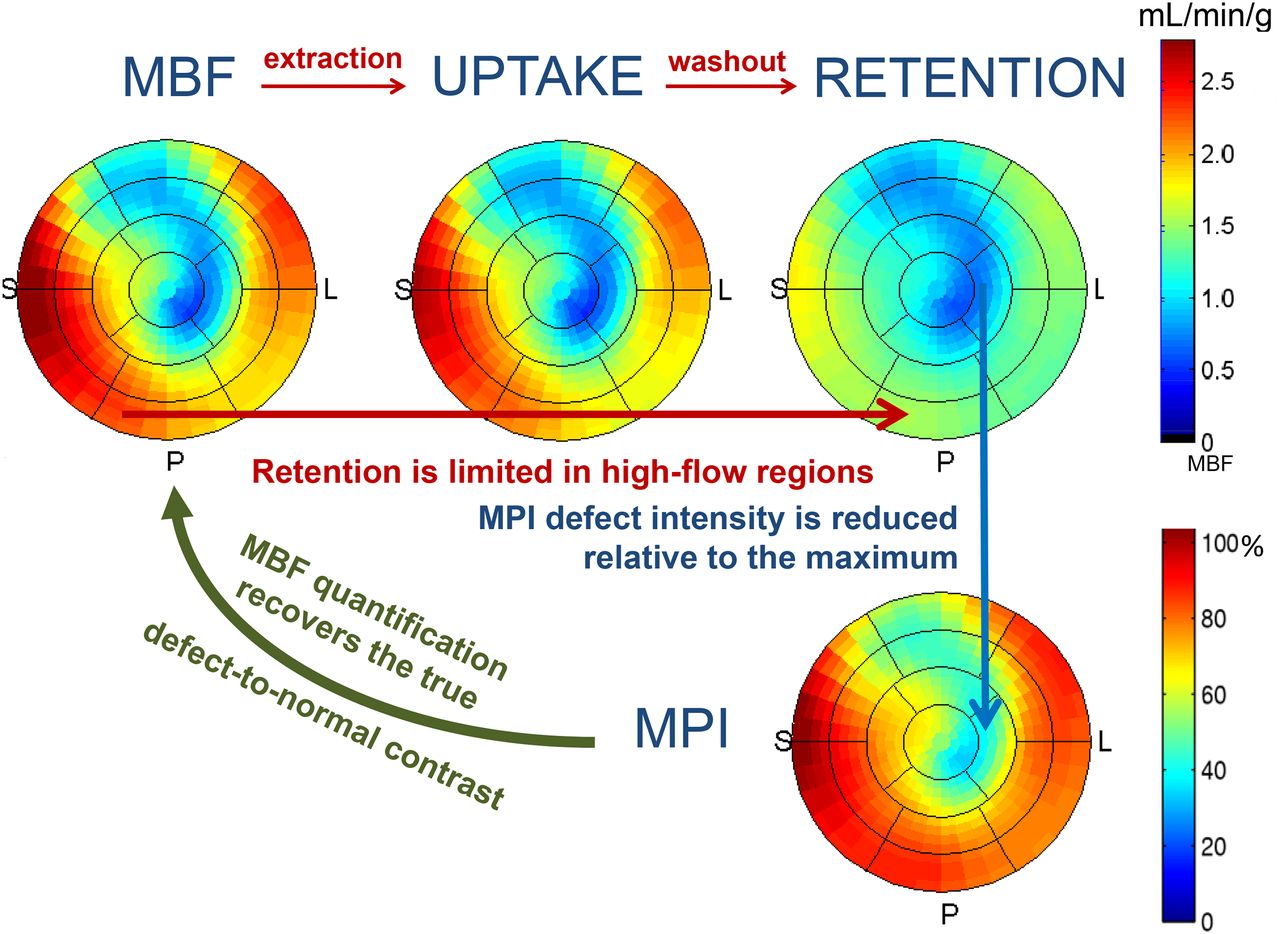
- FIGURE 2.
Polar maps demonstrating MBF, uptake, and retention along with their relationship to traditional relative MPI in example using 13N-ammonia. Uptake of tracer is determined by local MBF. However, because most PET tracers have incomplete extraction at higher MBFs, tracer uptake in high-MBF regions may be reduced (note that intense red regions on MBF image are less intense on uptake image). Furthermore, tracer retention is usually limited in high-MBF regions. Consequently, contrast between high- and low-MBF regions is further reduced on retention images. Standard myocardial perfusion images are produced by normalizing retention images such that regions of greatest retention are scaled to 100%. This does not restore contrast between defect and normal regions. MBF quantification restores contrast and adds absolute scale (mL/min/g).
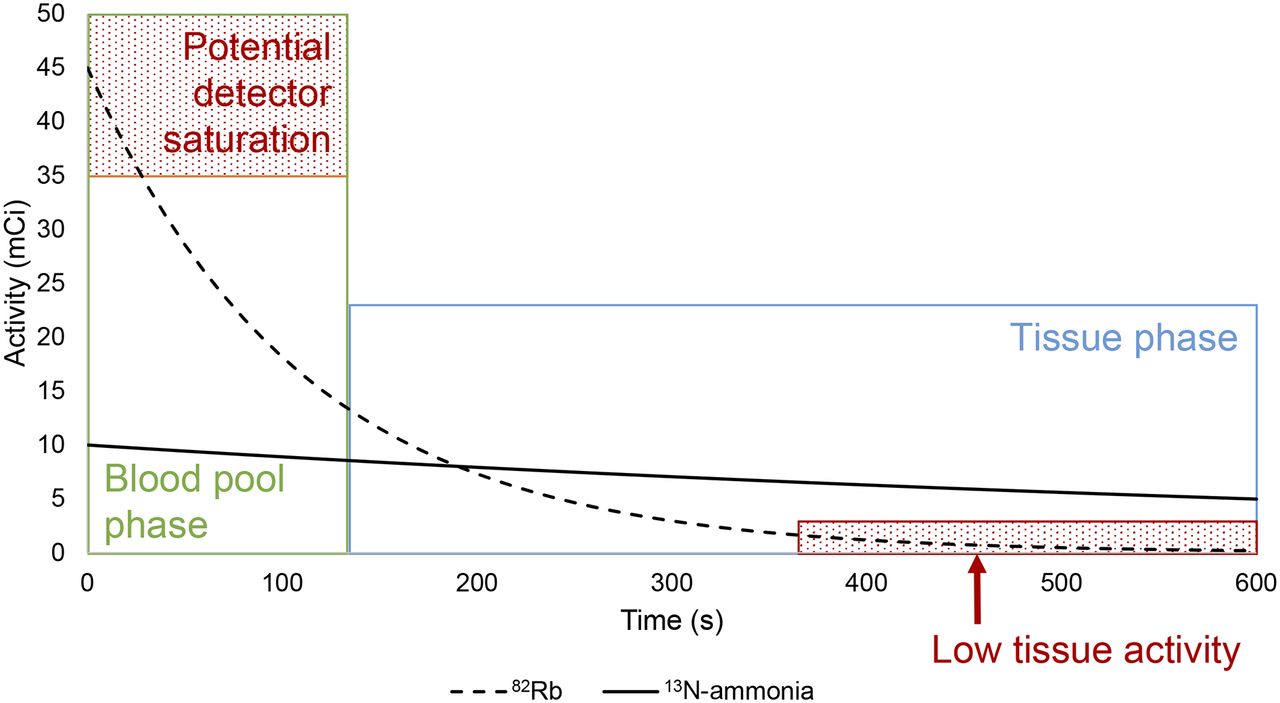
- FIGURE 3.
Decay of typical 370-MBq (10 mCi) dose of 13N-ammonia (solid black line) and 1,665-MBq (45 mCi) dose of 82Rb (dashed line). Because of the ultrashort half-life of 82Rb, higher activities must be administered to ensure reasonable counting rates during delayed tissue-phase imaging (blue region) for generation of gated and static images for MPI interpretation. However, this results in high counting rates during blood-pool phase (green region) and the potential for detector saturation. Actual threshold for detector saturation will vary with scanner performance.
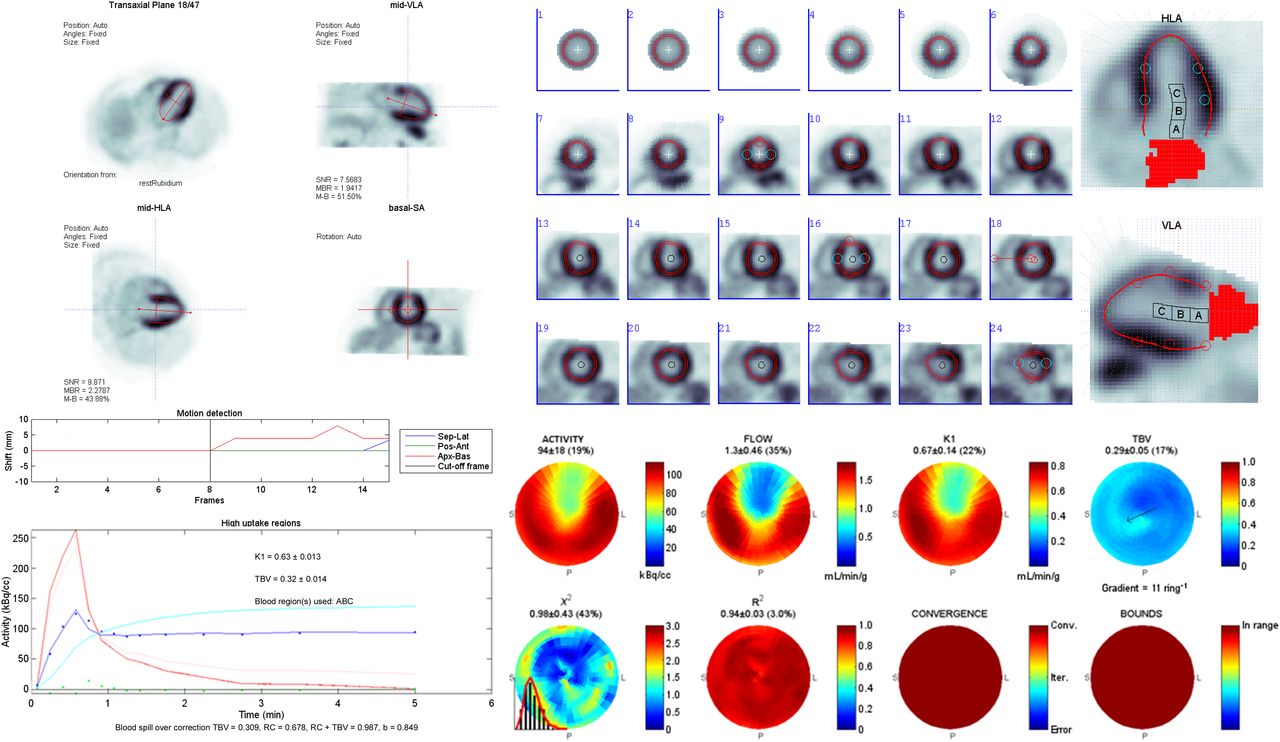
- FIGURE 4.
Example 82Rb stress PET study quality assurance for PET quantification of MBF, including orientation of left ventricular long axis (A), sampling of myocardium and arterial blood regions (B), motion detection, dynamic time–activity curves and kinetic modeling curve-fit (C), regional MBF (FLOW) and total blood volume (TBV) maps, as well as χ2 and R2 goodness-of-fit metrics (D).
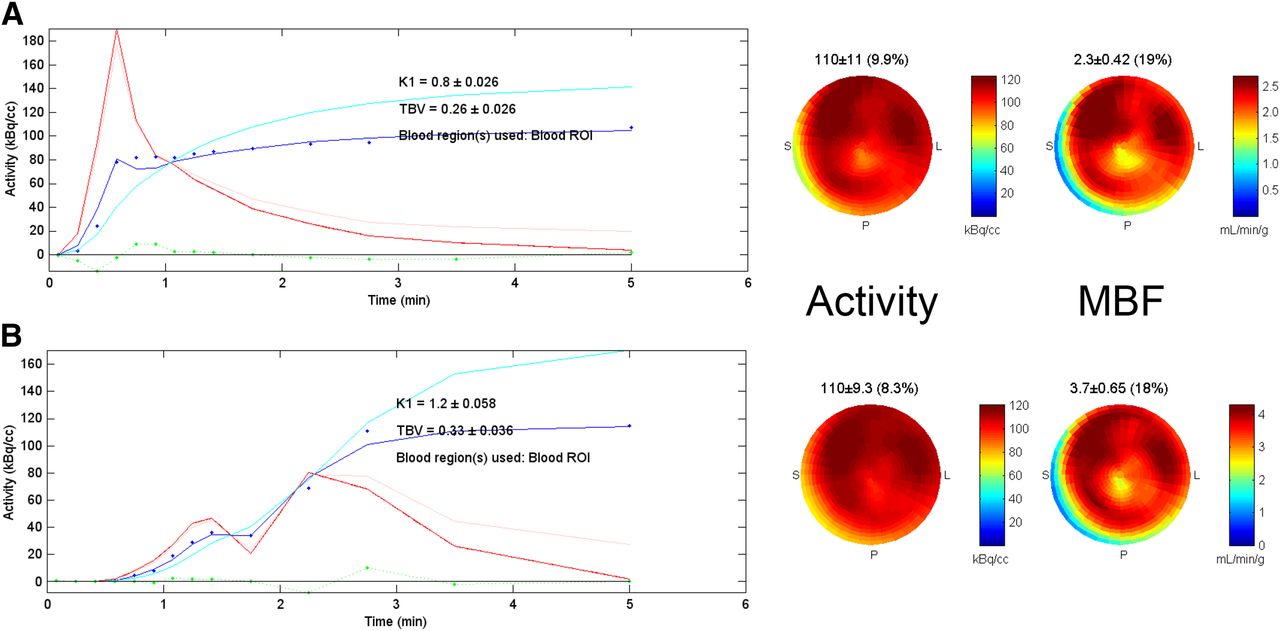
- FIGURE 5.
Test–retest dynamic 82Rb PET MBF scans acquired at 3 and 13 min after dipyridamole stress. Typical injection profile (A) is shown with single peak of blood input curve (red) at ∼30 s after scan start time. Poor-quality injection profile (B) shows delayed rise and double-peak of blood input curve, suggesting partial obstruction of intravenous line during tracer administration. Tracer uptake curves (dark blue) and polar maps (activity) are similar after 3–6 min, suggesting that full 82Rb dose was eventually delivered. However, inconsistent curve shapes result in markedly different MBF estimates (3.7 vs. 2.3 mL/min/g), as derived from blood-pool-spillover– and partial-volume–corrected tissue curves (cyan).
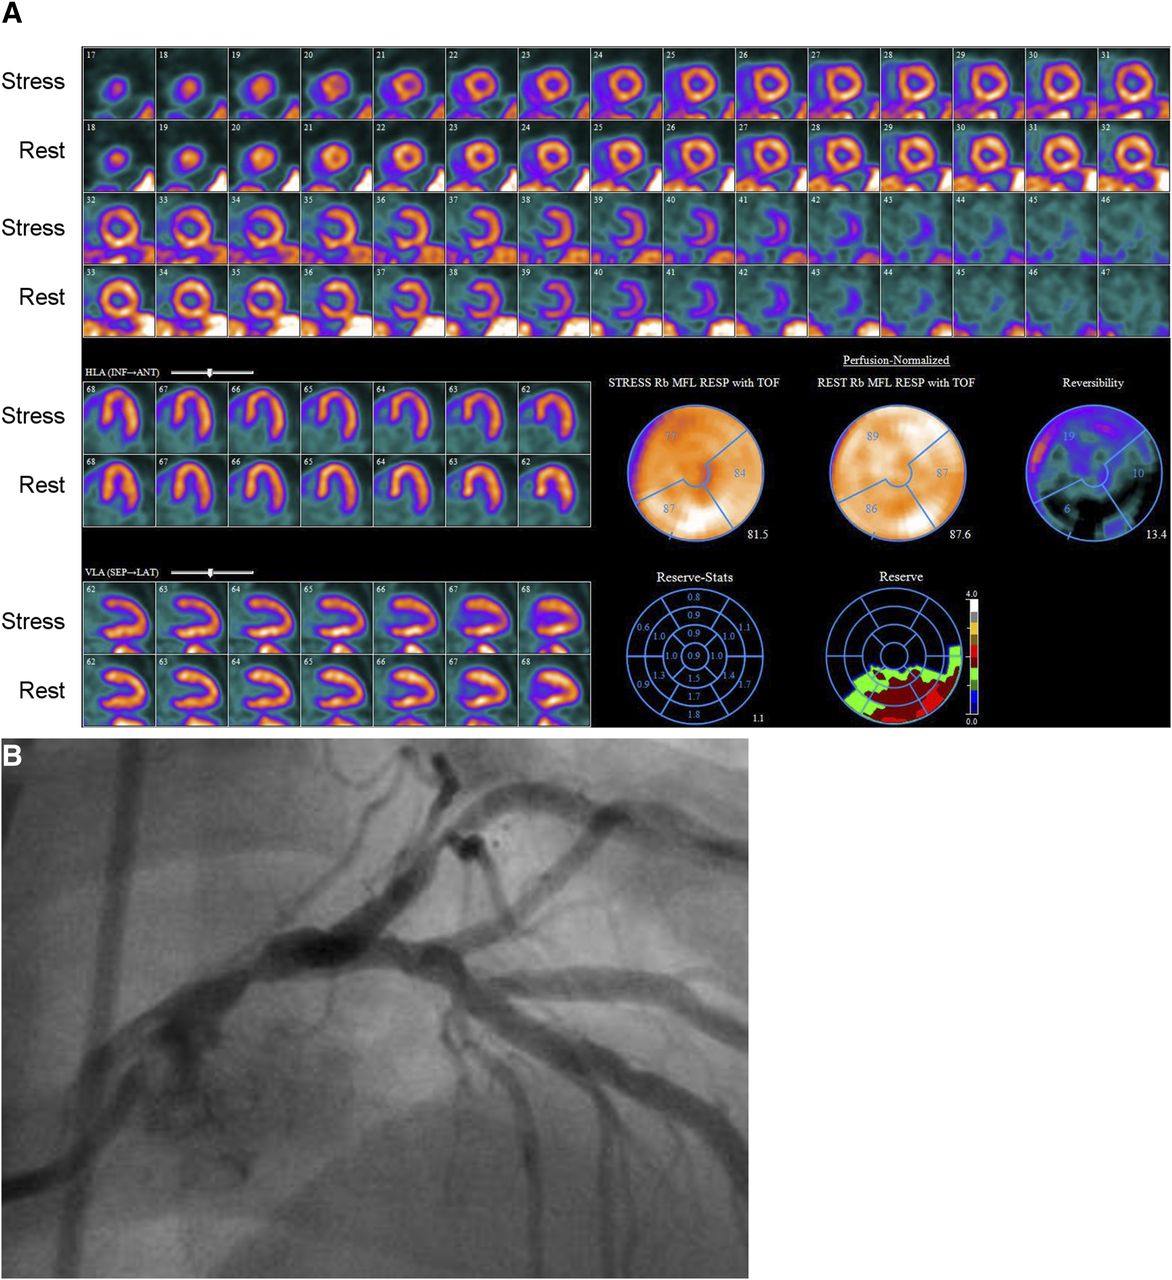
- FIGURE 6.
Clinical utility of blood flow quantification. In this example, from 81-y-old man with hypertension and dyslipidemia, relative MPI (A) with 82Rb PET demonstrated only mild, reversible perfusion abnormality involving distribution of left anterior descending coronary artery. However, MFR was severely reduced globally at 1.11. Nearly entire heart had severely reduced MFR except for inferior and inferolateral walls, where it was only moderately reduced. Coronary angiography (B) showed severe stenosis of mid portion of left main coronary artery.
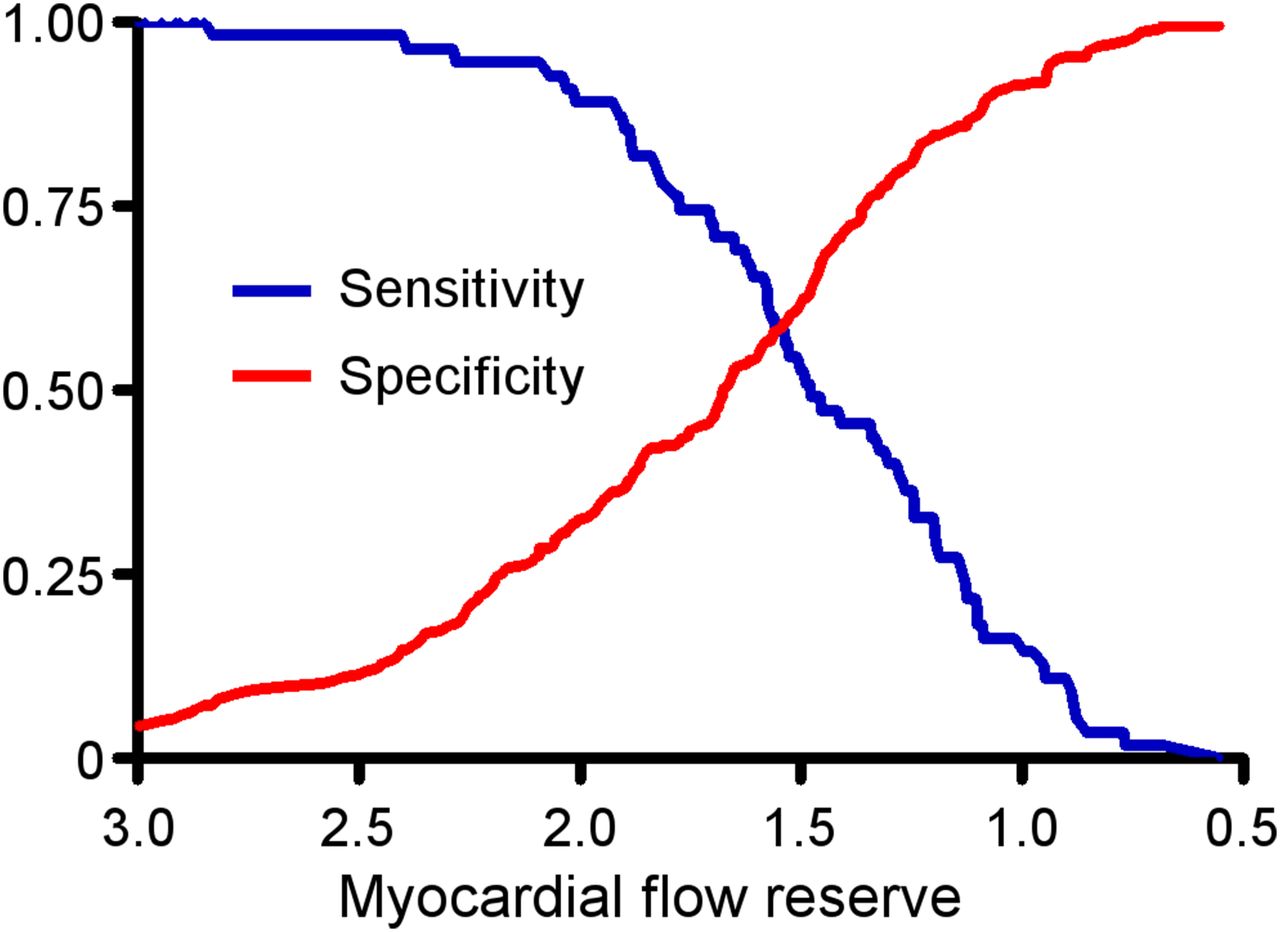
- FIGURE 7.
Receiver-operator characteristic curves for detection of severe CAD using MFR. As the threshold for abnormal MFR is decreased from 3.0 to 0.5, sensitivity for high-risk CAD (2-vessel disease including proximal left anterior descending artery, 3-vessel disease, and left main coronary artery) decreases (blue line). Conversely, with lower thresholds for defining abnormal MFR, specificity progressively increases (red line). (Adapted from Naya et al. (91).)
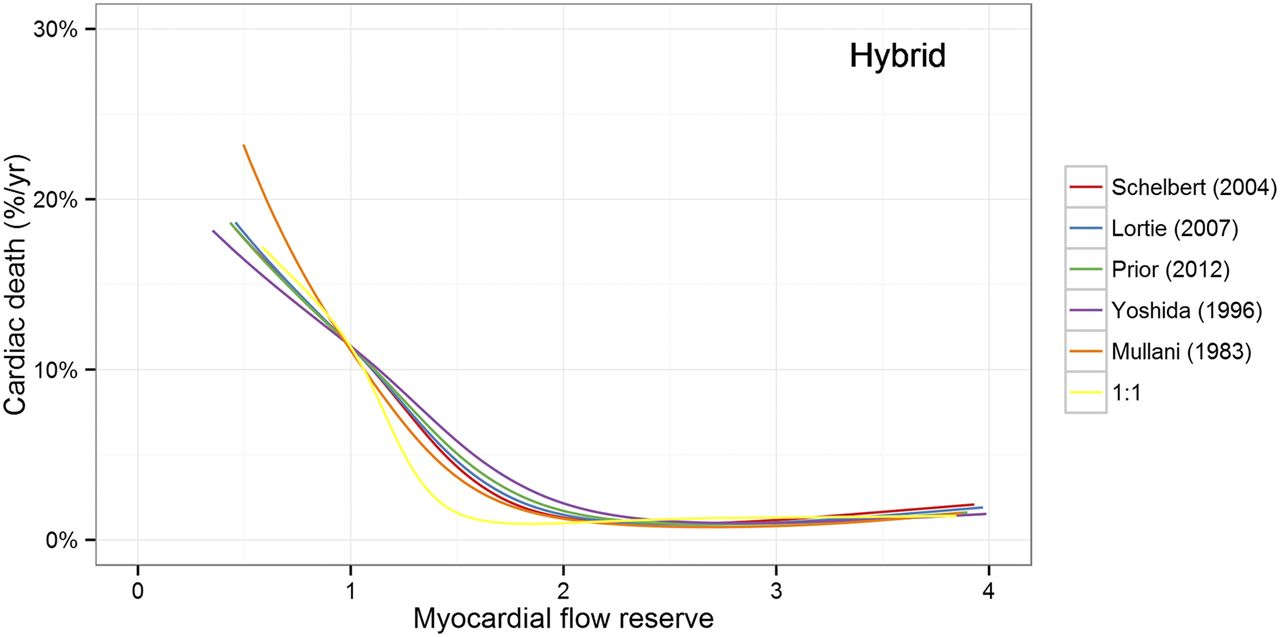
- FIGURE 8.
Relationship between MFR and risk of cardiac death. Regardless of which 82Rb tracer kinetic model is used, similar pattern of rising risk with MFR < 2 is seen. 1:1 indicates fictitious 100% extraction (MBF = K1), which approximates assumptions for myocardial perfusion reserve index. (Adapted from Murthy et al. (54).)
- FIGURE 9.
Comparison of physiologic basis of FFR and MFR. FFR is affected by focal stenosis and diffuse atherosclerosis of coronary macrocirculation, whereas index of microcirculatory resistance (IMR) reflects disease of smaller vessels. However, because intact arteriolar microcirculation is required for action of adenosine, FFR may be falsely reassuring in setting of microvascular dysfunction. MFR and CFR integrate entire coronary circulation. (Derived from De Bruyne et al. (230).)


Tables
Property 82Rb-chloride 13N-ammonia 15O-water 18F-flurpiridaz Isotope production method Generator Cyclotron Cyclotron Cyclotron Isotope half-life (min) 1.27 10 2.0 110 Positron range (mm) RMS 2.6 0.57 1.0 0.23 Image resolution (mm) FWHM 8 5 6 5 Effective dose (mSv/GBq) 1 2 1 20 Peak stress/rest* extraction (%) 35/70 95/100 100 95/100 Peak stress/rest* retention (%) 25/70 50/90 0 55/90 Spillover from adjacent organs Stomach wall Liver and lung Liver Early liver Regulatory status FDA-approved; 2 suppliers FDA-approved; ANDA required for onsite production Not FDA-approved Phase 3 trials partially completed Typical rest dose for 3D/2D (mCi†) 30/45 10/15 20/30 2/3 Typical stress dose for 3D/2D (mCi†) 30/45 10/15 20/30 6/7 Protocol features Rapid protocol Permits exercise‡; delay of 4–5 half-lives between rest and stress unless different doses used Rapid protocol; no tracer retention for routine MPI Permits exercise‡; different doses for rest and stress required ↵* Peak stress = 3–4 mL/min/g, rest = 0.75–1.0 mL/min/g.
↵† 1 mCi = 37 MBq.
↵‡ Exercise protocols do not allow quantification of MBF.
RMS = root mean square (standard) deviation; FWHM = full width at half maximum achievable using PET scanner with 5-mm spatial resolution; FDA = Food and Drug Administration; ANDA = abbreviated new drug application.
Agent Dose and administration Timing of radiotracer injection Route of radiotracer administration Adenosine 140 mg/kg/min intravenous infusion for 4–6 min Mid infusion Two intravenous lines are preferred to prevent mid-infusion interruption of adenosine Dipyridamole 0.56 mg/kg intravenous infusion over 4 min 3–5 min after completion of infusion Single intravenous line for both stress agent and radioisotope Regadenoson 0.4-mg rapid intravenous bolus (over 10 s) Immediately after 10-mL saline flush* Single intravenous line for both stress agent and radioisotope Dobutamine Stepwise increase in infusion from 5 or 10 μg/kg/min up to 40 μg/kg/min to achieve >85% predicted heart rate; atropine boluses may be used to augment heart rate response Once target heart rate is achieved; continue dobutamine infusion for 1–2 min after radiotracer injection Single intravenous line for both stress agent and radioisotope ↵* One recent study has suggested that injection of 82Rb at 55 s, compared with 10 s, after injection of regadenoson resulted in greater maximal hyperemic MBF (2.33 ± 0.57 vs. 1.79 ± 0.44 mL/min/g) and correlated better with hyperemic MBF with dipyridamole (2.27 ± 0.57 mL/min/g) (211).
Publication Sample size (n) Age (y) Stress agent Rest MBF (mL/min/g) Stress MBF (mL/min/g) MFR Hutchins et al. (212) 7 24 ± 4 Dipyridamole 0.88 ± 0.17 4.17 ± 1.12 4.80 ± 1.30 Chan et al. (213) 20 35 ± 16 Dipyridamole 1.10 ± 0.20 4.33 ± 1.30 4.00 ± 1.30 Czernin et al. (67) 18 31 ± 9 Dipyridamole 0.76 ± 0.25 3.00 ± 0.80 4.1 ± 0.90 Czernin et al. (38) 11 27 ± 7 Dipyridamole NR 2.13 ± 0.28 NR Nagamachi et al. (21) 30 33 ± 15 Dipyridamole/adenosine 0.62 ± 0.14 2.01 ± 0.39 NR Yokoyama et al. (163) 14 56 ± 10 Dipyridamole 0.70 ± 0.17 2.86 ± 1.20 4.13 ± 1.38 Böttcher et al. (214) 10 24 ± 5 Dipyridamole 0.61 ± 0.09 1.86 ± 0.27 3.16 ± 0.80 Campisi et al. (215) 10 62 ± 6 Dipyridamole 0.68 ± 0.16 2.04 ± 0.30 3.16 ± 0.85 Nitzsche et al. (216) 15 28 ± 12 Adenosine 0.64 ± 0.09 2.63 ± 0.75 NR Dayanikli et al. (159) 11 48 ± 8 Adenosine 0.68 ± 0.80 2.64 ± 0.39 4.27 ± 0.52 Sawada et al. (73) 6 36 ± 14 Adenosine 0.71 ± 0.12 2.49 ± 0.74 3.50 ± 0.69 Beanlands et al. (86) 5 27 ± 4 Adenosine 0.62 ± 0.09 2.51 ± 0.27 4.10 ± 0.71 Muzik et al. (217) 10 26 ± 6 Adenosine 0.77 ± 0.16 3.40 ± 0.57 4.60 ± 0.90 Muzik et al. (88) 20 44 ± 11 Adenosine 0.67 ± 0.11 2.85 ± 0.49 4.28 ± 0.65 Lortie et al. (22) 14 NR Dipyridamole 0.69 ± 0.09 2.71 ± 0.50 4.25 ± 0.91 DeGrado et al. (218) 8 NR Dipyridamole 0.76 ± 0.17 2.68 ± 0.75 3.61 ± 1.06 Tawakol et al. (71) 7 NR Adenosine 0.70 ± 0.19 3.51 ± 0.84 NR Schindler et al. (219) 21 37 ± 13 Dipyridamole 0.61 ± 0.12 2.04 ± 0.37 NR Quercioli et al. (70) 21 43 ± 11 Dipyridamole 0.71 ± 0.10 2.37 ± 0.49 3.38 ± 0.67 Valenta et al. (220) 26 38 ± 10 Dipyridamole 0.71 ± 0.13 2.29 ± 0.51 3.28 ± 0.70 Prior et al. (68) 50 42 ± 13 Dipyridamole/adenosine 0.64 ± 0.12 1.98 ± 0.44 3.40 ± 1.00 Renaud et al. (221) 14 31 ± 6 Dipyridamole 0.68 ± 0.12 2.86 ± 1.14 4.15 ± 1.57 Slomka et al. (27) 15 NR Adenosine 0.85 ± 0.16 2.77 ± 0.65 3.39 ± 1.22 Weighted mean 363 (total) 37.6 0.71 2.58 3.54 NR = not reported.
Publication Sample size (n) Age (y) Stress agent Rest MBF (mL/min/g) Stress MBF (mL/min/g) MFR Lin et al. (222) 11 NR Dipyridamole 1.15 ± 0.46 2.50 ± 0.54 NR Lortie et al. (22) 14 NR Dipyridamole 0.69 ± 0.14 2.83 ± 0.81 4.25 ± 1.37 Manabe et al. (223) 15 29 ± 9 Adenosine triphosphate 0.77 ± 0.25 3.35 ± 1.37 4.47 ± 1.47 Prior, et al. (224) 22 30 ± 13 Adenosine 1.03 ± 0.42 3.82 ± 1.21 3.88 ± 0.91 Sdringola et al. (225) 56 30 ± 13 Dipyridamole 0.72 ± 0.17 2.89 ± 0.50 4.17 ± 0.80 Johnson et al. (171) 241 28 ± 5 Dipyridamole 0.70 ± 0.15 2.71 ± 0.58 4.02 ± 0.85 Germino et al. (226) 9 28 ± 6 Regadenoson 0.92 ± 0.19 3.65 ± 0.64 NR Renaud et al. (221) 14 31 ± 6 Dipyridamole 0.73 ± 0.15 2.96 ± 0.89 4.32 ± 1.39 Weighted mean 382 (total) 28.6 0.74 2.86 4.07 NR = not reported.
Study Subjects (n) Population Follow-up duration (y) Primary endpoint Radiotracer Adjusted covariates Hazard ratio Herzog et al. (49) 256 Suspected myocardial ischemia 5.4 MACE 13N-ammonia Age, diabetes, smoking, abnormal perfusion (binary) 1.6 (MFR < 2.0 vs. ≥ 2.0) Tio et al. (94) 344 Ischemic heart disease 7.1 Cardiac death 13N-ammonia Age, sex 4.1 (per 0.5 MFR) Slart et al. (93) 119 PET-driven revascularization 7.3 Cardiac death 13N-ammonia Age, sex 23.6 (MFR < 1.34 vs. > 1.67); 8.3 (MFR 1.34–1.67 vs. > 1.67) Murthy et al. (50) 2,783 Clinically indicated PET 1.4 Cardiac death 82Rb Age, sex, hypertension, dyslipidemia, diabetes, family history of premature CAD, tobacco use, history of CAD, body mass index, chest pain, dyspnea, early revascularization, rest LVEF, summed stress score, LVEF reserve 5.6 (MFR < 1.5 vs. > 2.0); 3.4 (MFR 1.5–2.0 vs. > 2.0) Fukushima et al. (92) 224 Clinically indicated PET 1.0 MACE 82Rb Age, summed stress score (dichotomized > 4) 2.9 (MFR < 2.11 vs. ≥ 2.11) Ziadi et al. (53) 677 Clinically indicated PET 1.1 MACE 82Rb History of MI, stress LVEF, summed stress score (dichotomized ≥ 4) 3.3 (MFR < 2.0 vs. > 2.0) Farhad et al. (227) 318 Suspected myocardial ischemia 1.7 MACE 82Rb Summed stress score 0.41 per mL/min/g stress MBF MACE = major adverse cardiac events (cardiac death, nonfatal MI, late revascularization, cardiac hospitalization); LVEF = left ventricular ejection fraction; MI = myocardial infarction.
Report MFR any time MFR adds value toward diagnosis or stratification Be cautious reporting MFR† when MFR provides no diagnostic or prognostic value, might confuse management, or might lead to unnecessary tests Normal perfusion, high normal MFR History of conditions known to impair long-term microvascular function Abnormal perfusion with more severely or diffusely reduced MFR than expected Chronic renal failure Microvascular measurements specifically requested Prior coronary artery bypass grafting Assessment of hemodynamic significance of lesion specifically requested Global left ventricular dysfunction (suspected cardiomyopathy) Accurate MFR measurement not possible or might be misleading Large prior myocardial infarction Suspected caffeine/methylxanthine ingestion


Jump to section
Related Articles
Cited By...
- Patient Motion During Cardiac PET Imaging
- PET/CT with Myocardial Blood Flow Assessment Is Prognostic of Cardiac Allograft Vasculopathy Progression and Clinical Outcomes
- Total-Body PET/CT Applications in Cardiovascular Diseases: A Perspective Document of the SNMMI Cardiovascular Council
- Automated Motion Correction for Myocardial Blood Flow Measurements and Diagnostic Performance of 82Rb PET Myocardial Perfusion Imaging
- Long-Term Prognostic Value of 82Rb PET/CT-Determined Myocardial Perfusion and Flow Reserve in Cancer Patients
- Sex Differences and Caffeine Impact in Adenosine-Induced Hyperemia
- Predictive Model for 82Rb Generator Bolus Times as a Function of Generator Lifetime
- Simulation of Low-Dose Protocols for Myocardial Perfusion 82Rb Imaging
- Assessing mental stress on myocardial perfusion and myocardial blood flow in women without obstructive coronary disease: protocol for a mechanistic clinical trial
- Pharmacologic Stress Testing: Its Roots, Its Impact, and Its Future (perspective on "Myocardial Imaging with Thallium-201: Effect of Cardiac Drugs on Myocardial Images and Absolute Tissue Distribution" J Nucl Med. 1978;19:10-16)
- Cardiac Imaging for Coronary Heart Disease Risk Stratification in Chronic Kidney Disease
- Appropriate Use Criteria for PET Myocardial Perfusion Imaging
- Coronary Microvascular Dysfunction: Clinical Considerations and Noninvasive Diagnosis
- Quality Improvement Initiatives to Assess and Improve PET/CT Injection Infiltration Rates at Multiple Centers
- Technologist Approach to Global Dose Optimization