


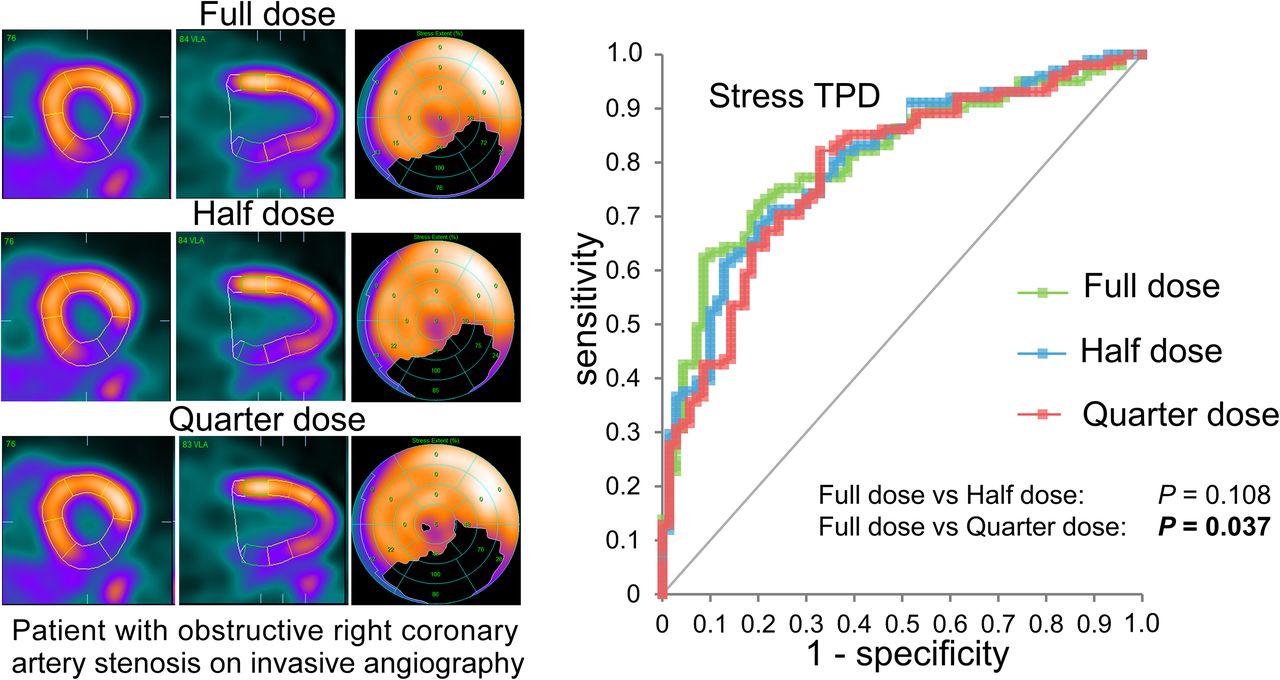
Visual Abstract
Abstract
Quantification of myocardial perfusion and myocardial blood flow using 82Rb PET is increasingly used for assessment of coronary artery disease. Current guidelines suggest injections of 1,100–1,500 MBq for both stress and rest. Reducing the injected dose avoids PET system saturation in first-pass flow images and reduces radiation exposure, but the impact on myocardial perfusion quantification of static perfusion images is not fully understood. In this study, we aimed to evaluate the feasibility of performing myocardial perfusion scans using either a half-dose (HfD) or quarter-dose (QD) protocol using reconstructions from acquired full-dose (FD) scans. Methods: This study comprised 171 patients who underwent rest/stress 82Rb PET with a 3-dimensional 4-ring PET/CT scanner using a FD protocol and invasive coronary angiography within 6 mo of the PET emission scan. HfD and QD reconstructions were obtained using the prescribed percentage of events from the FD list-mode files. The total perfusion deficit was quantified for rest (rTPD), stress (sTPD), and ischemia (ITPD = sTPD − rTPD). Diagnostic accuracy for obstructive coronary artery disease, defined as at least 70% stenosis in any of the 3 major coronary arteries, was compared with area under the receiver-operating-characteristic curve (AUC). Results: Patients with a median body mass index of 28.0 (interquartile range, 23.9–31.7) were injected with doses of 1,165 ± 189 MBq of 82Rb. For sTPD, FD and HfD protocols had similar AUCs (FD, 0.807; HfD, 0.802; P = 0.108), whereas QD had a reduced AUC (0.786, P = 0.037). There was no difference in the AUC obtained for ITPD among the 3 protocols (FD, 0.831; HfD, 0.835; QD, 0.831; all P ≥ 0.805). Conclusion: HfD imaging does not affect the quantitative diagnostic accuracy of 82Rb PET on 3-dimensional PET/CT systems and could be used clinically.
Myocardial perfusion imaging (MPI) is one of the most commonly performed diagnostic tests in cardiology, with several tracers existing for PET (1). Of these, 82Rb is one of the most widely used tracers as it permits quantification of myocardial blood flow and MPI in centers without access to cyclotrons (2–4). Current guidelines from both North America (1,4) and Europe (5) are still based on the older 2-dimensional PET technology and suggest injections of 1,100–1,500 MBq of 82Rb for both stress and rest. In our recent study (6), we found that halving the dose reduced the risk of PET system saturation (0% of reported cases) in comparison to a full dose (FD) (20% of reported cases) for the myocardial blood flow protocols. However, it is not fully understood how reduction of the injected 82Rb dose would affect the quantitation of relative myocardial perfusion from static images, which remains the key clinical assessment (4,5).
To this end, this study evaluated if the use of a half-dose (HfD) and a quarter-dose (QD) protocol affects the diagnostic accuracy of static myocardial perfusion of 82Rb using reconstructions obtained from the FD data.
MATERIALS AND METHODS
Study Population
In total, 171 patients without a prior history of coronary artery disease (CAD) were included retrospectively in this study. A history of CAD was defined as previous myocardial infarction or revascularization (7). All patients underwent a routine 82Rb rest/stress PET imaging protocol using either adenosine (99 patients, 58%) or regadenoson (72 patients, 42%) pharmacologic stress. This study included only patients who had invasive coronary angiography within 6 mo (mean, 14 d; range, 0–170 d) according to clinical indications (8). The institutional review board approved this retrospective study, and all subjects gave written informed consent.
Imaging Protocol and Dose Reduction
All patients underwent rest/stress imaging protocols in a Siemens Biograph 64 TruePoint with True V using targeted doses of 925–1,500 MBq for both rest and stress MPI depending on the age of the 82Rb generator (8). The patients were instructed to abstain from all caffeine for 24 h before the tests, fast for at least 6 h, and not take antianginal drugs on the morning of the test. A low-dose CT attenuation correction scan was acquired for both PET studies (100 kV; pitch, 1.5; 11 mAs). Pharmacologic stressing of the patients was achieved using an intravenous infusion of adenosine (140 mg/kg/min; duration, 6 min) or a bolus injection of regadenoson (0.4 mg). Stress MPI scans were initiated 3 min after initiation of the adenosine injection or 10–20 s after injection of regadenoson to ensure optimal coronary vasodilation, with images acquired for 6 min.
Dose Reduction
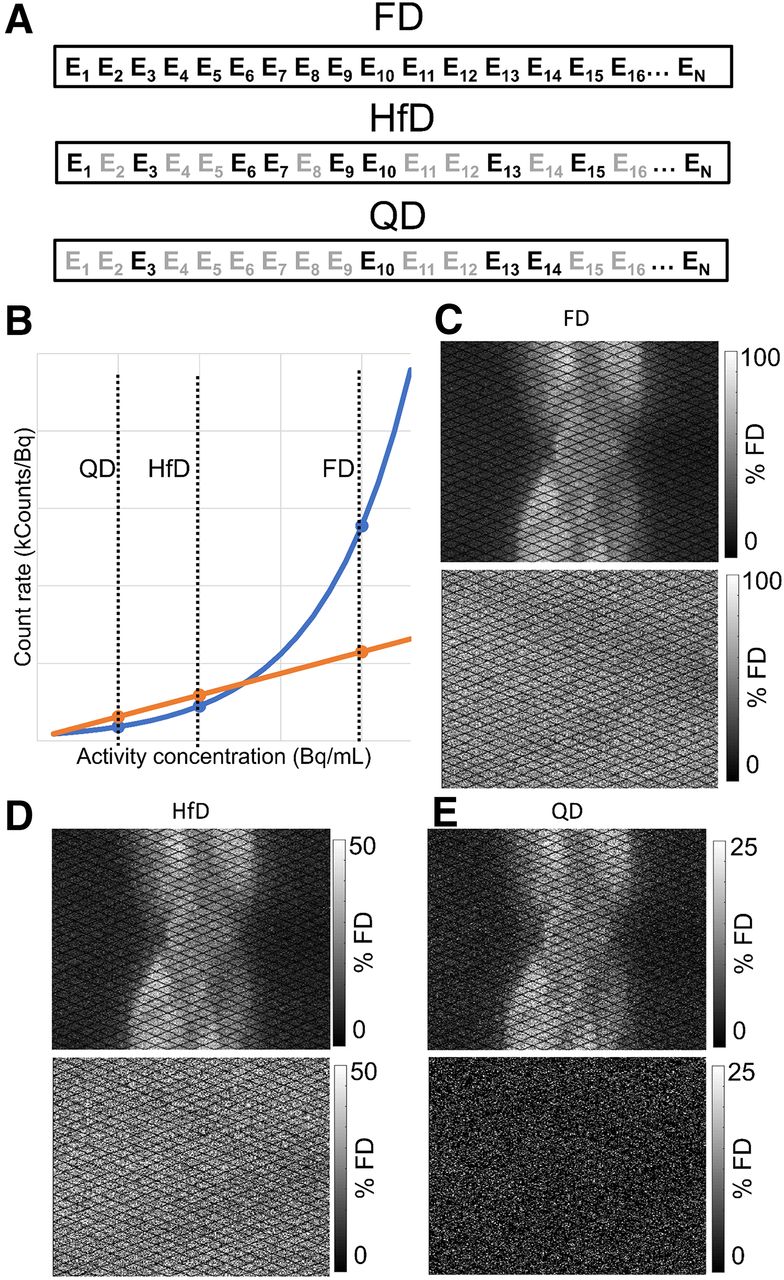
HfD and QD reconstructions were obtained from the FD scans by selecting subsets of the recorded events from the FD list-mode files with replacement of the removed counts using randomized sampling with bootstrapped selection of the data (9). For the HfD and QD scans, the count rates of the true events were reduced linearly, reflecting the dose reduction (HfD, 1:2; QD, 1:4), whereas the random events were downsampled using a square reduction of the count rates to compensate for the changes in noise-equivalent count rate (Fig. 1) (10). Although the noise-equivalent count rate curves are system-specific, they follow the same patterns until PET system saturation is achieved. Using the reduced list-mode files, 3-dimensional sinograms were created for both the HfD and the QD scans.

Simulation of HfD and QD protocols by removing counts from list-mode data. (A) Dose reduction for prompt events is shown; events (Ex) were removed randomly (grayed-out counts) by removing 50% (HfD) or 75% (QD) of counts following noise-equivalent count rate curve (B: orange curve). Randoms (B: blue curve) follow an approximately square reduction when dose is halved. (C) Sinograms obtained for acquired PET data. (D and E) Simulated HfD and QD sinograms used for reconstructions. Count reductions were performed directly in PET list-mode data. Contrast in C–E is scaled according to count rate obtained for FD scan.
Image Reconstructions
Static PET images were reconstructed using 4 min of data, starting at the second minute after injection of 82Rb to ensure blood pool clearance of 82Rb (8). All datasets were reconstructed in batch mode using a vendor-provided reconstruction toolbox (JS Recon; Siemens). The reconstructions used an attenuation-weighted ordered-subset expectation maximization reconstruction algorithm (iterative reconstruction) using 4 iterations and 4 subsets, followed by Butterworth filtration (cutoff frequency, 5 Hz; order, 12). The images were reconstructed using a 256 × 256 × 109 matrix, resulting in a spatial resolution of 4.07 × 4.07 × 2.03 mm. An additional image series of data reconstructed using 3 iterations and 24 subsets, followed by an 8-mm gaussian filter, was also evaluated. All PET images were reconstructed using automatic registration of the CT attenuation correction maps when deemed necessary by the technologists (8).
Image Processing and Quantitative Perfusion Assessment
All images were processed automatically in a batch-mode format using QPET software (Cedars-Sinai Medical Center) (11). The left ventricle was delineated automatically (12) and corrected manually by a nuclear cardiology expert when deemed necessary (8). The accuracy of the automatic segmentation of the left ventricular wall was based on visual assessments, including evaluations of the blood-pool activity and the uptake patterns observed for the blood pool and left ventricular wall. All assessments were performed by an experienced nuclear medicine specialist. Rest and stress total perfusion deficit (rTPD and sTPD, respectively) were reported for all patients (13). Ischemic total perfusion deficit (ITPD) was calculated as the difference between the sTPD and rTPD. The overall analyses including all 171 patients, as well as 2 subgroups (body mass index [BMI] < 30 kg/m2 [n = 109], and BMI ≥ 30 kg/m2 [n = 62]), were evaluated to test for differences in the quantitative assessment of obese and normal-weight–to–overweight patients.
Image Quality
To assess the overall image quality of the data, contrast-to-noise ratio and blood pool noise measured as the coefficient of variation were calculated for all images (14). The overall noise in images was calculated as the coefficient of variation obtained in the left ventricular blood pool (Fig. 2):

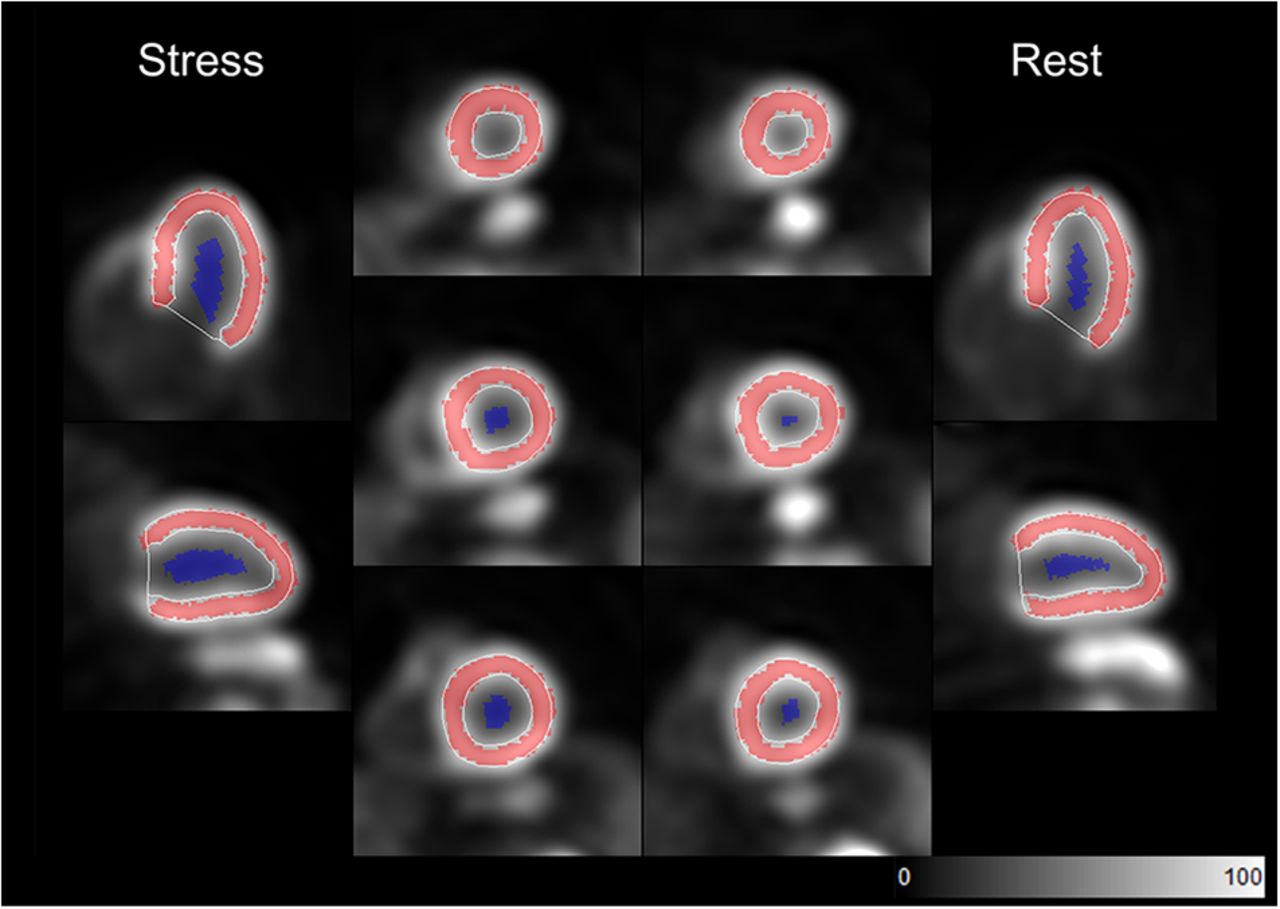
Segmentation of left ventricular wall and blood pool on 82Rb MPI scans. Red overlay represents segmentation of left ventricle, whereas blue area delineates volume in ventricle used for blood and contrast-to-noise analyses.
Contrast-to-noise ratio was calculated as the difference in the average uptake in the myocardium and blood pool, divided by the noise in the blood pool (calculated as the SD):
In the equation, ventricularVOI represents the segmentation of the left ventricle.
All quantitative image quality parameters were derived fully automatically in batch mode. The blood pool noise and contrast-to-noise ratio were calculated from automatic segmentations of the left ventricle and blood pool, which were shrunk by 60% to limit the spillover effects between blood and tissue uptake (Fig. 2). The blood pool regions of interest are generated by contracting the endocardial walls with respect to the mid myocardial wall.
Invasive Coronary Angiography
Patients had invasive coronary angiography within 14 ± 27 d of MPI during the study period ranging from January 2008 to September 2012. Stenosis severity was evaluated by 2 experienced interventional cardiologists. Stenosis of at least 70% in the left anterior descending, left circumflex, or right coronary arteries or of at least 50% in the left main coronary artery was considered to indicate the presence of obstructive CAD.
Statistical Analysis
Continuous variables are presented as mean and SD. Categoric variables are presented as absolute numbers with percentages. Statistical analyses were performed with Analyze-it software (version 5.40.2; Analyze-it Software Ltd.). Receiver-operating-characteristic curve analyses were compared using the method of DeLong et al. (15), using the area under the curve (AUC) as the primary endpoint for this study. The correlation between the FD and HfD/QD images was reported as Bland–Altman plots and repeatability coefficients. Comparisons of contrast-to-noise ratio and blood pool noise were performed using Kruskal–Wallis tests. Differences in requirements for manual adjustments for automatic segmentation of the left ventricle were calculated using χ2 statistics in R. P values of less than 0.05 were considered significant.
RESULTS
Injected Doses and Patient Characteristics
The patients were injected with 1,165 ± 189 MBq of 82Rb for the stress MPI scans (FD dose scans), and the HfD and QD reconstructions were equivalent to 581 ± 100 MBq and 290 ± 50 MBq, respectively. The corresponding body weight–corrected doses were equivalent to 15.0 ± 3.8 MBq/kg, 7.5 ± 1.9 MBq/kg, and 3.8 ± 1.0 MBq/kg for the FD, HfD, and QD protocols, respectively. Patient characteristics are shown in Table 1.
Participant Characteristics
Automatic Segmentation of Left Ventricle
Automatic segmenting of the left ventricle was successful without the need for manual adjustment of contours on either rest and stress scans in 90.1% (154/171), 86.0% (147/171), and 83.0% (142/171) of the cases for the FD, HfD, and QD reconstructions, respectively (Table 2). The frequency of manual adjustments using HfD or QD reconstructions was similar to that using FD reconstruction (Table 2).
Success Rate of Automatic Delineations of Left Ventricle in QPET
Quantification
sTPD and ITPD were quantified successfully for all 171 patients for the FD, HfD, and QD protocols. Of the 171 patients, 111 (65%) had automatic registration of the PET emission data and CT attenuation correction maps performed (8).
Stress Perfusion Analysis
In total, 47 patients had 1-vessel CAD, 26 patients had 2-vessel CAD, and 22 patients had 3-vessel CAD (Table 1). Diagnostic accuracy for obstructive CAD was calculated for sTPD quantification for all 3 reconstructions (FD, HfD, and QD). A similar AUC was reported for the FD and HfD reconstructions (FD, 0.807; HfD, 0.802; P = 0.108), whereas the QD reconstructions had a reduced AUC compared with FD scans (0.786, P = 0.037) (Fig. 3A). No differences were reported in the AUC analyses for FD, HfD, and QD protocols between patients with a BMI of less than 30 and patients with a BMI of 30 or more; likewise, the AUC analyses found no differences in quantitative accuracy between the 2 groups (Supplemental Fig. 1; supplemental materials are available at http://jnm.snmjournals.org). Results for the second image series are shown in Supplemental Fig. 2. Bland–Altman plots revealed that sTPD assessments by HfD reconstruction were comparable to the FD reconstructions (P = 0.08), whereas a bias of 3% (P = 0.01) was observed between the FD and QD assessments (Supplemental Fig. 3); results for the obese versus nonobese group are shown in Supplemental Figures 4 and 5. Repeatability coefficients of 5% and 7% were reported for the FD when compared with the HfD and QD, respectively (Supplemental Fig. 3). No dependency on the bias and body weight–corrected doses was observed (Supplemental Fig. 3). Similarly, no BMI dependency on the bias was observed for the 2 subgroups (Supplemental Figs. 4 and 5).

Diagnostic performance of quantitative perfusion assessment, as depicted by receiver-operating-characteristic curves for sTPD (A) and ITPD (B) obtained for FD, HfD, and QD reconstruction protocols. For sTPD, similar AUC was observed for FD and HfD, whereas QD was significantly reduced (A). NS = nonsignificant.
Ischemic Perfusion Analysis
No differences in diagnostic accuracy were observed for ITPD obtained using the FD, HfD, and QD protocols, with AUCs of 0.831, 0.835, and 0.831 (all P ≥ 0.805), respectively (Fig. 3B). Comparable ITPD assessments were obtained for all 3 reconstruction protocols, with corresponding high reproducibility for all (repeatability coefficient: FD vs. HfD, 3.6%; FD vs. QD, 5.0%). There was no significant difference in AUC between obese and nonobese patients for all 3 protocols (Supplemental Figs. 1C and 1D).
Image Quality
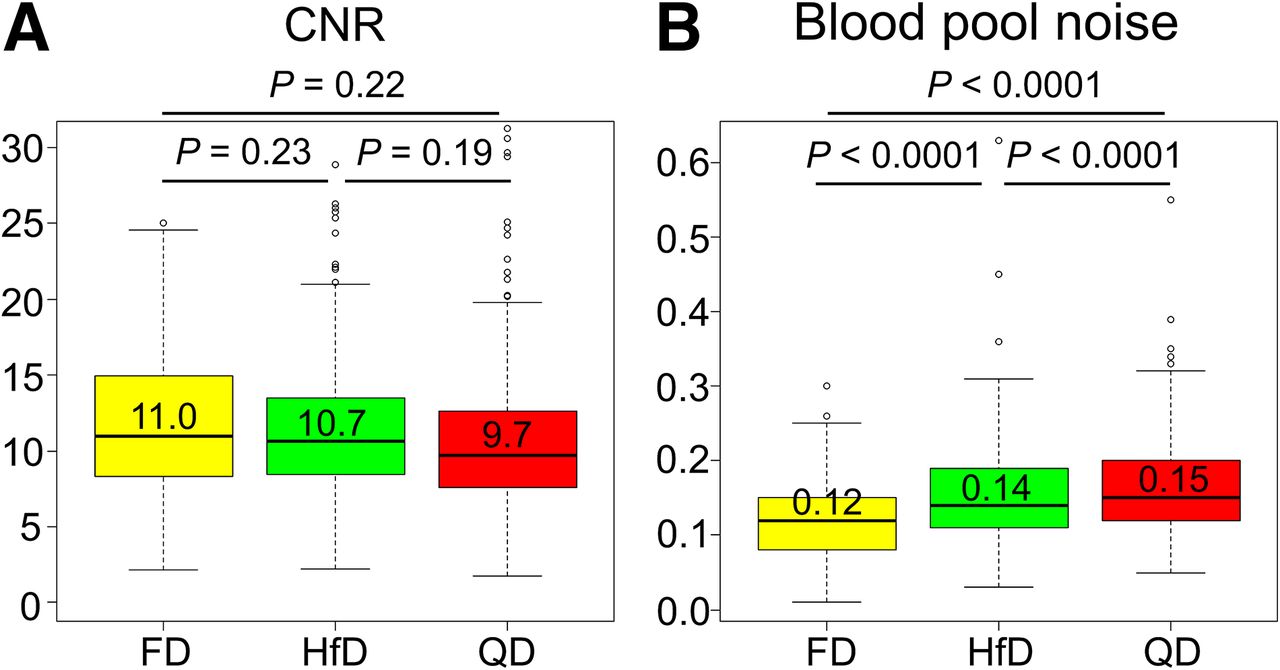
Contrast-to-noise ratio was comparable across the 3 reconstruction protocols (all P > 0.19, Kruskal–Wallis test) (Fig. 4A; Table 3). Analyses on the blood pool revealed significantly increased noise for the dose-reduced reconstructions (both P < 0.0001) (Fig. 4B). Results obtained for the second image series are shown in Supplemental Figure 6. A case example to illustrate image quality across reconstructions is shown in Fig. 5.

Contrast-to-noise ratio and noise in blood pool calculated as coefficient of variation. (A) Similar contrast-to-noise ratios were observed for all 3 reconstruction protocols (Kruskal–Wallis test). (B) Evaluation of blood pool, however, showed significantly increased noise for reconstruction protocols when using HfD and QD data. Figures show pooled results from rest and stress scans. Median values are presented above median line in box plots. CNR = contrast-to-noise ratio.

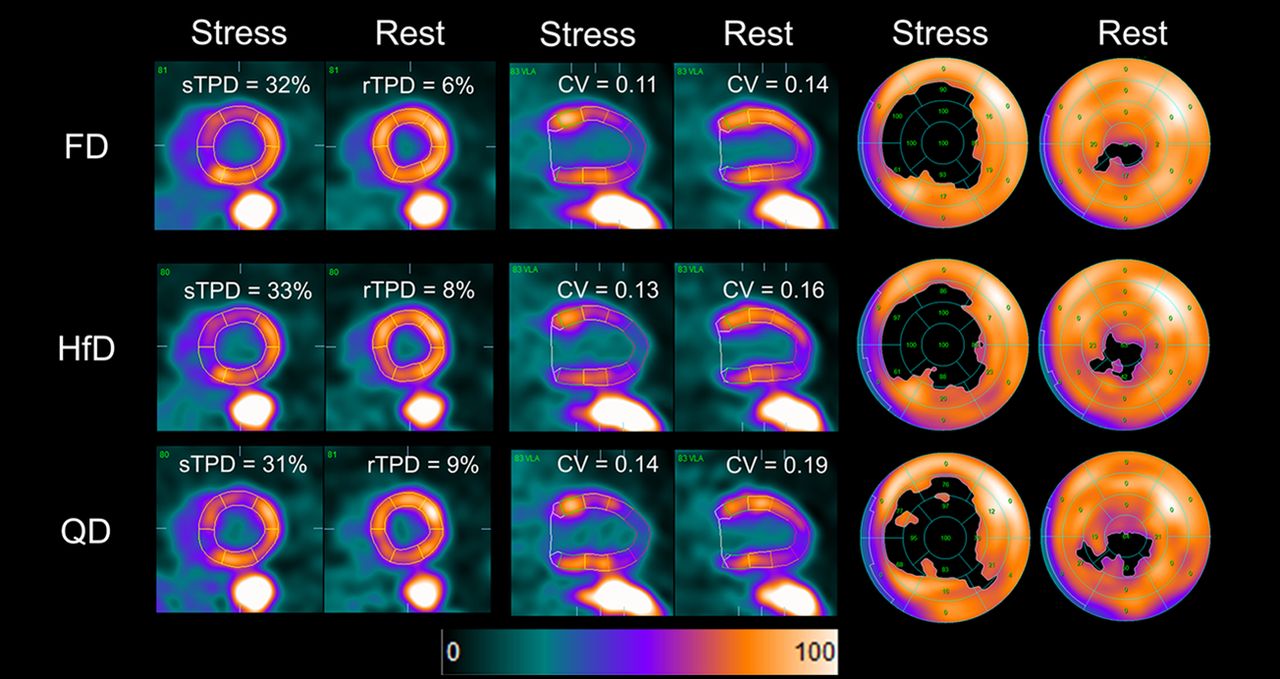
Case example of stress and rest 82Rb MPI with FD, HfD, and QD reconstructions for 70-y-old woman. Patient was injected with 1,110 MBq of 82Rb and weighed 79 kg (BMI, 36.5), corresponding to dose of 14.1 MBq/kg for both rest and stress MPI scans. Representative images from short axis (left 2 columns), vertical long axis (middle 2 columns), and extent perfusion polar map (right 2 columns) are shown for FD, HfD, and QD scans. Similar sTPD and rTPD were reported for all 3 reconstruction protocols, with increased noise in blood pool for dose-reduced reconstructions. CV = coefficient of variation.
Contrast-to-Noise Ratio and Blood Pool Noise Observed for 171 Patients
DISCUSSION
This study evaluated the impact of reducing the injected dose for 82Rb MPI scans using the current guidelines for static quantitative perfusion assessments in 3-dimensional PET systems (1,4). The main finding was that for both sTPD and ITPD, the diagnostic accuracy of MPI for obstructive CAD using an HfD imaging protocol was similar to that using the FD protocol. No dependency between body weight–corrected doses and changes in sTPD and ITPD were observed with reduced-dose reconstructions, and there was no significant change in contrast-to-noise ratio. Therefore, our results suggest that radiation doses could be halved while maintaining diagnostic accuracy for static perfusion imaging.
The main aim of our study was to evaluate the impact of reducing the dose to half and a quarter of the current recommendations for static MPI assessments when using 82Rb (1,4,5). Previous studies have reported significant risks of PET system saturation during first-pass dynamic studies when injecting doses of 1,100–1,500 MBq (30–40 mCi) (6,16), as suggested by both North American and European guidelines (1,4,5). Recommendations to prevent PET system saturation during the first 2 min of the dynamic scans include use of a continuous dose inflow over 30 s (17–19), use of weight-specific doses (20), and use of fixed doses (16). However, use of fixed doses is more feasible in many centers. In a previous study from our center (6), use of an HfD protocol did not affect myocardial blood flow estimates of rest studies repeated in a small group of patients. In the current study, we confirm the validity of the reduced-dose 82Rb PET protocols for the main clinical component of these studies—myocardial perfusion assessment.
Although repetition of the tracer injection at lower doses is necessary when estimating myocardial blood flow and system saturation during the first-pass bolus of 82Rb (6), the dose reductions in this study were obtained retrospectively from the FD list-mode files. Simulating dose reductions from list-mode files is permissible because PET system saturation is not possible when performing static perfusion imaging (image reconstructions starting 2 min after tracer injection) while using current guideline-recommended injection profiles (4,5). During the static MPI reconstructions, the local tracer uptake in the myocardium measured by the PET system will follow the system-specific detection patterns revealed in the noise-equivalent count rate plots. These curves are used mainly to describe the noise-equivalent count rate, yet they also provide insight into how the detection of true and random events changes when the injected activity is reduced (Fig. 1). Common to all PET systems is that the dose-dependent changes in the measured true coincidences can be approximated by a linear relationship until PET system saturation is achieved, whereas the random events develop almost by a squared increase in counts when doubling the dose (10). By correcting the count rates (true and random) accordingly, it is possible to achieve true simulations of the HfD and QD scans.
Similar diagnostic accuracy was observed for the FD and HfD protocols, both for the grouped analyses and for each subgroup of patients (BMI < 30, BMI ≥ 30), with low variability in results, suggesting that a 50% reduction of the injected activity is permissible without affecting the clinical utility.
There was no difference in diagnostic performance of stress and rest TPD between obese and nonobese patients using the reduced dose protocol (Supplemental Fig. 3). These findings are important because 82Rb generators have continuous decay throughout their life cycle, which affects both the injected dose and time spent on dose injection. Furthermore, no BMI-dependent differences were reported for the sTPD and ITPD assessments (Supplemental Figs. 1, 4, and 5). The reliability of the rTPD, sTPD, and ITPD assessments with a lower dose as shown in this study indicates that the changes in the dose profile during delivery for FD scans would not affect quantitative perfusion assessment. Additionally, high accuracies of the automatic segmentation were reported for all reconstruction protocols, with manual adjustments required in 10%–15% of the cases, consistent with previous reports (21). The reduced doses led to increased noise levels, assessed as the coefficient of variation obtained in the blood pool, which should be homogeneous (Figs. 4 and 5). Although there was increased noise in the images, the contrast-to-noise ratio was preserved for the HfD and QD protocols. This suggests that the reduction in the dose would not significantly impact the diagnostic quality of the static perfusion images when reducing the injected dose by 50%. This finding is in concordance with the findings reported in a previous study from our center evaluating the feasibility of using an HfD protocol in the assessment of myocardial blood flow (6). Using the HfD protocol for the myocardial blood flow imaging is beneficial for two reasons, first, the use of an HfD protocol significantly reduces the risks of PET system saturation during the first 2 min of the acquisition. In our previous study, it was reported that datasets with PET system saturation (assessments of the presence of speckle noise, input function shape, and identification of alternations in the sinograms) had false-positive high blood flows when compared with the blood flows observed for studies using an HfD protocol and with scans without observable PET system saturation (6). Second, the use of an HfD protocol also reduces the radiation dose for the patient, which is in concordance with the as-low-as-reasonably-achievable principle. Furthermore, no dependency between injected dose or BMI and the quantitative assessments were observed in this current study. The findings of this and our previous study (6) suggest that the use of an HfD protocol is permissible in the assessment of myocardial blood flow and perfusion defects.
This study has several limitations. First, we relied on simulations rather than acquiring separate FD, HfD, and QD scans. However, acquiring FD, HfD, and QD datasets using the respective injection protocols would not be possible, given the resulting increased radiation exposure for patients. Another limitation of this study was that the impact of the HfD protocol was not tested on electrocardiography-gated data. Further evaluation of the suitability of the low-dose protocols for reporting the ejection fraction with 82Rb imaging with 8- or 16-bin protocols will need to be evaluated. Furthermore, this study was performed on a PET/CT system from a specific vendor. Finally, the contrast and contrast-to-noise ratio measurements obtained in the study might be affected by differences in the rTPD and sTPD assessments within the segmented myocardium, because the areas with perfusion defects were not removed from the analyses.
CONCLUSION
We report that reducing the 82Rb dose by half does not affect the diagnostic accuracy of quantitative myocardial perfusion analysis for PET data obtained on 3-dimensional PET/CT systems. On the basis of these findings, we suggest that dose reductions of 50% could be applied in perfusion 82Rb PET studies.
DISCLOSURE
This study was supported in part by Siemens Medical Systems. Piotr Slomka, Daniel Berman, and Paul Kavanagh receive royalties from Cedars-Sinai. No other potential conflict of interest relevant to this article was reported.
KEY POINTS
QUESTION: How do reductions of 50% and 75% of injected doses of 82Rb affect quantitative assessments of myocardial perfusion?
PERTINENT FINDINGS: In total, 171 patients underwent invasive coronary angiography within 14 ± 27 d of PET MPI for suspected CAD. Dose reductions of 50% and 75% were simulated by removing counts from the acquired PET list data. The diagnostic accuracy of an HfD reconstruction for obstructive CAD was similar to that of the FD reconstruction, whereas the QD reconstruction was associated with reduced diagnostic accuracy.
IMPLICATIONS FOR PATIENT CARE: Reducing the injected radiotracer dose by 50% reduces patient radiation exposure and does not impact the diagnostic accuracy of quantitative assessment of perfusion.
Footnotes
Published online January 8, 2021.
- © 2021 by the Society of Nuclear Medicine and Molecular Imaging.
REFERENCES
- Received for publication June 24, 2020.
- Accepted for publication December 22, 2020.


Jump to section
Related Articles
Cited By...
- No citing articles found.