


Abstract
Brain connectivity has been assessed in several neurodegenerative disorders investigating the mutual correlations between predetermined regions or nodes. Selective breakdown of brain networks during progression from normal aging to Alzheimer disease dementia (AD) has also been observed. Methods: We implemented independent-component analysis of 18F-FDG PET data in 5 groups of subjects with cognitive states ranging from normal aging to AD—including mild cognitive impairment (MCI) not converting or converting to AD—to disclose the spatial distribution of the independent components in each cognitive state and their accuracy in discriminating the groups. Results: We could identify spatially distinct independent components in each group, with generation of local circuits increasing proportionally to the severity of the disease. AD-specific independent components first appeared in the late-MCI stage and could discriminate converting MCI and AD from nonconverting MCI with an accuracy of 83.5%. Progressive disintegration of the intrinsic networks from normal aging to MCI to AD was inversely proportional to the conversion time. Conclusion: Independent-component analysis of 18F-FDG PET data showed a gradual disruption of functional brain connectivity with progression of cognitive decline in AD. This information might be useful as a prognostic aid for individual patients and as a surrogate biomarker in intervention trials.
Neuronal activity involving different brain regions relies on dynamic communication through both short- and long-range networks establishing temporal or spatial connections (1). Connectivity can be investigated by identifying significant signal-intensity correlations between a priori–defined volumes of interest as segmented by brain atlases (2–5) or between regions resulting from statistical preprocessing (e.g., graph analyses in which brain areas are considered as nodes). Application of the latter technique to datasets including subjects ranging from normally aging individuals to patients with mild cognitive impairment (MCI) or Alzheimer disease dementia (AD) has revealed a selective breakdown of intrinsic brain networks during the progression of AD (5,6).
Cognitive impairment does not always progress to overt dementia but sometimes remains stable after years of follow-up or even reverts to a normal state (7). Thus, patients with cognitive impairment constitute an ideal control group for studies on the decline from progressive MCI to AD.
Most phenomena that occur in the real world are mixtures of different, often relatively independent, processes. Typical examples are the sounds in a room in which several people are talking simultaneously (the paradigmatic cocktail party model (8)). Analogously, a distribution of signal intensities across the brain will be a mixture of the activations of a large number of independent neural networks. Under certain conditions, these elementary signals can be recovered by independent-component analysis (ICA), a data-driven technique that blindly separates mixed signals into independent sources without requiring any a priori topographic assumption.
Submitting functional MRI data to ICA helped disclose a strong functional architecture in all stages of aging, from normal cognition to AD (9). The take-over of local systems on long-distance brain connections speaks in favor of a functional segregation of neuronal processes. However, it is still not known whether there is a continuum in the intrinsic network modification associated with AD. In a previous study (10), we reported a continuous loss of order along the disease-severity axis in the metabolic setup of the brain, as assessed using 18F-FDG PET and applying a coarse-grain thermodynamic approach. Here, we examine a possible association between those findings and intrinsic network changes by analyzing the connectivity dynamics.
The aim of the present study was to use 18F-FDG PET to evaluate, first, the spatial distribution of the independent components in subjects ranging from normally aging individuals to AD patients (including MCI converters to AD and MCI nonconverters to AD) and, second, the accuracy of the independent components in discriminating between 5 such groups of subjects with different conditions. Our hypothesis was that the progressive derangement of brain connectivity during the course of the disease is already detectable at the MCI stage and that metabolic patterns identified in MCI patients can help in predicting the speed of conversion to AD.
MATERIALS AND METHODS
Participants
Forty-two cognitively normal elderly subjects, 27 MCI patients who did not convert to AD, 37 MCI patients who converted to AD more than 2 y after the PET scan, 58 MCI patients who converted to AD within 2 y of the PET scan, and 54 patients with AD at the time of the PET scan were included in the study (Table 1). The exclusion criteria for each of these groups were the same as previously described (10). The study was approved by the institutional review board, and all subjects gave written informed consent to undergo 18F-FDG PET in the framework of a long-term observational study.
Demographic Data
MCI Patients
The MCI patients had been referred to our memory clinic for initial diagnostic assessment of a memory complaint. They underwent a complete clinical and neuropsychological diagnostic work-up according to current standards. The baseline evaluation included blood and urine tests, neuroimaging (MRI), and functional neuroimaging (18F-FDG PET). All patients underwent extensive neuropsychological testing, investigating categoric and phonologic verbal fluency, executive functions, visuospatial abilities, attention, and working memory.
Patients were included in the MCI group if they did not have dementia but showed impairment on a memory test, either with (multidomain amnestic MCI) or without (single-domain amnestic MCI) involvement of other cognitive domains. We included only patients who had been followed up by regular visits for at least 5 y or until they developed AD.
AD Patients
The AD patients were those diagnosed with AD at their first work-up at our memory clinic after undergoing the same tests as the MCI patients. The presence of dementia was established by clinical interviews with the patient and caregivers, by questionnaires about their activities of daily living and their instrumental activities of daily living, and by their Clinical Dementia Rating Scale scores. The mini–mental state examination was used to score global cognition. Only patients with a score of at least 19 (mild dementia) attributable to AD according to the criteria of the National Institute on Aging and the Alzheimer’s Association were included in the study.
Cognitively Normal Controls
The control subjects were carefully checked by clinical examination. The same exclusion criteria as for the MCI and AD patients were used, with the exception of cognitive complaints. Similarly, only subjects with a normal score (i.e., >26) on the mini–mental state examination and with a Clinical Dementia Rating score of 0 were considered. The controls underwent both 18F-FDG PET and MRI, as well as the same extended neuropsychological testing as the MCI and AD patients (11).
18F-FDG PET Protocol and Preprocessing
18F-FDG PET images were acquired by a Biograph 16 PET/CT scanner (Siemens). The acquisition lasted 15 min in 3-dimensional mode. The images underwent the preprocessing steps in the stand-alone version of the statistical parametric mapping software (SPM8; Wellcome Department of Cognitive Neurology). Spatial normalization was performed using a customized brain 18F-FDG PET template optimized for dementia patients (12), and the images were then smoothed with an 8-mm isotropic gaussian filter to blur individual variations in gyral anatomy and to increase the signal-to-noise ratio.
Statistical Analysis
Using 1-way ANOVA, we compared the results of the mini–mental state examination, the auditory verbal learning test (immediate total recall and delayed recall), and the trail-making test (parts A and B, assessing verbal memory and executive functions, respectively among the 3 MCI subgroups).
Statistical Parametric Mapping
The brain PET results from MCI nonconverters were compared on a voxel-by-voxel basis with those from MCI patients who later converted to AD using the 2-sample t test of SPM8, implemented in MATLAB (release 2014a; The MathWorks). The threshold of significance was set at a P value of less than 0.05, corrected for multiple comparisons with familywise error option. Age and sex were considered confounding variables.
ICA
ICA is based on the assumption that the observed variables in a mixture (the distribution of voxel intensities in PET investigations) are generated by different, mutually independent, underlying sources. Thus, the deconvolution (demixing) of the observed signal as an explicit summation of independent components reveals the hidden structure of the observed phenomenon. ICA can be applied in the spatial dimension, as in our case, in which the extracted independent components pointed out highly connected networks.
Spatial ICA of the preprocessed 18F-FDG PET images was performed using the GIFT toolbox (http://mialab.mrn.org/software/) as previously described (13). In brief, data from each subject were submitted to principal-component analysis (PCA) followed by estimation of independent spatial components (8). The number of components was set to 20, the intensity in each voxel was converted to a z score, and the images were visualized at a z threshold of greater than 3.3 (P < 0.001), creating binary masks. From the resulting components, those with either pathophysiologic or anatomo-functional meaning were separately selected in each group, and each component was named according to its anatomy, allowing for separate solutions. The remaining independent components were discarded as statistical noise. The number and voxel extent of the independent components were correlated to the variance explained by the first principal component of each group (10).
PCA
In a previous investigation, PCA—separately applied to the same experimental groups—highlighted the presence of a first principal component explaining by far the greater part of the system variance (10) and being regarded as the degree of global order in brain metabolism. Here, we build on the complementarity of ICA and PCA, with the former having a mainly local character (a focus on the enucleation of independent circuits) and the latter a global spectral character.
Support Vector Machine (SVM) Analysis
The independent-component masks of the AD group, considered to be the most appropriate reference for the aim of the study, were segmented and applied to each of the 218 subjects to compare signal intensity among groups. The 18F-FDG uptake in each of the volumes of interest pinpointed by independent-component masks was assessed in all 5 groups using an in-house–created MATLAB-based script that automatically processed mean 18F-FDG uptake intensities (14). Mean uptake values for the volumes of interest associated with the selected independent components in normally aging individuals were analyzed by repeated-measures regression to correct the values in each subject for the effect of age and sex. The corrected values then underwent SVM analysis to discriminate, first, normally aging individuals from all patients with AD pathology (thus also including MCI converters); second, MCI nonconverters from all patients with AD pathology; and third, MCI nonconverters from normally aging individuals. In the first and second comparisons, we considered MCI converters as being affected by AD pathology, in line with the concept that AD pathology is present in the predementia stages (15). Stepwise selection was applied to search for the best sets of components in an SVM model. The performance of each model was evaluated by computing the receiver-operating-characteristic curve and the relevant area under the curve, as well as the sensitivity, specificity, and accuracy associated with the best point on the curve, along with their confidence intervals. All these parameters were evaluated after leave-one-out cross-validation, where each subject was classified by a model fitted to all remaining subjects. Each model was also applied to the groups excluded from the training set. For example, the first model, based on the contrast between normal aging and all AD, was then applied to nonconverting MCI. SVM, applied by radial basis function kernel, and following receiver-operating-characteristic curve analysis and accuracy measurements, was performed using the Statistics Toolbox of MATLAB release 2015b.
RESULTS
Demographic data are reported in Table 1.
The results of the mini–mental state examination (P < 0.05); the Rey auditory verbal learning test, immediate total recall (P < 0.005); and the Rey auditory verbal learning test, delayed recall (P < 0.001), showed significant changes among the 3 MCI groups, with a progressive decline from MCI nonconverters to within-2-y MCI converters. On the other hand, no significant changes were found for either part A or part B of the trail-making test, although there was a trend toward higher (worse) scores for MCI converters.
Statistical Parametric Mapping
Statistical parametric mapping confirmed in all comparisons the well-known differences between normal aging and MCI or AD (unpublished results). When MCI nonconverters were compared with MCI converters, highly significant hypometabolism (familywise error–corrected P < 0.001 at both voxel and cluster levels) was found bilaterally in the latter group both in the temporoparietal cortex and in the posterior cingulate cortex (Fig. 1).

Topographic representation of clusters in which 18F-FDG uptake was significantly lower in MCI converters (n = 95) than in MCI nonconverters (n = 27) (threshold P < 0.05, corrected for multiple comparisons with familywise error option). Clusters are superimposed on Montreal Neurologic Institute template in coronal (left), sagittal (middle), and transversal (right) views.
ICA
Because none of the negative independent components had any pathophysiologic significance, we selected and discussed only positive independent components, displayed by group in Supplemental Figures 1–5 (supplemental materials are available at http://jnm.snmjournals.org).
Table 2 reports the independent components obtained when ICA was applied to the 5 groups.
Independent Components Identified as Pathophysiologically Significant in Each Group
Briefly, the number of independent components progressively increased from 6 in control subjects to 9 in both MCI nonconverters and after-2-y MCI converters, 13 in within-2-y MCI converters, and 14 in AD patients. Also, the number of voxels composing the independent components progressively increased from control subjects (17,491) to AD patients (51,740). We highlight here only the independent components with pathophysiologic significance, and the brain regions included in them (Table 2).
PCA
The decrease in global order (revealed by λ1, the first principal component [index of global connectivity]) scaled well with the onset of local neural circuits (revealed by independent components). There was a highly significant inverse correlation between the percentage of variance explained by λ1 and the extent of the independent components in each group (r = 0.975; P < 0.005) and between λ1 and their number (r = 0.961; P < 0.009) (Fig. 2A). When these were compared with the severity of cognitive impairment, the correlation was positive (r = 0.97; P < 0.007), whereas the mean extent of the independent components in each group showed a constant increase toward AD, with the exception of MCI nonconverters, whose independent components were relatively small (Fig. 2B).
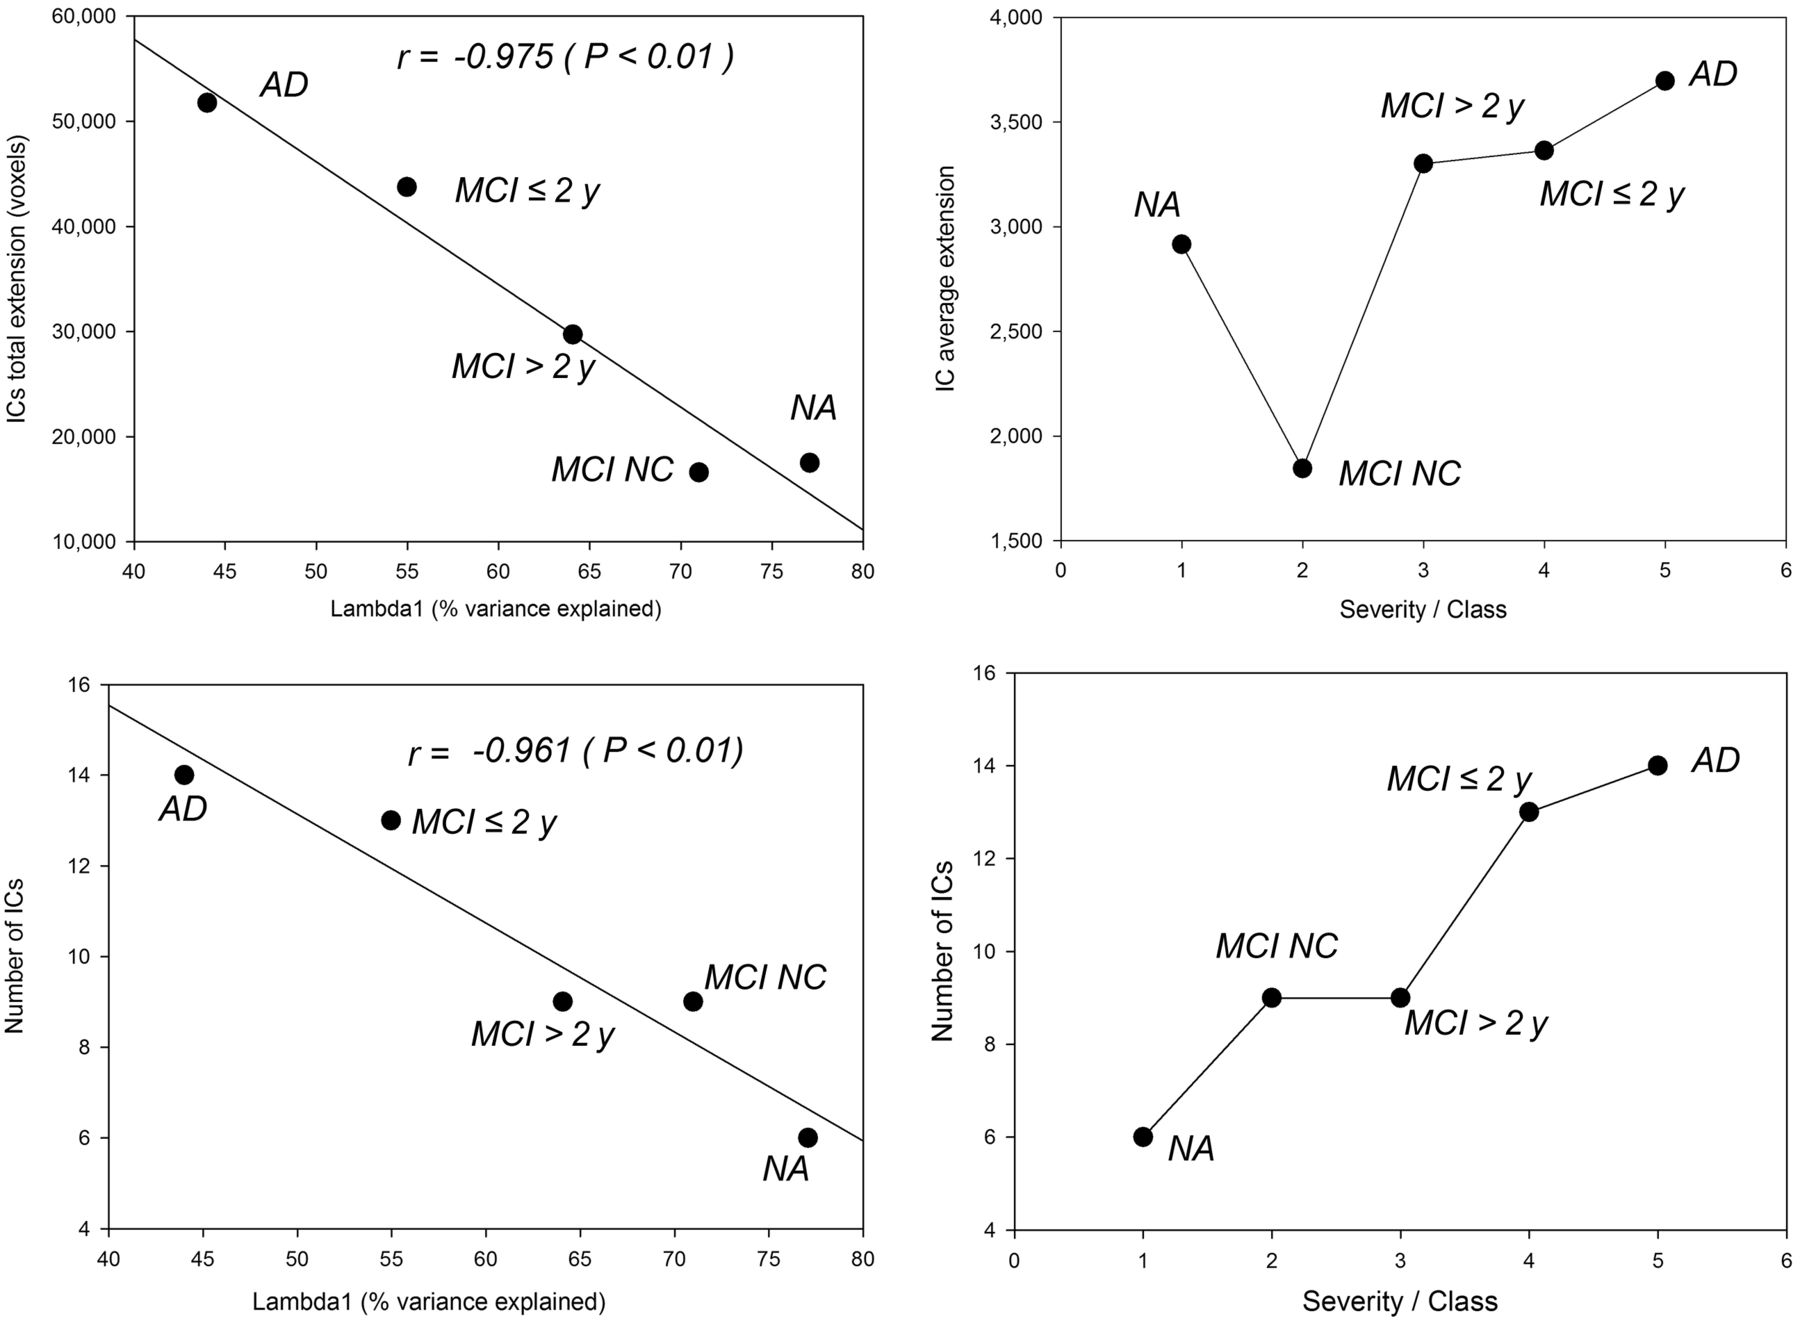
(Left) For each severity class, negative correlations between percentage of variance explained by first principal component (λ1) and generation of local circuits expressed as total independent-component extent in voxels (top) and number of independent components (bottom). (Right) Relations between disease severity class and average independent-component extent (top) and number of independent components (bottom). MCI > 2 y = MCI converters after more than 2 y; IC = independent component; MCI ≤ 2 y = MCI converters within 2 y; NA = normally aging individuals; MCI NC = MCI nonconverters.
SVM Analysis
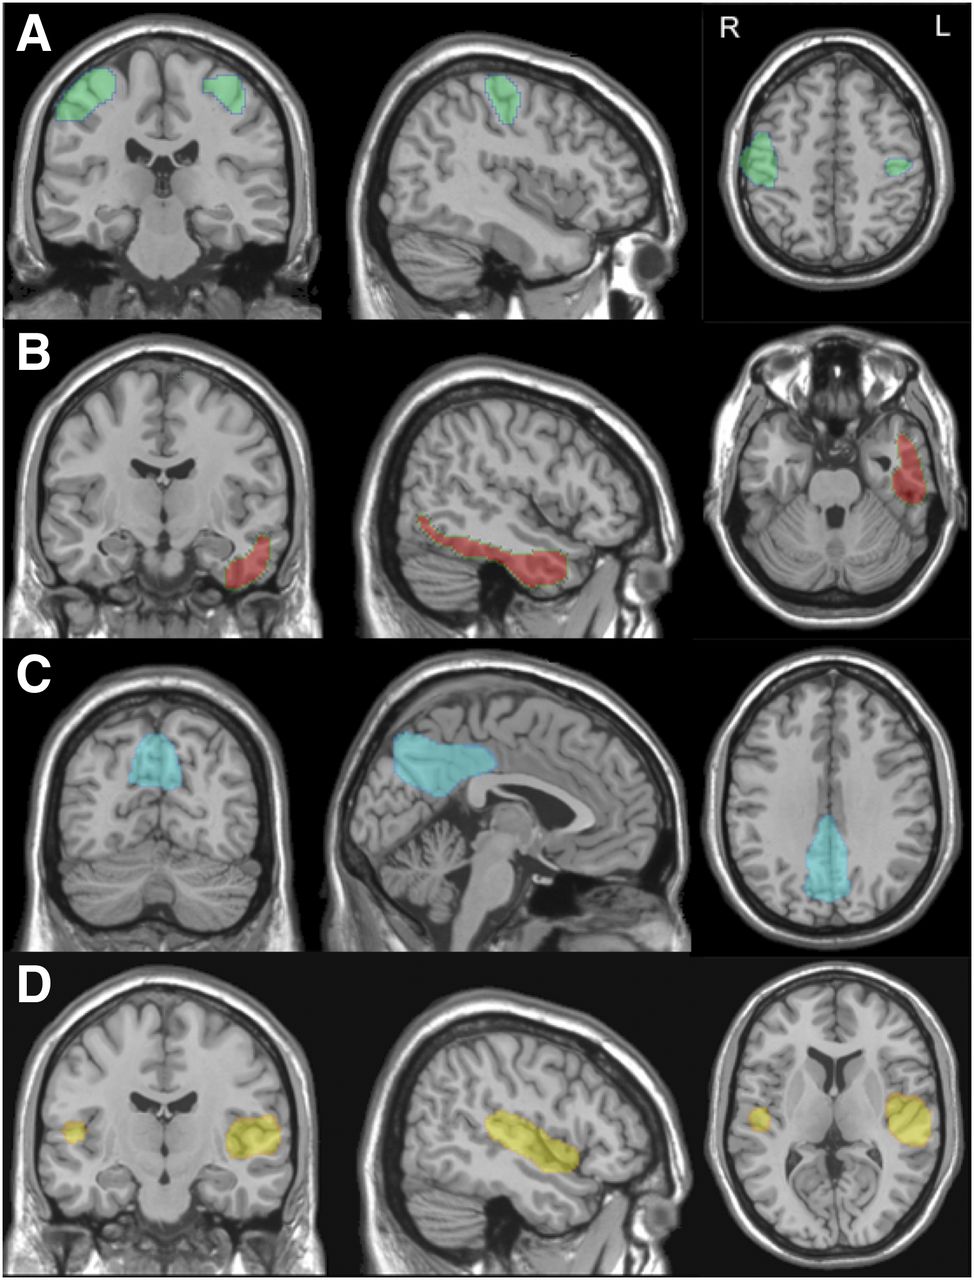
The 14 volumes of interest drawn from AD-related ICA masks were the input for SVM analysis. SVM analysis highlighted the left temporal cortex as the most accurate independent component in distinguishing normal aging and nonconverting MCI from all AD (Table 3). The accuracy of the discrimination was highest with 4 independent components, then remaining stable or decreasing (because of overfitting). A set of 4 regions, namely the right and left sensorimotor cortices, right and left precuneus/posterior cingulate cortices, right and left sylvian temporal cortices, and left temporal cortex (Fig. 3), yielded the highest accuracy both when the comparison was between normal aging and all AD and when the comparison was between nonconverting MCI and all AD. Table 3 shows the percentage distribution of the subjects in each of the 5 groups, according to the binary classification of each model. In each SVM model, the percentage of subjects in the AD class (thus also including MCI converters) increased with illness severity. The receiver-operating-characteristic curves showed a high ability to discriminate controls from all AD patients (area under the curve, 0.931) and to discriminate MCI nonconverters from all AD patients (area under the curve, 0.894) but a rather poor ability to discriminate MCI nonconverters from controls (area under the curve, 0.65) (Fig. 4).
Discriminant Models

Topographic representations of independent components identifying sensorimotor cortex (A), left temporal cortex (B), posterior cingulate cortex/precuneus (C), and sylvian temporal cortex (D) on brain surfaces. Regions obtained from ICA have been superimposed on Montreal Neurologic Institute template in coronal (left), sagittal (middle), and transversal (right) views.

Receiver-operating-characteristic curves obtained by SVM classifier as applied to 3 different datasets.
DISCUSSION
ICA identified spatially distinct clusters of voxels with meaningful pathophysiologic value in each group, allowing us to uncover the spatial distribution of the independent components in each cognitive state and to assess the accuracy of ICA in discriminating between groups. The hypothesis of a progressive disintegration of brain connectivity during the course of the disease was proven in terms of the generation of new local circuits that progressively replaced the brain-as-a-whole mean field detected in a previous study (10).
With increasing disease severity, the shared portion of brain metabolism (λ1) loses relative importance with respect to local distinct neural circuits, which increase in both number and extent. Degradation of functional connectivity as AD progresses is a loss of integration: the brain becomes increasingly segmented into independent metabolic areas.
Disintegration of the intrinsic networks that characterize normal aging was progressively more severe with the transition from nonconverting MCI to AD, with the extent of the independent components being inversely proportional to time from conversion. Neurodegenerative processes affect modular networks rather than isolated regions (16). Long-distance interregional metabolic correlations are impaired by the anatomo-functional progression of neuronal and white matter fiber degeneration (17), causing local compensatory networks to take over and increasing the anatomic and functional segregation of brain processes.
The progressive disintegration of the giant component that accounts for the main whole-brain connectivity present in normal aging was disclosed by ICA, which identified in all groups a specific set of 18F-FDG PET–derived components whose pattern agreed with the metabolic decay from normal aging to MCI to AD.
Independent components, including the primary visual cortex and cerebellum, are present in all groups. Therefore, they are not implicated in the functional pattern of cognitive decline. This confirms well-known findings and supports the suitability of choosing the cerebellum as a normalizing factor in radionuclide imaging of brain function in AD (18).
The medial frontal gyrus and dorsolateral frontal cortex (representing the anterior portion of the default-mode network), as well as the supplementary motor cortex, are incorporated in independent components peculiar to normal aging. The anterior portion of the default-mode network is thus disintegrated in all patient groups, including MCI nonconverters. The disappearance of the anterior default-mode network in MCI nonconverters is intriguing and may point to the involvement of anterior frontal regions in a variety of conditions—ranging from late-life depression to cerebrovascular disease—that affect this network. However, Di et al. (19) reported that the absence of the anterior part of the default-mode network in PET investigations but not in functional MRI investigations was due to differences in the temporal scales of PET and MRI.
On the other hand, among the main components of the posterior portion of the default-mode network, the posterior cingulate cortex and the inferior parietal lobule belong to the same independent component in normal aging and nonconverting MCI. This independent component is disintegrated in MCI converters and in AD patients, in whom the posterior cingulate cortex stands as an independent component alone or in association with the precuneus. This agrees with the disappearance of the default-mode network in AD and with the knowledge that metabolic changes in the posterior cingulate cortex and precuneus are indeed markers of AD pathology (20).
In line with this interpretation, the dorsolateral frontal cortex, either alone or in association with the superior parietal lobule or temporal cortex, is embedded in independent components found in all MCI patients, either converting or not. Thus, the dorsolateral frontal cortex may be considered a correlate of cognitive impairment not specifically linked to AD pathology.
Surprisingly, the temporal cortex close to the sylvian fissure also was embedded in an independent component in all patients with cognitive deficit, including MCI nonconverters, and hence could be considered a correlate of memory deficit independent of AD pathology, possibly resulting from an aspecific temporal lobe atrophy shared by different conditions (21).
The temporal cortex and inferior parietal lobule in the right hemisphere are aggregated in an independent component in all groups progressing to AD and in AD itself and thus are more related to the specific AD signature, independent of the severity of the disease.
Three independent components characterize the late-MCI stage, namely those including the lateral occipital cortex bilaterally, the left superior parietal cortex, the temporal cortices, the precuneus, and the dorsolateral frontal cortex. The spreading of functional deficit to these association cortices follows the progressive-disconnection hypothesis as proposed by the classic model of Braak and Braak (22). Furthermore, the posterior cingulate cortex (either with or without the precuneus), ventrolateral frontal cortex, superior parietal lobe, and medial temporal lobe are the independent components specific to the late stage of the disease (MCI converters within 2 y and AD).
The final metabolic signature of the definitive conversion to AD are two independent components including the left temporal cortex. However, the full-AD stage includes several independent components: right and left precuneus/posterior cingulate cortex, medial temporal lobe, ventrolateral frontal cortex, inferior parietal lobule, temporal sylvian cortex, and right temporal and occipital lateral cortex.
Beyond the pathophysiologic significance of these independent components in AD, two further observations have to be made. The first is that this study can be considered prospective because all 3 groups of MCI patients were investigated by 18F-FDG PET at a time when the neuropsychological assessments showed similar levels of cognitive deficit (baseline), with an expected decline in memory performance from MCI nonconversion to MCI conversion within 2 y. Thus, the metabolic pattern at baseline was predictive of conversion to AD and was associated with the conversion time. The inclusion of both converting and nonconverting MCI patients adds clinical value to the analysis since these intermediate classes are the most relevant targets for a proper and timely diagnosis and for subsequent management. In the present study, the voxel-based analysis found a highly significant metabolic difference in the posterior cingulate and temporal and parietal cortices between these two groups (Fig. 1). Furthermore, this difference was confirmed by SVM analysis, which found that analogous regions separated nonconverting MCI from all AD with an accuracy of 83.5% (Table 3). The independent component aggregating the posterior cingulate cortex and the inferior parietal lobule, representing the posterior default-mode network, is considered to be a hub of functional connectivity sensitive to synaptic disconnection (23) and was found in an MRI ICA study to best predict conversion from stable MCI to progressing MCI (24).
Another observation that has to be made is that 18F-FDG PET uptake in the independent components of AD patients showed fairly good power in discriminating normal aging and nonconverting MCI from AD. This observation confirms the utility of such data-driven methodology to uncover correlations that have pathophysiologic meaning (Table 3). Several studies have implemented automated image-based classification methods to differentiate AD and MCI patients from controls and have found such methods to have a statistical accuracy of 90% in discriminating AD patients from controls (25–27). When MCI patients who later converted to AD were investigated by unimodal biomarkers, the reported ability to discriminate from controls ranged from 80% (28) to 91% (29). In the present study, the independent components derived by the AD dataset showed an accuracy of 90% in discriminating controls from the entire cohort with AD pathology. Moreover, the weak discriminatory power (area under the curve, 0.65) between controls and MCI nonconverters indicates a strong similarity between these two groups, providing functional support for the lack of conversion observed clinically in the latter group.
When the analyses were modeled on the two extreme classes (normal aging and AD), the patients of the intermediate groups were progressively assigned to the AD class according to disease severity. The same held true when the analyses were modeled on nonconverting MCI and AD (Table 3), confirming the reliability of the present approach.
Our results are consistent with an MRI study performed by Pereira et al. (30) that found in two large, multicenter cohorts a progressive degradation in the connectivity of brain functional networks in patient groups having the same characteristics as in our study, including MCI converters followed up for 1 and 3 y. The most striking similarity with our study was the finding of a progressive increase in modularity with severity of the disease, suggesting a degradation of whole-brain networks into segregated components. This consistency is even more remarkable if we consider that Pereira et al. used a different data analysis strategy (graph analysis) and, more important, a different biologic observable (MRI).
Some of the independent components found in the present study could be superimposed with those found by Laforce et al. (31), who performed one of the few investigations implementing ICA in 18F-FDG PET. In that study, independent components including the frontotemporal cortex, right and left occipitoparietal cortex, posterior cingulate–precuneus–superior parietal cortex, and right and left cerebellum were identified in 54 AD patients. In contrast, only one study attempting to use independent components to distinguish between controls and AD patients (who had been recruited within the Alzheimer Disease Neuroimaging Initiative) could discriminate the two groups with an accuracy of 91% (32).
Unlike multicenter studies, the diagnostic procedures in this investigation were uniform since they were performed by the same clinical group. Additionally, all 18F-FDG PET scans were performed using the same camera, minimizing the likelihood that inhomogeneous subject samples and camera acquisitions could have increased the variability of the data or reduced the robustness of the results. Another strength of this study was the long follow-up time (minimum, 5 y) available for MCI nonconverters, making it unlikely that our group included any late converters.
The progressive increase in the number of independent components with disease severity is the functional consequence of the loss of relevance of the brain-as-a-whole component that we observed in our previous work (10). The degradation of the average correlation field, encompassing the entire brain, resulted in creation of local (and largely autonomous) networks. The progressive loss of connectivity of brain metabolism caused by AD can thus be interpreted not as a loss of local correlation inside a functional network but as a loss of coordination among networks themselves. Furthermore, in neurodegenerative disease, ICA-derived patterns not only can be of high diagnostic utility but also can give mechanistic insight into the etiology of the various disorders (13).
From a methodologic point of view, it is worth noting that the present results were achieved thanks to the complementary properties of PCA and ICA. PCA emphasizes the correlation between different variables (brain regions, bins of a spectrum) in time or space. A latent physical process is considered a global-order parameter (in physical terms, a force) imposing a correlation on otherwise independent pieces of information. The contemporaneous presence of independent forces shaping the observed system allows us to consider each variable as a weighted sum of the same hidden-order parameters (principal components) acting on the different parts of the system. For ICA, the signature of an elemental signal is its multimodality. For PCA, the strength of each elemental signal is the degree of correlation it imposes on the whole system. This difference makes ICA dissect the system into separate local correlation circuits (networks), whereas PCA tries to recollect the complexity of the system into the minimum number of orthogonal components acting on all the elements (even though with different strengths). This implies that although ICA is, by definition, masked to global mean field effects (size components) shared by the entire system, PCA is by far less sensitive in catching the presence of local networks. Here, we have shown the added value of comparing the ICA and PCA pictures to disclose the connectivity dynamics of brain metabolism.
CONCLUSION
18F-FDG PET is a robust tool for predicting the long-term fate of patients presenting with amnestic MCI, including whether they will eventually convert to AD. As such, it is a valuable tool not only for diagnosis but also for prognosis. ICA and PCA were highly accurate in discriminating among groups, documented the progressive disintegration of connectivity networks from a healthy brain to AD, and might be proposed as a surrogate biomarker with predictive value for interventional trials.
DISCLOSURE
No potential conflict of interest relevant to this article was reported.
Acknowledgments
We thank Prof. Sharon Stone-Elander for helping with English editing.
Footnotes
Published online Mar. 9, 2017.
- © 2017 by the Society of Nuclear Medicine and Molecular Imaging.
REFERENCES
- Received for publication September 27, 2016.
- Accepted for publication December 1, 2016.


Jump to section
Related Articles
Cited By...
- No citing articles found.