


Abstract
In recent years, different metal artifact reduction methods have been developed for CT. These methods have only recently been introduced for PET/CT even though they could be beneficial for interpretation, segmentation, and quantification of the PET/CT images. In this study, phantom and patient scans were analyzed visually and quantitatively to measure the effect on PET images of iterative metal artifact reduction (iMAR) of CT data. Methods: The phantom consisted of 2 types of hip prostheses in a solution of 18F-FDG and water. 18F-FDG PET/CT scans of 14 patients with metal implants (either dental implants, hip prostheses, shoulder prostheses, or pedicle screws) and 68Ga-labeled prostate-specific membrane antigen (68Ga-PSMA) PET/CT scans of 7 patients with hip prostheses were scored by 2 experienced nuclear medicine physicians to analyze clinical relevance. For all patients, a lesion was located in the field of view of the metal implant. Phantom and patients were scanned in a PET/CT scanner. The standard low-dose CT scans were processed with the iMAR algorithm. The PET data were reconstructed using attenuation correction provided by both standard CT and iMAR-processed CT. Results: For the phantom scans, cold artifacts were visible on the PET image. There was a 30% deficit in 18F-FDG concentration, which was restored by iMAR processing, indicating that metal artifacts on CT images induce quantification errors in PET data. The iMAR algorithm was useful for most patients. When iMAR was used, the confidence in interpretation increased or stayed the same, with an average improvement of 28% ± 20% (scored on a scale of 0%–100% confidence). The SUV increase or decrease depended on the type of metal artifact. The mean difference in absolute values of SUVmean of the lesions was 3.5% ± 3.3%. Conclusion: The iMAR algorithm increases the confidence of the interpretation of the PET/CT scan and influences the SUV. The added value of iMAR depends on the indication for the PET/CT scan, location and size/type of the prosthesis, and location and extent of the disease.
Metal implants can significantly degrade the quality of CT images (1,2). Artifacts are visible on the images because of beam hardening, Compton scattering, and noise (1,3). This is especially of importance when the region of interest (ROI) is located near the implant, and the artifacts affect the reconstructed distribution of Hounsfield units (HUs) (4). CT images are used to derive an attenuation correction map for the PET reconstruction, which means that CT influences the PET image in combined PET/CT imaging (2,3,5–9). If the ROI is located near the implant, the metal not only distorts the CT image but also influences the quantification of radiotracer uptake and can reduce the quality of the interpretation of the scan (2,10). In regard to 18F-FDG PET/CT, dark and bright streak artifacts can cause under- and overestimation of 18F-FDG activity concentration around the prosthesis (2,3,5–8). This not only can have implications for detection and staging of the disease, because metal artifacts can cause difficulty with the interpretation of small lesions located near the implant (2,3,8), but also can influence the quantitative accuracy of therapy response monitoring (2,3) and PET-based radiotherapy planning (3). Dental implants (2,9), in particular, may impede diagnosis and therapy planning in head and neck cancer, and with regard to prostate cancer, detection of metastases using 68Ga-prostate-specific membrane antigen (68Ga-PSMA) can be hampered by the presence of 1 or 2 hip prostheses.
In recent years, different metal artifact reduction (MAR) methods have been developed for CT. The main 2 classes are projection completion–based methods, where projections through metal are considered as missing data, and statistically based iterative methods, where (iterative) filtering techniques are deployed (4,5,11). Nowadays application of metal artifact reduction in stand-alone CT is common practice; however, the use of metal artifact reduction of CT for attenuation correction in combined PET/CT is still emerging. Recently, an iterative MAR (iMAR) tool was introduced for combined PET/CT systems. The tool suppresses streak artifacts by decreasing the HUs in areas in which values have been overestimated and by increasing HUs in areas of underestimation (10). This method combines both classes, projection completion and iterative filtering, resulting in a more accurate SUV for the PET reconstructions (10). To our knowledge, the article of Schabel et al. is the only other study describing this algorithm in combined PET/CT imaging (10). In their research, a phantom was scanned on both a CT scanner (with iMAR capabilities) and a PET/CT scanner. These authors analyzed the iMAR algorithm in combination with dual-energy–based strategies and showed that the iMAR tool is a promising approach to improve image quality and PET quantification (10). However, their study did not include patient scans.
The aim of the present study was to analyze the effect of CT metal artifact reduction on PET scans during combined PET/CT imaging in both phantom PET/CT data and patient scans. The effect on PET/CT interpretation by the nuclear medicine physicians and the effect of iMAR on SUV were evaluated for patients with different types of metal implants.
MATERIALS AND METHODS
Phantom Scan
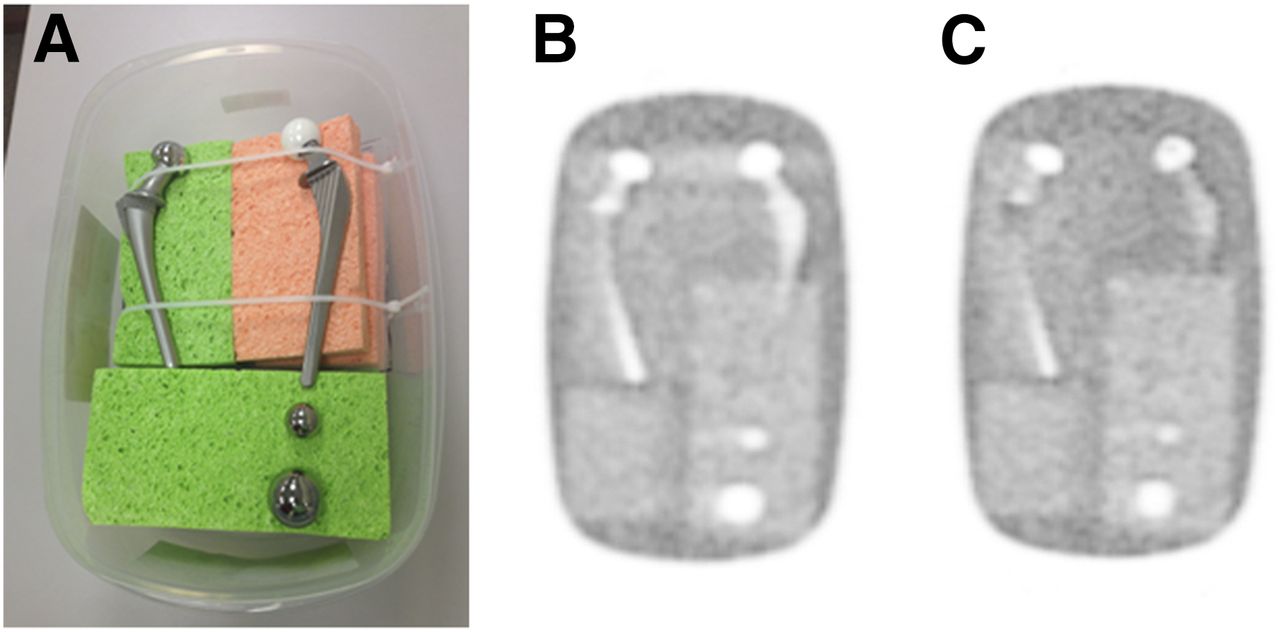
The phantom, depicted in Figure 1A, consisted of 2 types of hip prostheses (cobalt steel and Ti-Al-V with ceramic head) and 2 solid steel balls (2.5- and 3.8-cm diameter) in a solution of 18F-FDG and water in a 9-L container with sponges to position the prostheses and balls. Background radiotracer concentration was approximately 3.2 kBq/mL, similar to values seen in patient scans. The phantom was scanned in a Biograph 40 mCT PET/CT scanner (Siemens Healthcare). The phantom was in the same position on the patient bed in the CT and PET measurements; however, to investigate the effect of motion on the iMAR algorithm an additional phantom scan was obtained for which a second CT scan was acquired after the phantom was translated 3 mm laterally in the region of the prosthetic femoral heads. We reconstructed 1 PET bed position using the misaligned CT, with a 2-mm voxel size (400 × 400 matrix size) and no postreconstruction filter to make the image as sharp as possible and artifacts as plainly visible as possible.

(A) Phantom consisting of 2 types of hip prostheses in solution of 18F-FDG and water: a cobalt steel hip prosthesis and a Ti-Al-V hip prosthesis with ceramic head. Furthermore, phantom included 2 solid steel balls (2.5 and 3.8 cm in diameter). Phantom was scanned in mCT PET/CT scanner. Cold artifact caused by metal is present in standard PET reconstruction (B), whereas on iMAR PET reconstruction (C) these artifacts were not visible.
Patient Scans
PET/CT images of 21 patients with metal implants in the field of view of clinical interest were included in the study. The institutional review board of the Radboud University Medical Center approved this retrospective study, and the requirement to obtain informed consent was waived.
In 14 patients, 18F-FDG PET/CT scanning and in 7 patients 68Ga-PSMA PET/CT scanning were performed. The administered 18F-FDG activity depended on the patient’s weight, resulting in an average and SD of 164 ± 132 MBq with a mean incubation time (and SD) of 61 ± 5 min. For 68Ga-PSMA-HBED-CC, the administered activity also depended on the patient’s weight, resulting in 135 ± 26 MBq using an incubation time of 66 ± 17 min. Patients were scanned in a Biograph 40 mCT PET/CT scanner (Siemens Healthcare) with extended field of view (TrueV). This scanner has been accredited by the European Association of Nuclear Medicine Research Ltd. (12). Included in this study were patients with one or more metal implants with (a strong suggestion of) lesions near the implant, located in the area of the metal artifacts, scanned between January 2015 and October 2016, and consecutive patients with (the strong suggestion of) 68Ga-PSMA–avid lesions near the implant, located in the area of the metal artifacts. The indication for the PET/CT scan differed per patient: patients were scanned for diagnosis of disease, staging, radiotherapy planning, or response monitoring. Patient characteristics are summarized in Table 1.
Summary of Patient Characteristics
CT Acquisition and Reconstruction
The low-dose CT scan was acquired for attenuation correction and anatomic reference. The x-ray tube voltage was chosen using Care kV (Siemens Healthcare), with a reference value of 120 kV. The tube current was modulated using Care Dose4D (Siemens Healthcare), with a reference current–time–product of 50 mAs per rotation. The CT data were acquired with a 0.5 s rotation time and 16 × 1.2 mm collimation.
CT projection data were processed without and with iMAR. In the first case, we used kernels that we have used for several years in whole-body PET/CT. In the second case, we used the iMAR algorithm (Siemens AG). This method, which has not yet been fully described in the peer-reviewed scientific literature, is based on a sinogram metal in-painting approach for which the original sinogram values behind the metal are replaced. It consists of several steps. The first step is the so-called normalized MAR method described by Meyer et al. (13). In this step an initial prior image is estimated that consists of water and bone, posing a simplified representation of the patient anatomy without the metal artifacts. Artificial raw data are generated from this prior image and used to replace the original metal artifacts–affected raw data behind the metal. Because the metal artifacts are mainly long range, low-frequency artifacts (e.g., dark streaks) can be identified and the high frequency structural information around the metal can be used from the original image to restore correct anatomic information in the MAR image. This is the second step of the iMAR algorithm and is called the frequency-split technique (14). The resulting MAR-corrected image can be used again to estimate a more accurate prior image so that the first 2 steps can be performed iteratively (up to 5 loops depending on the chosen preset). In addition to this aggressive sinogram in-painting approach (which is effective for strong metal artifacts due to photon starvation), the iMAR algorithm also incorporates a method that corrects the beam-hardening effects for metal artifacts originating from smaller pieces of metal. The beam-hardening–corrected sinogram values are adaptively combined with the in-painted values depending on the metal attenuation strength. To guarantee the best results for different types of metal implants, distinct parameter configurations are offered to the user (so-called presets; neuro coils; dental fillings; spine, shoulder, hip, or extremity implants; pacemaker or thoracic coils) to facilitate the different iMAR-correction components. In Supplemental Figure 1 (supplemental materials are available at http://jnm.snmjournals.org), a flowchart of the different steps is shown.
The HU values are converted to PET attenuation coefficients (μ-maps) using the standard procedure described by Carney et al. (15). Because streak artifacts are decreased in soft tissue and bone, an improved PET μ-map is expected in regions close to metal. In regions not affected by metal artifact, CT images and PET μ-maps are quantitatively identical to the ones not based on iMAR. The effect of the iMAR algorithm on CT images is shown for 3 patients with different types of implants in Supplemental Figure 2. Two CT reconstructions were made for each patient, 1 without and 1 with the iMAR tool.
CT scans were reconstructed using a 5-mm slice thickness for the 18F-FDG images. The CT images of the 86GA-PSMA scan were reconstructed with a 3-mm slice thickness, to conform to clinical protocol.
PET Acquisition and Reconstruction
The duration of the acquisition of the 18F-FDG PET scans depended on the protocol. In the whole-body protocol (head to feet), patients were scanned with 3 min per bed position, whereas in the standard protocol (head to hip) they were scanned with 4 min per bed position. The 68Ga-PSMA patients were scanned with 4 min per bed position for the bed positions covering the pelvis; other bed positions were scanned for 3 min. Standard clinical reconstruction parameters were used for 2 PET images reconstructed with the standard CT and iMAR CT, using a 3-dimensional ordered-subset expectation maximization algorithm with a spatially varying point-spread function incorporating time-of-flight (TOF) information (UltraHD PET); 3 iterations and 21 subsets; and a slice width that was matched with the CT. A 3-dimensional gaussian filter kernel with a full width at half maximum of 3.0 mm was used as postreconstruction filtering, and a transaxial matrix size of 200 × 200 was used (4 × 4 mm2 pixel size). A third non–attenuation-corrected PET reconstruction was made with similar reconstruction parameters, except for the 3-dimensional ordered-subset expectation maximization algorithm without spatially varying point-spread function and TOF (3 iterations and 24 subsets).
Image Analysis
For the image analysis, the 2 types of CT and 3 types of PET reconstructions were used. The PET/CT images were visually scored by 2 experienced nuclear medicine physicians and were also quantitatively analyzed. The physicians scored the standard, iMAR, and non–attenuation-corrected PET/CT images by answering several questions (Table 2).
Results of Scoring of PET/CT Images by Nuclear Medicine Physicians (Reader 1/Reader 2)
The quantitative analyses consisted of measurements on both CT and PET images. For each patient scan, 6 circular ROIs were placed with a diameter of 15 mm. Two ROIs were drawn in a region in which dark streaks were visible on CT (underestimated HU), 2 in which light streaks were present (overestimated HU), and 2 on a soft-tissue location in which no metal artifact was present (background HU). The ROIs on CT and PET were matched for each patient. In addition to the SUVmean of these 6 ROIs, the SUVmean of the lesions located near the implant was also calculated. The spheric ROIs had diameters between 15 and 40 mm. The type of metal artifact differed for these lesions, and to illustrate the effect of the iMAR algorithm the absolute difference in SUVmean is given for these measurements. The differences are displayed graphically as Bland–Altman plots.
Statistical Analysis
Not all the paired groups were normally distributed, and statistical analysis of the ROI measurements was performed with the Wilcoxon signed-rank test. The interrater agreement between the 2 physicians was not measured with the Cohen’s κ-coefficient because of the dichotomous nature of the questions; however, the fraction of agreement is given. Statistical analysis was performed using SPSS Statistics 22 (IBM). Statistical significance was defined for a P value less than 0.05.
RESULTS
Coronal PET sections from the phantom with and without iMAR are shown in Figures 1B and 1C. The section included the region of greatest attenuation between the 2 prosthetic femoral heads, in which a severe metal artifact was anticipated, but only partly included the prostheses’ stems and the region between them, in which a lesser artifact was anticipated. Cold artifacts, where reconstructed 18F-FDG concentrations were lower than expected, were seen clearly, indicating that metal artifacts on the CT image influenced quantification of PET data. Figure 1B illustrates an artifact with up to 30% deficit in 18F-FDG concentration, whereas Figure 1C indicates that the deficit was removed by iMAR processing.
The 2 experienced nuclear medicine physicians scored and compared the standard PET/CT and the iMAR PET/CT. The non–attenuation-corrected PET image was also available and considered. The images were scored by answering 9 questions ranging from interpretation of the images to confidence and recommended follow-up procedure (Table 2). The metal artifacts affected the interpretation of the standard PET/CT for most patients with dental and hip implants (both 18F-FDG and 68Ga-PSMA tracers) (observer agreement, 16/21), and the iMAR tool was useful for most patients with dental, hip, and shoulder implants (observer agreement, 19/21). For patients with metal screws in the vertebrae, the iMAR algorithm was less helpful; the artifacts on the posterior side of the implant were mainly reduced whereas the anterior artifacts were not (this is where the 18F-FDG–avid lymph nodes were located). This could be caused by the spine preset that is dominated by the beam-hardening correction component of the algorithm; it could be too weak depending on the shape of the metal implant.
For most patients, the iMAR algorithm did not change the diagnosis or staging of the disease (observer agreement, 16/21) because of the extensiveness of the disease; however, it did increase the confidence of the interpretation with on average an increase of 28% ± 20% (on a scale of 0%–100% confidence of interpretation). The confidence in interpretation increased or remained the same when iMAR was used; in no case did iMAR reduce confidence. For the patients included in the present study, the use of iMAR for 68Ga-PSMA PET scans did not change disease stage, because distant metastases were present in 4 of 7 patients. Yet, the detection of small lesions is possible with these scans, and because artifacts are located in the area in which regional prostate nodal metastasis can be expected (obturator nodes, parailical nodes) the iMAR reconstruction is specifically beneficial when no distant metastases are present. The uncorrected PET images are not beneficial in these circumstances, because of the difficulty detecting small lesions for these images. Examples of the effect of iMAR on PET and PET/CT images are given in Figures 2 and 3.

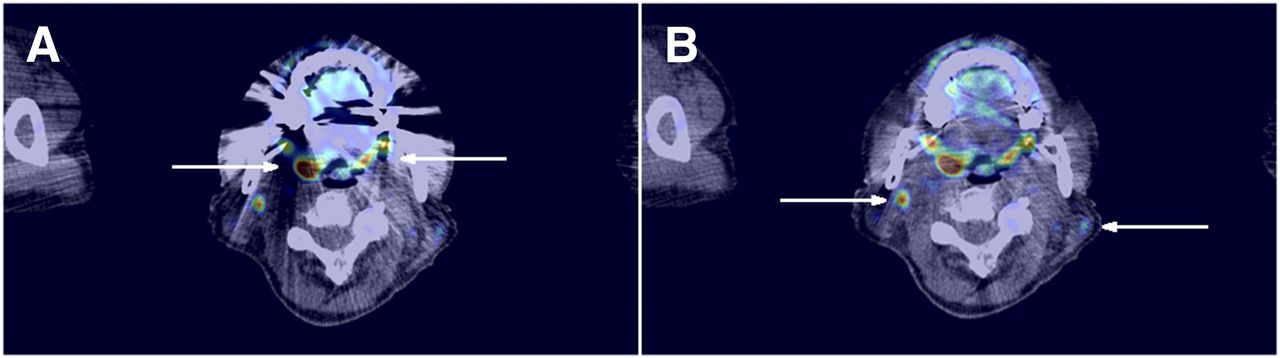
Patient with uptake in palatine tonsils (arrows in A) and 18F-FDG–avid lymph nodes (arrows in B). Metal artifacts are visible on standard PET/CT reconstruction (A), whereas iMAR PET/CT reconstruction (B) shows less distortion.
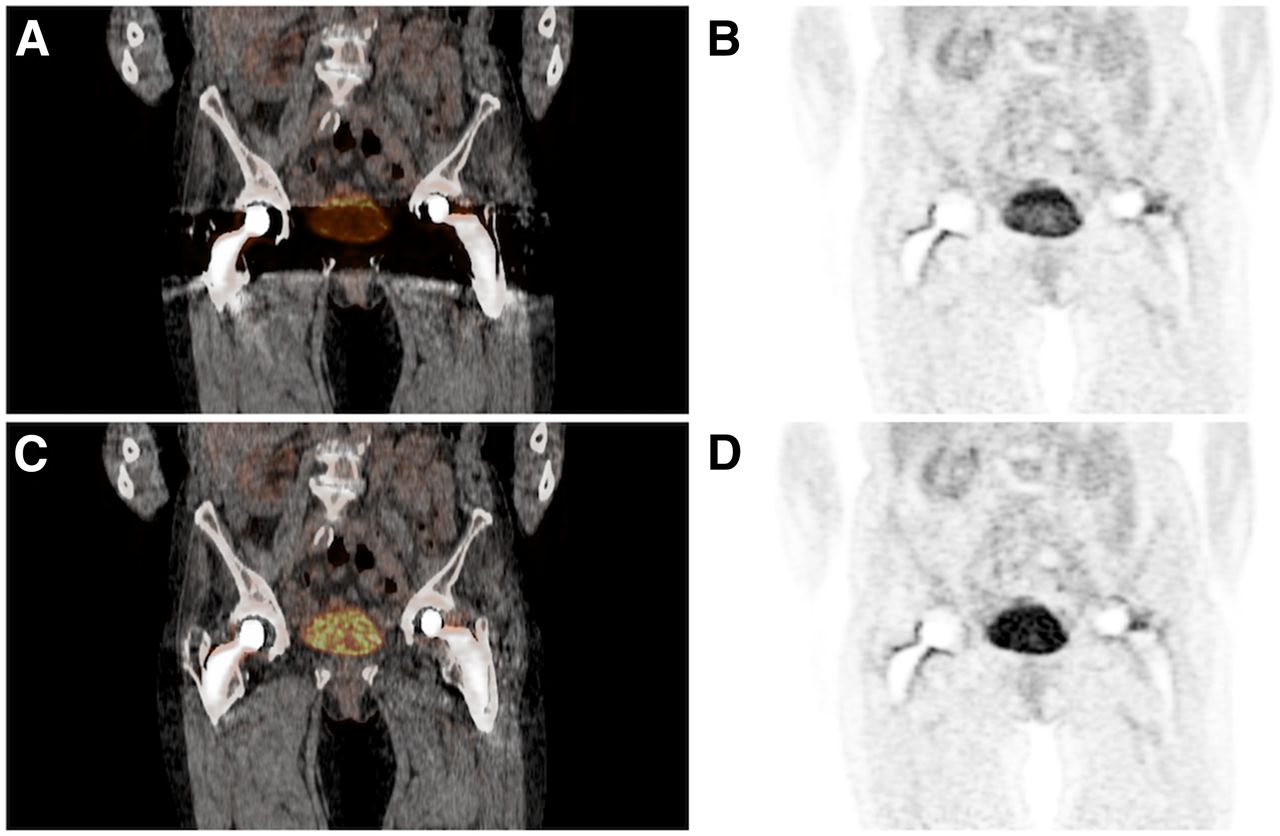
Patient with possible malignant cyst in right ovary, which was not interpretable due to metal artifacts. Effect of metal artifact on CT is also visible on PET. Region between both hip implants show lower activity for standard PET/CT (A and B), which is clearly visible in bladder, whereas iMAR PET/CT (C and D) shows image closer to true distribution of 18F-FDG.
The results of the quantitative ROI measurements are shown in Figure 4. The Bland–Altman plots show the effect of metal artifacts on HU and SUVmean. The mean HU and SUV of the background ROIs were unaffected by the iMAR algorithm, whereas the values of the ROIs located closer to the implant were affected depending on the type of metal artifact. For the ROIs with an underestimated HU, located in a dark streak, the average HU increased from −355 ± 180 to −27 ± 59 HU (P < 0.001), whereas the HU of ROIs located in the bright streaks (overestimated HU) decreased from 489 ± 419 to 85 ± 75 (P < 0.001). The ROIs in the unaffected areas (background) showed no significant difference between the standard and iMAR CT. The effect of the metal artifact was not only visible on the CT images, but also measurable on the PET scans. The effect on SUVmean was significant: SUVmean in areas with SUV underestimation increased from 0.9 ± 0.7 to 1.1 ± 0.8 g/cm3 (P < 0.001), whereas SUVmean in ROIs with an overestimated SUV decreased from 1.4 ± 1.1 to 1.2 ± 0.9 g/cm3 (P < 0.001). For the background measurements on the PET scans, there was no significant difference between the SUVmean of the standard PET reconstruction and the iMAR PET reconstruction. The ROI measurements of the lesions showed an SUVmean range between the 2 reconstructions of −0.71 and 0.38 g/cm3; the difference in SUVmean can be either positive or negative because of the type of artifact. The mean absolute difference in SUVmean is 3.5% ± 3.3%, indicating that metal artifacts also have an impact on quantitative measurements of lesions.
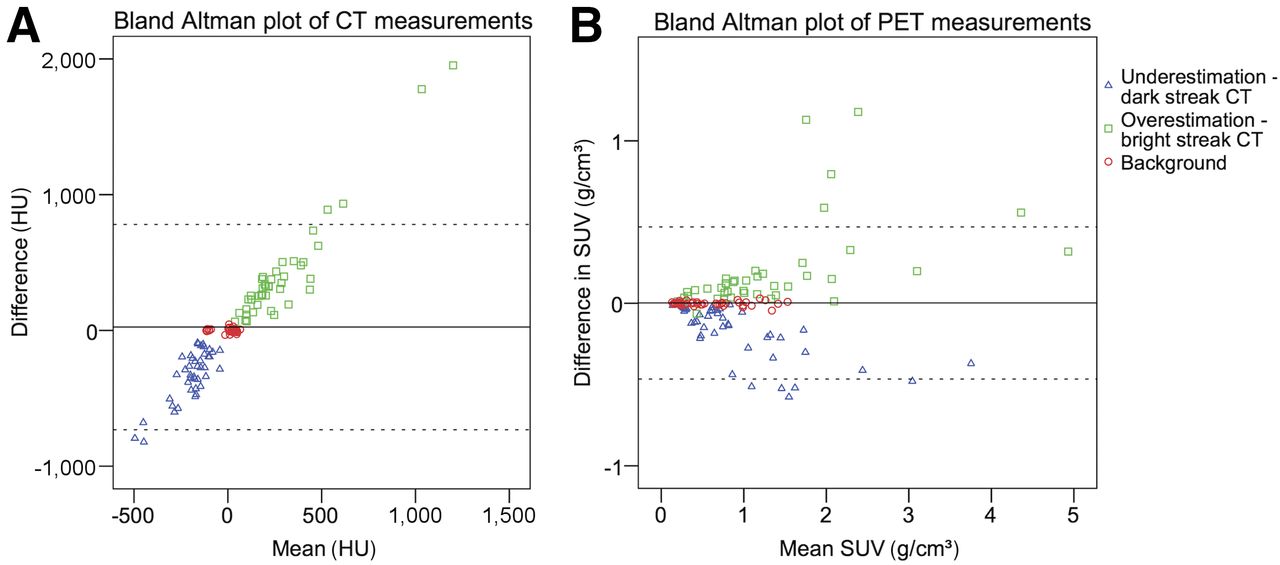
Bland–Altman plots of ROI measurements, shown for HU measurements on CT (A) and SUVmean measurements for PET reconstructions (B). In the figure, difference between 2 measurements (standard − iMAR) is plotted against mean of these 2 measurements. Effect of algorithm not only is visible on CT image, but also influences PET image.
The possibility of motion between CT and PET is of particular concern in the case of a metal prosthesis (6). Qualitative inspection of our patient scans gave reason to expect that such motion had occurred (in the area of the implant) in 1 patient with dental implants. However, the clinical impact was difficult to predict. As mentioned in the “Materials and Methods” section, we were able to induce a motion artifact in the phantom scan to analyze the consequences of 3 mm mismatch between PET and CT. The inconsistent attenuation correction resulted in an 8-fold overestimation of tracer concentration at the edge of the prosthesis and gave an incorrect impression that radiotracer was present inside the metal prostheses. This is shown in a coronal section in Figure 5A.

PET images of phantom when CT was misaligned by 3 mm (laterally in region of prosthetic femoral heads). (A) Normal, CT attenuation-based reconstruction. (B and C) One and 10 iterations of TOF-MLACF reconstruction.
DISCUSSION
The present study reports on the first clinical results of a newly available MAR tool for PET/CT. The iMAR algorithm improves the CT images by reducing metal artifacts, creating a more realistic representation of the anatomy of the patient. Our study shows that the iMAR CT affects PET attenuation correction, resulting not only in an increase of confidence in interpretation of the PET/CT images, but also (although in a lesser extent) in a more accurate quantification of radiopharmaceutical uptake in lesions located near the metal implant. This exploratory study shows that the iMAR algorithm benefits image reconstruction in different types of metal implants and tracers, and for different indications. These range from staging, radiotherapy planning, and response monitoring in head and neck cancer patients with dental implants to diagnosis and staging in prostate cancer for patients with metal hip implants (due to uncertainty of the presence of lymph node metastases in cold areas).
Even though precautions are generally taken to reduce the occurrence of a mismatch between PET and CT, it still occurs and can have clinical consequences. When metal implants are present, a movement of just 3 mm can induce a big difference in the calculated tracer concentration. The uptake patterns surrounding the prostheses are of importance to distinguish between different diagnoses, for instance, to distinguish between infection and loosening of the implant or screws. It is therefore important to verify that no mismatch between PET and CT is present for patients with metal implants, especially for patients with dental implants because motion is more common in this area. In future investigations, we think that the best solution to reduce these artifacts caused by movement between PET and CT acquisition might involve a modern approach to PET reconstruction in which iterative reconstruction is used to simultaneously estimate radiotracer concentration and attenuation-correction factors, for instance, the TOF maximum-likelihood attenuation-correction factors method (TOF-MLACF) (16). To test the possibility that this approach might remove mismatch-related artifacts, we applied the TOF-MLACF algorithm to the phantom scan for the bed position that contained the femoral heads. Figures 5B and 5C show the corresponding coronal sections after 1 and 10 iterations of the algorithm. After 1 iteration, the artifact was reduced to less than about a 2-fold increase above background. After 2 iterations, the artifact was less than a 1.5-fold increase (not shown). After 10 iterations, the artifact was entirely removed, and tracer concentration was correctly assigned a value close to 0.
In the present exploratory study, 21 patients, with different indications, type of implants, and disease, were included to give an indication for which patients the metal artifact reduction could be of importance. Further research is necessary to evaluate metal artifact reduction in specific patient populations and its effect in regard to the use of different tracers. It was clear that the use of iMAR improved the confidence of the nuclear medicine physicians in general, which will reduce time reviewing the scans and diminish insecurities toward the referring clinician. We therefore would like to advocate for consideration of the use of iMAR in all patients with metal implants when PET/CT is performed.
CONCLUSION
The newly available iMAR algorithm benefits confidence in image interpretation and has a positive impact on quantitative accuracy. The added diagnostic value depends on the location and size of the prosthesis/metal implant, in combination with the indication for the PET/CT scan, and location and extent of the disease. It can influence lesion detection in the case of staging and detection of disease, and quantification of the lesion in the case of radiotherapy planning and therapy response monitoring.
DISCLOSURE
James J. Hamill, Vladimir Y. Panin, and Christian Hofmann are employed by Siemens Healthcare. Charlotte S. van der Vos received an educational grant during the writing of this manuscript from Siemens Healthcare, The Hague, The Netherlands. No other potential conflict of interest relevant to this article was reported.
Acknowledgments
We thank Dr. Harshali Bal for her assistance reconstructing the PET images.
Footnotes
Published online May 10, 2017.
- © 2017 by the Society of Nuclear Medicine and Molecular Imaging.
REFERENCES
- Received for publication February 1, 2017.
- Accepted for publication May 4, 2017.


