


Abstract
The rationale of this study was to examine whether 18F-FDG PET/CT and contrast-enhanced CT performed immediately after percutaneous ablation of liver metastases are predictors of local treatment failure at 1 y. Methods: This Health Insurance Portability and Accountability Act–compliant, Institutional Review Board–approved retrospective study reviewed 25 PET/CT-guided thermal ablations performed from September 2011 to March 2013 on 21 patients (11 women and 10 men; mean age, 56.8 y; range, 35–79 y) for the treatment of liver metastases (colorectal, n = 23; breast, n = 1; and sarcoma, n = 1). One to 3 tumors (mean size, 2.3 cm; range, 0.7–4.6 cm; mean SUVmax, 22.7; range, 9.5–77.1) were ablated using radiofrequency (n = 16) or microwave (n = 9) energy in a single session. Immediate-postablation enhanced CT and PET/CT scans were qualitatively evaluated by 2 reviewers independently, and the results were compared with clinical and imaging outcome at 1 y. The PET/CT scans were also analyzed to determine tissue radioactivity concentration (TRC) from 3-dimensional regions of interest in the ablation zone, the margin, and the surrounding normal liver to calculate a TRC ratio, which was then compared with outcome at 1 y. Receiver operating characteristics (ROC) were used, and the maximal-accuracy threshold in predicting recurrence was calculated. Results: Eleven (44%) of the 25 tumors recurred within 1 y. Enhanced CT did not significantly correlate with recurrence (P = 0.288). Accuracy was 64% (16/25), and the area under the ROC curve was 0.601 (95% confidence interval [95% CI], 0.387–0.789). The accuracy of the qualitative analysis of 18F-FDG PET was 92% (23/25) (P < 0.001), and the area under the ROC curve was 0.929 (95% CI, 0.740–0.990). The mean TRC ratio was 40.6 in the recurrence group (SD, 9.2; range, 29.3–53.9) and 15.9 in the group without recurrence (SD, 7.3; range, 3–27.3). A TRC ratio of 28.3 predicted recurrence at 1 y with 100% accuracy (25/25) (P < 0.001), and the area under the ROC curve was 1 (95% CI, 0.863–1). Conclusion: Immediate PET/CT accurately predicts the success of liver metastasis ablation at 1 y and is superior to immediate enhanced CT.
A limitation of image-guided ablation is the lack of accurate and validated intraprocedural markers of efficacy (1,2). One potential biomarker is 18F-FDG PET/CT, which is a sensitive indicator of cell viability relative to anatomic imaging modalities such as CT, MR, and ultrasound (3–5). The advantages of 18F-FDG PET/CT include more accurate preprocedural staging to determine treatment options, intraprocedural guidance to target difficult-to-see lesions (6,7), and postprocedural detection of residual or recurrent disease (3,8).
Prior studies suggested that 18F-FDG PET can accurately identify local recurrences after liver ablation within 3 mo (9–11). The superiority of 18F-FDG PET/CT over other imaging modalities after ablation of colorectal liver metastases has been reported, with a sensitivity and specificity of 92%–95% and 100%, respectively, for PET/CT, compared with 83%–97% and 100%, respectively, for CT, in the detection of local tumor progression (9–11). Before 3 mo, however, PET/CT may be confounded by the presence of inflammatory changes as part of the natural and reactive postablation healing process. After ablation, histologic changes within a few days to weeks include a central zone of necrosis surrounded by a zone of inflammation caused by the recruitment of neutrophils, lymphocytes, and macrophages (12–16). 18F-FDG uptake due to ablation-related inflammatory changes can lead to a false-positive assessment for residual viable tumor (11,17).
Studies examining PET/CT imaging within 24–48 h after ablation have led to different interpretations regarding the contribution and timing of postablation inflammation. Some studies concluded that early PET/CT may be useful for differentiating between postablation inflammation and residual tumor (18,19), whereas others suggested that inflammation after 24 h limits interpretability (5,20). We have previously demonstrated the feasibility of performing PET/CT during tumor ablation (7,21). We hypothesized that performing PET/CT immediately after tumor ablation enables real-time assessment of treatment efficacy while the patient is still on the table and under general anesthesia. Such assessments could guide additional ablation or identify patients at risk for early local tumor recurrence and treatment failure. With clinical and imaging data at 1 y serving as the gold standard, the current study examined whether 18F-FDG PET/CT and contrast-enhanced CT performed immediately after percutaneous ablation of liver metastases are predictors of local treatment failure.
MATERIALS AND METHODS
This retrospective study was compliant with the Health Insurance Portability and Accountability Act. The Institutional Review Board approved the waiver of informed consent for this review of patient data, which were acquired through medical records, imaging reports, and pathology reports.
Patient Selection
From September 2011 to March 2013, 48 consecutive 18F-FDG PET/CT–guided hepatic thermal ablations of 18F-FDG–avid metastases were performed on 34 patients at our institution. These ablations were mostly salvage cases performed under both enhanced CT and PET/CT guidance, given the improved target conspicuity. After exclusion of patients who underwent ablation without a full year of imaging follow-up (CT or PET; n = 13), 21 patients were included in our study. In total, 25 percutaneous PET/CT-guided thermal ablations of 18F-FDG–avid liver metastases were retrospectively reviewed. The mean age of the patients was 56.8 y (range, 35–79 y); 10 patients were male (47.6%) and 11 female (52.4%). The metastases were from colorectal carcinoma (n = 23), breast cancer (n = 1), and sarcoma (n = 1). The mean tumor size was 2.3 cm (range, 0.7–4.6 cm), and the mean SUVmax was 22.7 (range, 9.5–77.1). Eighteen patients (85.7% [18/21]) underwent a single ablation. Two patients underwent ablation of 2 lesions, and 1 patient of 3 lesions, in a single session. Of the 25 ablations, 16 were performed with radiofrequency devices (64%) and 9 with microwave devices (36%). Patient, tumor, and ablation characteristics are summarized in Table 1.
Patient Data, Disease Characteristics, and Treatment and Imaging Parameters
Percutaneous Ablation Procedures Under PET/CT Guidance
The ablations were performed by 5 board-certified interventional radiologists with 5–15 y of experience in a dedicated PET/CT interventional suite (Discovery D690; GE Healthcare) with the patients under general anesthesia. Selection of patients for PET/CT-guided liver ablation was based on a perceived advantage of continual visualization of hypermetabolic ablation targets at all stages of ablation: applicator insertion, repositioning, and actual ablation. The treating physicians considered the location, size, and PET avidity of each ablation target when selecting the perceived optimal modality for ablation guidance irrespective of concomitant liver disease such as hepatitis or cirrhosis. Operator discretion dictated the modality used for ablation (radiofrequency or microwave), though similar factors, including tumor size and location relative to surrounding structures, blood vessels, and bile ducts, were considered in each case.
An intraprocedural split-dose 18F-FDG (Cardinal Health) PET imaging protocol was used in all cases (6,7). The first dose was injected before ablation (mean dose ± SD, 159.1 ± 7.77 MBq [range, 144.3–177.6 MBq]; mean uptake time, 99± 33.6 min [range, 45–162 min]), and the second dose followed immediately after ablation (mean dose, 307.1 ± 48.1 MBq [range, 162.8–325.6 MBq]; mean uptake time, 52.9 ± 24.7 min [range, 20–118 min]) to determine whether any 18F-FDG activity remained in the created ablation zone. The mean plasma glucose level before the first dose was 108.1 mg/dL (range, 67–209 mg/dL; SD, 30.8 mg/dL). The mean delay between the first and second doses was 250 min (range, 90–450 min).
Patient positioning was determined by the interventional radiologist based on target lesion location and accessibility and the shortest skin-to-target distance. Localizing PET/CT was performed with a ventilator-assisted breath-hold for an approximately 1-min PET acquisition and a 30-s unenhanced hepatic CT acquisition. Ablation applicators were positioned with the guidance of conventional CT, CT fluoroscopy, and, as needed, sonography without contrast injection. Serial ventilator-assisted breath-hold CT images of the needle in position were obtained and then fused with the initial breath-hold PET dataset to confirm accurate needle positioning relative to the 18F-FDG–avid target. The number of ablation applicators, the ablation modality, and the ablation parameters were selected at the discretion of the operator with an aim of creating an ablation zone with at least 5-mm margins surrounding the target tumor. At the end of the procedure, triple-phase enhanced CT was additionally performed.
Follow-up
A review of clinical and imaging follow-up evaluations at 1 y was performed by one of the authors with 5 years of experience in medical imaging. The author reviewed all enhanced CT images to determine whether any residual enhancement was present. A physician with 20 y of experience in nuclear medicine reviewed the PET/CT images for the presence of residual uptake without access to the clinical data. These results were compared with the clinical outcomes and then recorded as a reference.
Qualitative and Quantitative Analysis of Immediate-Postablation PET/CT and Enhanced CT Scans
Two independent specialists in interventional radiology with 4 and 10 y of experience, who did not participate in the ablations, qualitatively reviewed the postablation PET/CT and enhanced CT scans for the enhancement pattern around the ablation zone. The CT images were classified as showing no enhancement (score of 1), ringlike peripheral enhancement (2), or nodular enhancement (3). The PET/CT images were classified as showing no uptake in the ablation zone (1), equivocal or indeterminate residual uptake (2), or obvious residual uptake (3).
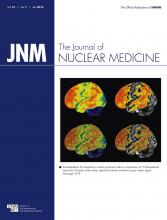
After the reviewers had reached a consensus, a quantitative assessment was performed using a rectangular 3-dimensional region of interest (ROI 1) including the whole ablation zone and its margins. This ROI was measured on the attenuation-corrected PET images (Fig. 1). In addition, a rectangular 3D ROI (ROI 2) was obtained in the healthy liver for comparison (22). Assessment was performed on a dedicated workstation (Advantage Workstation 4.3; GE Healthcare). To account for the additional 18F-FDG administration used in the split-dose protocol, and because SUV is highly dependent on the time between administration of 18F-FDG and the start of acquisition, tissue radioactivity concentration (TRC) was used (kBq/mL) instead of SUV. The TRCmax (kBq/mL), TRCmean (kBq/mL), SD (kBq/mL), and size (cm3) of each ROI were recorded. The TRC ratio was then calculated to normalize uptake in the ablation zone to background liver uptake as follows: TRC ratio = [(ROI 1 TRCmax – ROI 2 TRCmean)/ROI 2 TRCmean] × 100.

Quantitative PET/CT image analysis. (A) Axial unenhanced CT scan of ablated zone (arrow), providing no information on treatment effectiveness. (B) Positioning of two 3-dimensional ROIs on corrected PET image: one including ablative zone and its margins and one including healthy liver. (C) Axial PET/CT image used to control position of ROI. (D) Adjustment of ROI in coronal plane to avoid including adjacent high-uptake tissue, such as kidney.
Statistical Analysis
Interobserver agreement on the qualitative review was assessed with the Cohen κ-coefficient. The κ-value was interpreted as indicating poor agreement when 0.40 or lower, moderate agreement when greater than 0.40 but no more than 0.60, and substantial agreement when greater than 0.60.
The two reviewers discussed all cases with discrepancies and reached a consensus for both modalities. The consensus interpretation was then compared with the imaging and clinical outcomes at 1 y using the Fisher exact test and receiver operating characteristics (ROCs).
A mean TRC ratio for each ablation zone was calculated using the postablation PET/CT scan assessment by the two reviewers. This ratio was then compared with the outcome at 1 y using ROCs to determine the threshold for maximal accuracy in predicting recurrence at 1 y. Sensitivity, specificity, and accuracy were calculated. All statistical comparisons were performed with STATA software. Statistical significance was considered present at a P level of less than 0.05.
RESULTS
Patient Outcomes
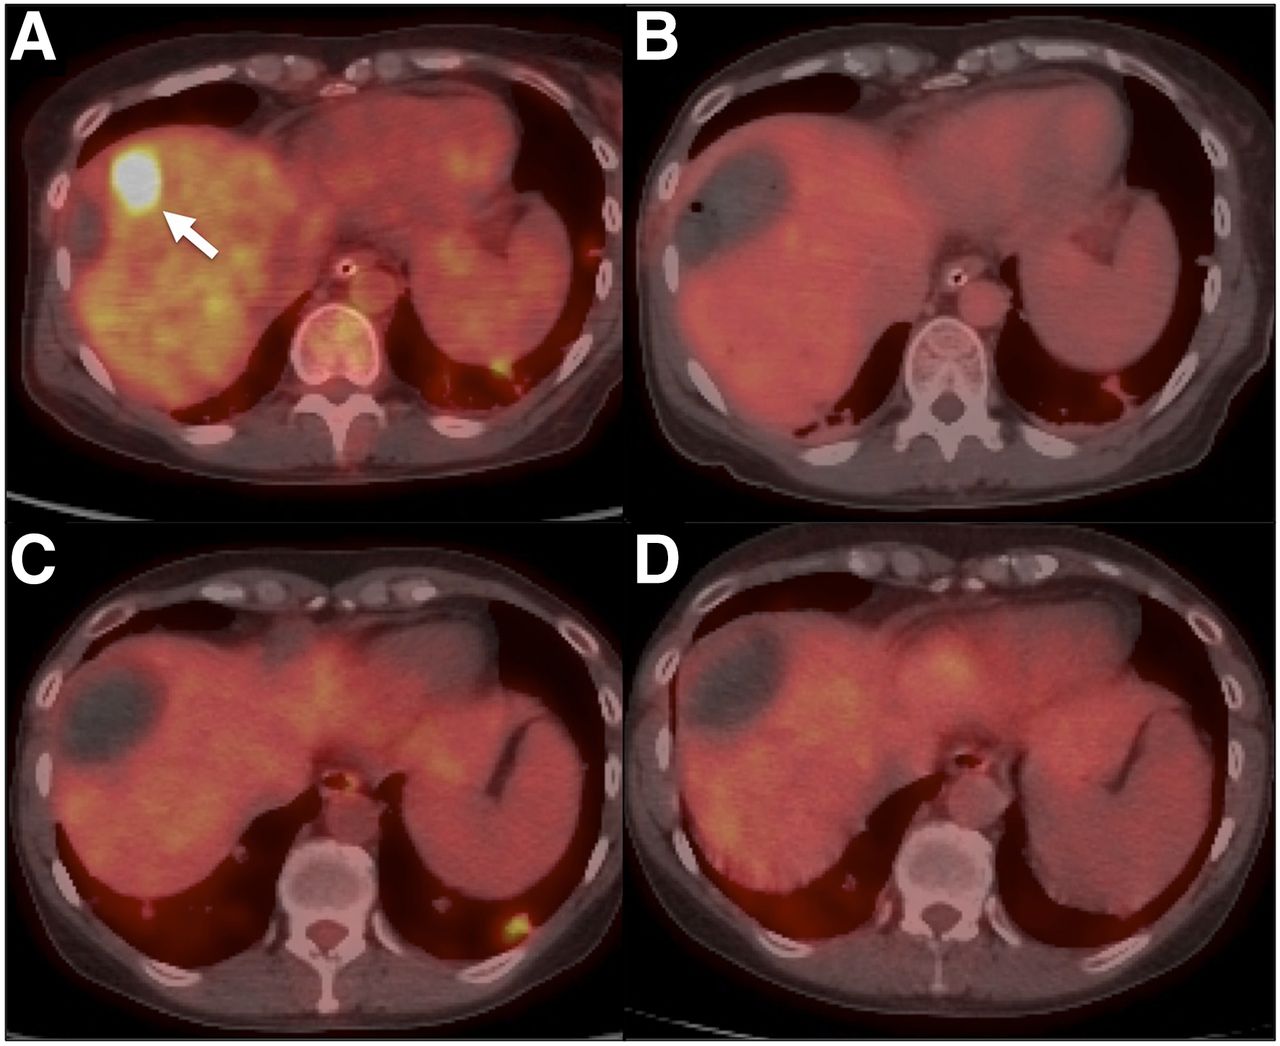
Among the 25 tumors treated in 21 patients, 11 tumors (44%) in 9 patients recurred locally within 1 y as assessed clinically and radiologically. Ten relapsed lesions (43.5% [10/23]) were observed in 9 patients with colorectal cancer and 1 in the patient with sarcoma. All recurrences had both enhancement on enhanced CT and uptake on 18F-FDG PET within the ablation zone (Fig. 2).

PET/CT-guided radiofrequency ablation in 47-y-old man with 22-mm metastasis from colon adenocarcinoma. (A) PET/CT image before ablation showing metastasis (arrow; SUVmax, 17). (B) Image immediately after ablation showing equivocal residual uptake (TRC ratio, 40). (C) Image at 6 mo showing obvious uptake concordant with previous findings. Residual tumor was identified, but no local treatment was proposed. (D) Image at 1 y showing similar results.
Qualitative Assessment of Immediate-Postablation Enhanced CT and PET/CT
Interobserver agreement was poor for the qualitative assessment of enhanced CT (κ = 0.172) and PET/CT (κ = 0.29).
The consensus interpretation for enhanced CT classified 21 ablation zones as not showing peripheral enhancement and 4 as showing peripheral ringlike enhancement. Nodular enhancement in the area surrounding the ablation zone was not observed in any case. Statistical significance in predicting recurrence at 1 y was not observed for these patterns (P = 0.288, Table 2). Sensitivity was 27.3% (3/11) (95% confidence interval [95% CI], 7.3–60.7), specificity 92.9% (13/14) (95% CI, 64.2–99.7), positive predictive value 75% (3/4) (95% CI, 21.9–98.7), and negative predictive value 61.9% (13/21) (95% CI, 38.7–81). Accuracy was 64% (16/25), and area under the ROC curve was 0.601 (95% CI, 0.387–0.789).
Qualitative Assessment Patterns by Consensus on Immediate-Postablation Enhanced CT and 1-Year Outcome
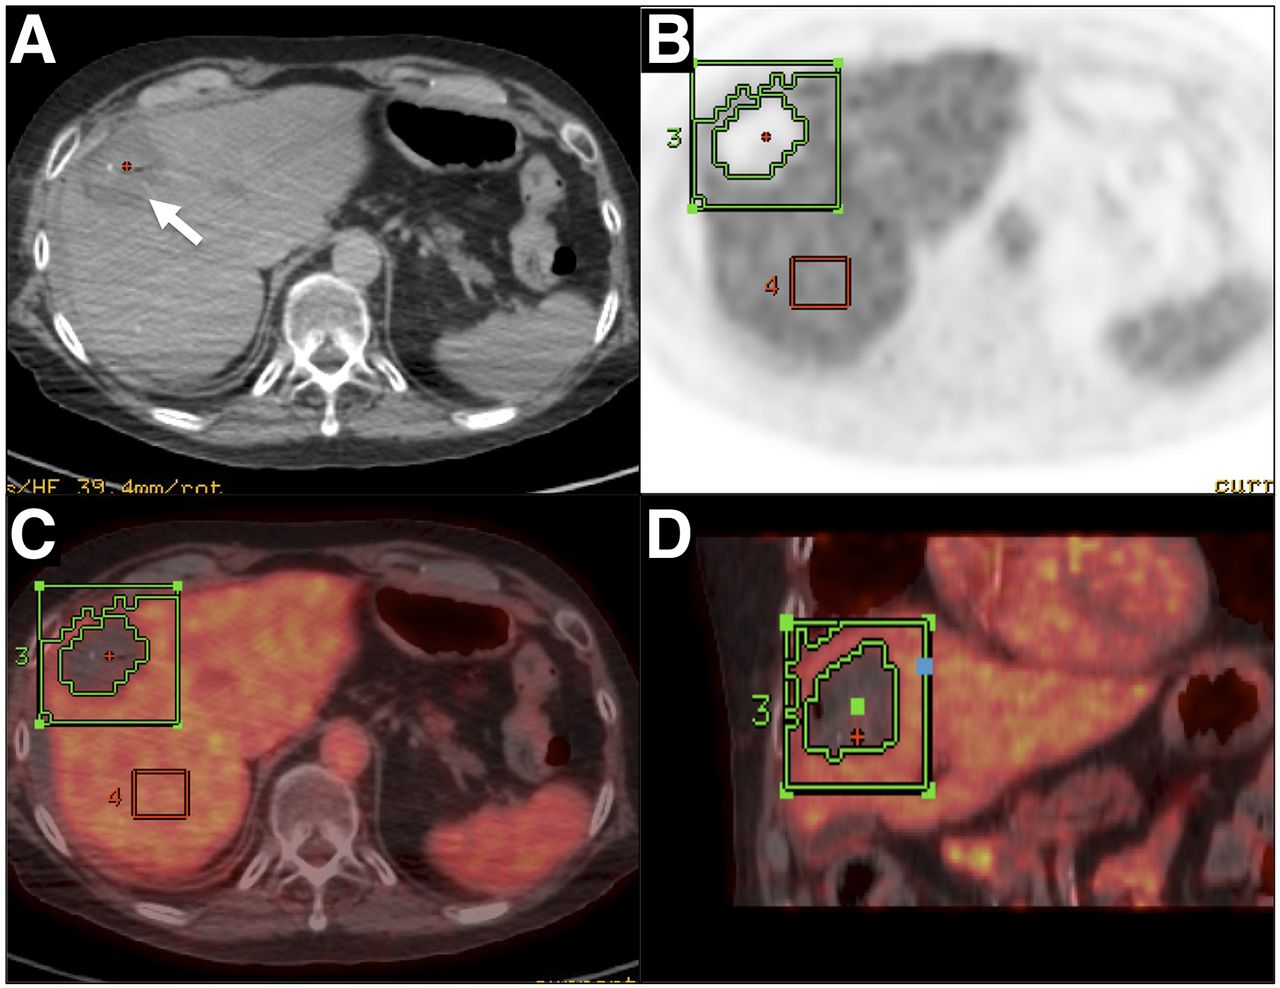
The consensus interpretation for PET/CT classified 12 ablation zones as not showing residual 18F-FDG uptake (Fig. 3), 11 as being indeterminate or equivocal for residual uptake, and 2 as showing obvious residual uptake (Fig. 2). Statistical significance in predicting recurrence at 1 y was observed (P < 0.001; Table 3). After the equivocal and obvious findings were combined, as both may be considered positive results, the sensitivity was 100% (11/11) (95% CI, 67.9–1), specificity 85.7% (12/14) (95% CI, 56.2–97.5), positive predictive value 84.6% (11/13) (95% CI, 53.7–97.3), and negative predictive value 100% (12/12) (95% CI, 69.9–1). Accuracy was 92% (23/25), and area under the ROC curve was 0.929 (95% CI, 0.740–0.990).
PET/CT-guided radiofrequency ablation in 44-y-old woman with 16-mm metastasis from colon adenocarcinoma. (A) PET/CT image before ablation showing metastasis (arrow; SUVmax, 13). (B) Image immediately after ablation showing no residual uptake (TRC ratio, 7.4). (C) Image at 6 mo showing no uptake, concordant with previous findings. (D) Image at 1 y showing no residual disease.
Qualitative Assessment Patterns by Consensus on Immediate-Postablation Enhanced PET/CT and 1-Year Outcome
Quantitative Analysis of Immediate-Postablation PET/CT
The mean TRC ratios are reported in Table 4. Using ROCs, a threshold of 28.3 was determined to be most accurate in predicting recurrence at 1 y: accuracy, 100% (25/25); area under the ROC curve, 1 (95% CI, 0.863–1). Eleven ablation zone TRC ratios were above this threshold, with all ablation zones having recurrence at 1 y (sensitivity, 100% [11/11]) (Fig. 2). On the other hand, none of the ablation zones with TRC ratios below this threshold had recurrence (specificity, 100% [14/14]) (Fig. 3). The mean TRC ratio was 40.6 in the recurrence group (SD, 9.2; range, 29.3–53.9) and 15.9 in the group without recurrence (SD, 7.3; range, 3–27.3).
Quantitative Analysis of Immediate-Postablation PET/CT
DISCUSSION
A major challenge in interventional oncology is the development of intraprocedural prognostic markers of recurrence. The importance of such markers is even greater for tumor ablation, which, in contrast to arterially directed therapies, is usually intended to completely eradicate disease within the treated volume. Immediate postablation morphologic imaging with CT and MRI to evaluate the completeness of treatment has several limitations and lacks the functional data provided by PET/CT. Moreover, even needle biopsy of the ablation zone presents several challenges caused by sampling errors and processing time (23,24).
The benefit of PET/CT for the long-term detection of local tumor progression has been well documented (11,25,26). For postprocedural evaluation of ablation success, PET/CT has been used successfully either immediately (7) or within 24–48 h (5,18,25–27). A recent study by Vandenbroucke et al. (5) compared PET/CT and enhanced CT performed 24 h after ablation in predicting local tumor progression within 8–10 wk. With 20% of tumors recurring, the authors concluded that the development of inflammation and hyperemia can complicate PET/CT interpretation 24 h after ablation because of the high percentage (29%) of scans with increased “rimlike” metabolic activity around the ablation zone. In contrast, we did not see this confounding rimlike activity immediately after ablation using the split-dose technique, allowing us to make a clearer distinction. In our analysis, we defined a category for PET/CT scans that were indeterminate or equivocal for either complete ablation or evident residual disease because early imaging with the patient still on the table avoided detection of reactive changes around the ablated area. Despite the immediate performance of PET/CT, however, 11 of 25 scans (44%) were classified as indeterminate or equivocal for residual metabolic activity. This finding affected the predictive value of the qualitative PET/CT review, taking into account that 9 of 11 (82%) tumors recurred within this category. This limitation requires quantitative assessment of immediate PET/CT through determination of a tissue radioactivity threshold that permits objective classification of scans and stratification of the risk for local tumor progression. The current study demonstrated that 18F-FDG PET/CT performed immediately after hepatic metastatic tumor ablation accurately predicts treatment failure as detected by imaging and clinical data at the 1-y follow-up. The high sensitivity and high positive predictive value observed in our study indicate that the local recurrences 1 y after ablation were likely due to incomplete ablation, suggesting that PET/CT may be superior to immediate-postablation morphologic CT (28). Ringe et al. (1) recently evaluated the margins with CT and MRI 24 h after ablation of liver metastases and concluded that neither technical success nor ablation margin morphology could be used as a prognostic factor for local tumor recurrence. Our study confirmed these results by showing that immediate-postablation CT enhancement patterns were not very predictive of ultimate treatment success at 1 y. By providing immediate functional data on the viability of the treated tumor, PET/CT may overcome these limitations.
A significant percentage of tumors (11/25 [44%]) in our study recurred within 1 y. Even though this rate is within the published range, especially for a salvage population, we would like to underline that the use of intraprocedural PET/CT was chosen for patients with lesions that were difficult to visualize on unenhanced CT or ultrasound. Additionally, patients included in our study either had a full year of follow-up or had reached the outcome of interest (i.e., local tumor progression) before 1 y. Hence, patients who had PET/CT or multiphase CT scans negative for recurrence before 1 y and did not present for imaging at 1 y were not included in the cohort, thus increasing the incidence of local tumor progression in our study. Selection of the 1-y time frame was based on the fact that most recurrences are within 1 y (8,31).
The study was limited by its retrospective nature, the small number of tumors included (n = 25), and the population consisting, as it mainly did, of patients who had been referred for clinically indicated ablations in difficult salvage situations, which led to the choice of ablation guided by PET/CT in addition to enhanced CT to ensure localization of lesions through their 18F-FDG avidity. As such, selection of patients for this approach is limited to those with avid tumors. Another limitation was the absence of direct histologic validation of the imaging findings. We did not compare our imaging findings with pathologic results as the standard of reference but rather with clinical data, PET/CT, and CT. Selection bias might have occurred when the efficacy of the ablation techniques was compared. Patients in whom recurrence is more strongly suspected tend to be evaluated more often with PET/CT than with only conventional enhanced CT or MR.
CONCLUSION
Imaging with 18F-FDG PET/CT immediately after ablation of 18F-FDG–avid tumors appears to be useful for the early detection of residual disease. When such feedback provides evidence of incomplete ablation or suspected residual disease, the ablation can be repeated while the patient is still on the table or the patient can be managed with adjuvant chemotherapy and close follow-up to detect and treat recurrence early. Despite the limitations, this study had encouraging initial results for the use of SUV or TRC ratio with the split-dose technique as a real-time, surrogate imaging biomarker of tumor ablation success. This study can serve as the background for prospective investigations to validate the initial findings and correlate them with pathologic changes and oncologic outcomes.
DISCLOSURE
The costs of publication of this article were defrayed in part by the payment of page charges. Therefore, and solely to indicate this fact, this article is hereby marked “advertisement” in accordance with 18 USC section 1734. No potential conflict of interest relevant to this article was reported.
Footnotes
Published online Feb. 23, 2016.
- © 2016 by the Society of Nuclear Medicine and Molecular Imaging, Inc.
REFERENCES
- Received for publication January 2, 2016.
- Accepted for publication February 3, 2016.


Jump to section
Related Articles
Cited By...
- Immediate Postablation 18F-FDG Injection and Corresponding SUV Are Surrogate Biomarkers of Local Tumor Progression After Thermal Ablation of Colorectal Carcinoma Liver Metastases
- 18F-FDG PET/CT in Local Ablative Therapies: A Systematic Review
- Qualification of National Cancer Institute-Designated Cancer Centers for Quantitative PET/CT Imaging in Clinical Trials