


Abstract
Measurements of metabolically active tumor volume (MATV) can be applied to 18F-fluorocholine PET/CT to quantify whole-body tumor burden. This study evaluated the serial application of these measurements as systemic treatment response markers and predictors of disease progression in patients with castration-resistant prostate cancer (CRPC). Methods: Forty-two patients completed sequential 18F-fluorocholine PET/CT scans before and 1–3 mo after starting treatment for CRPC. Whole-body tumor segmentation was applied to determine net MATV from each scan. Changes in net MATV were evaluated as predictors of time to prostate-specific antigen (PSA) progression by Kaplan–Meier and proportional hazards regression analysis. Results: Treatments consisted of chemotherapy in 16 patients, antiandrogens in 19 patients, 223Ra-dichloride in 5 patients, and sipuleucel-T in 2 patients. A significant MATV response (defined as a ≥30% decrease in net MATV) was observed in 20 patients on the basis of in-treatment PET/CT performed an average of 51 d (median, 49 d) into treatment. Significantly longer times to PSA progression were observed in patients who exhibited an MATV response (418 d vs. 116 d, P = 0.0067). MATV response was associated with a hazard ratio of 0.246 (P = 0.0113) for PSA progression, which remained significant when adjusted for treatment type. Conclusion: Significant changes in whole-body tumor burden can be measured on 18F-fluorocholine PET/CT over the course of contemporary treatments for CRPC. In this study, these changes were found to be predictive of PSA progression as a potential surrogate marker of treatment outcome. Because 18F-fluorocholine PET/CT can also be used for localizing resistant tumors, this modality can potentially complement other measures of response in the precision management of advanced prostate cancer.
Prostate cancer accounts for over 300,000 deaths annually worldwide, and mortality from this disease is increasing in some regions, including Eastern Europe, Russia, China, and Korea (1). Over two thirds of prostate cancer cases are now diagnosed in developed countries, where patients are typically identified at an early stage and treated first with prostatectomy or radiation therapy (1,2). For patients who present with metastatic disease or in whom the disease recurs after these primary treatments, hormonal therapy is readily available, delaying disease progression until the development of castration-resistant prostate cancer (CRPC) (2).
Effective agents for treating CRPC have fortunately expanded over the past decade to include chemotherapy, as well as advanced antiandrogens, immunotherapy, and, recently, radiopharmaceuticals (2). However, these agents may improve survival by only weeks or months, and precision management of CRPC remains difficult because of the scarcity of tools for ascertaining tumor response in real time (3,4). Although posttreatment declines in the level of prostate-specific antigen (PSA) have been used in some prostate cancer clinical trials as a surrogate marker of response (5), these PSA-response measures have accounted for only a limited degree of the variation in treatment outcome in CRPC clinical trials (3,6). Because treatments for CRPC can also lead to clonal selection of tumors with downregulated PSA expression (7), biomarkers that can complement PSA will be needed not only to advance drug development but also to support the evolution of precision medicine in prostate cancer.
Although conventional imaging modalities (e.g., CT, MRI, and bone scintigraphy) are useful for oncologic staging in prostate cancer, they are imperfect as treatment response biomarkers for CRPC because of their inherent limitations in quantifying therapeutic effects along two dominant metastatic routes in CRPC: the skeletal system and the lymphatic system (8). Molecular imaging, despite being more cumbersome than conventional imaging or serology, can reproducibly assess the skeletal system and other clinically relevant sites of disease activity in CRPC (4) and thus can potentially complement other biomarkers while also helping to direct sequential treatments toward pockets of resistant disease.
One molecular imaging agent, 18F-fluorocholine, enables in vivo characterization of choline metabolism using PET/CT. It has shown greater tumor avidity than 18F-FDG in both androgen-dependent and androgen-independent prostate cancer (9). Tissue uptake of 18F-fluorocholine mirrors the initial steps of tissue phosphatidylcholine synthesis, which is often high in CRPC tumors but can diminish on exposure to traditional chemotherapeutic agents such as docetaxel and cabazitaxel (10) and newer agents such as abiraterone (11) and 223Ra-dichloride (12). Recently, estimates of tumor burden based on net metabolically active tumor volume (MATV) measurements from 18F-fluorocholine PET/CT were shown to have prognostic value in patients with CRPC (13). The objective of the present study was to determine whether treatment-associated changes in these measurements on sequential 18F-fluorocholine PET/CT scans are predictive of treatment outcome in CRPC.
MATERIALS AND METHODS
Patients
This prospective clinical research study was conducted in accordance with the Declaration of Helsinki and its amendments. Forty-five patients (18 prescribed docetaxel-based chemotherapy, 19 prescribed antiandrogens, 6 prescribed 223Ra-dichloride, and 2 prescribed sipuleucel-T) were enrolled after consenting in writing to participate in this institutional review board–approved study. Study eligibility was based on age over 18 y, an initial histopathologic diagnosis of prostate cancer, fulfillment of clinical criteria for CRPC as defined by 2 rising PSA measurements of 2.0 ng/mL or higher while on complete androgen blockade for longer than 3 mo, planned treatment for CRPC under the supervision of a medical oncologist or urologist, and life expectancy of more than 12 wk. Patients who could not tolerate PET/CT imaging and those with other malignancies diagnosed in the past 3 y, except for basal cell carcinoma or superficial transitional cell carcinoma of the bladder, were excluded.
Patients were treated in a community setting, with all enrollment and clinical follow-up performed between August 2009 and August 2015. All patients underwent baseline 18F-fluorocholine PET/CT before starting treatment for CRPC. A second in-treatment 18F-fluorocholine PET/CT scan was scheduled before the midpoint of treatment at approximately 1–3 mo, corresponding to clinic visits after the second chemotherapy treatment cycle, antiandrogen therapy follow-up, or the second dose of 223Ra-dichloride. All treatment decisions were made independently of the study by a medical oncologist or urologist.
Radiopharmaceutical Synthesis
An 11-MeV cyclotron (RDS 111; Siemens Medical Solutions) was used to produce 18F. The radiotracer was synthesized by fluorination of ditosylmethane followed by alkylation of the intermediate with dimethylethanolamine using an automated chemical process control unit (CTI/Siemens) (14). Each radiopharmaceutical batch passed standard assays for radiochemical purity, radionuclide identity, lack of pyrogenicity, and chemical purity before use. The final radiochemical purity was 99%.
PET/CT Imaging
All patients refrained from eating and drinking for at least 3 h before undergoing PET/CT. Imaging was performed using a Gemini TF-64 PET/CT scanner (Philips Healthcare) beginning with CT scanning from the mid thigh to the skull with the patient supine. The 64-channel helical CT scanning parameters were 120 kV, 50 mA/slice, a rotation time of 0.75 s, and slice thickness and interval of 5.0 mm. No iodinated contrast agents were given. At approximately 10–15 min after the intravenous injection of a 2.6 MBq/kg (0.07 mCi/kg) dose of 18F-fluorocholine, sequential static emission scans were obtained from the mid thigh to the skull at 2 min per section. Images were reconstructed using a vendor-supplied maximum-likelihood expectation maximization process, with CT data applied for attenuation correction.
Image Analysis
Lesion segmentation and MATV measurements were performed as described in a previous publication (13). Briefly, the presence of tumors as seen on 18F-fluorocholine PET/CT images was classified by consensus between an interpreter with significant experience and an interpreter with 3 wk of training in 18F-fluorocholine PET/CT interpretation. Lesions were classified according to their anatomic location in the following categories: the prostate gland, a visceral organ, a lymph node, or the skeleton. Only lesions with an SUVmax of 3.0 or greater (exceeding 2 SDs above the normal-marrow SUV) were included for MATV measurement. SUV was calculated as measured voxel activity divided by injected radioactivity normalized to body weight. The MATV for each lesion was computed using a semiautomated segmentation algorithm. A volume of interest was generated around the voxel corresponding to the SUVmax of the lesion, encompassing all contiguous voxels with SUV exceeding 40% of the lesion SUVmax based on a previous study (13). A measure of activity distribution within the volume, termed total lesion activity (TLA), was also calculated by taking the product of lesion SUVmean and MATV. Measures reflecting the net tumor burden on each scan were defined as the sum of all MATVs (net MATV) and the sum of all TLAs (net TLA). Indices of whole-body tumor response were then calculated as the percentage change in these measures between baseline and in-treatment 18F-fluorocholine PET/CT scans. An MATV30% response was defined prospectively as a 30% or greater decline in net MATV from the pretreatment net MATV, and a TLA30% response was defined prospectively as a 30% or greater decline in net TLA from the pretreatment net TLA.
PSA Measurements
Clinical PSA levels measured from the start of treatment over the period of follow-up were recorded. Time to PSA progression was calculated as the number of days from the start of treatment to the date of the first PSA test result that represented a 30% or greater increase from the PSA nadir, confirmed on the basis of repeated PSA measurements. To explore relationships between changes in PSA and changes in tumor indices on 18F-fluorocholine PET/CT, the percentage change in PSA level within 15 wk of starting treatment was calculated, using a 50% or greater decrease in PSA level as a predefined definition of PSA response based on Prostate Cancer Working Group guidelines (5).
Statistical Analysis
Kaplan–Meier analysis was used to compare rates of PSA progression in patients stratified by MATV30% response or TLA30% response, with differences in progression curves assessed using the Wilcoxon and log-rank tests. Cox proportional hazards regression was used to evaluate the individual effects of age, baseline pretreatment PSA, early changes in PSA, and type of treatment on time to PSA progression. Multivariate analysis was used in a limited fashion to explore the interactions between indices derived from PET/CT and another variable. Differences between serial measurements were assessed by the Wilcoxon signed-rank test. Unpaired differences were assessed by the Mann–Whitney U test. Differences across categories were assessed by ANOVA using the Kruskal–Wallis test. Correlations were assessed using Spearman correlation. A probability of less than 0.05 was considered statistically significant. All statistical tests were 2-sided and performed using SAS, version 9.4, and JMP Pro, version 11 (SAS Institute Inc.).
RESULTS
Clinical Characteristics
Forty-five sequential patients were enrolled in the study. However, 2 patients experienced delays in treatment after the baseline PET/CT scan and were excluded, and one patient was found on baseline PET/CT to have intracranial metastases, leading to cancellation of the planned treatment. Therefore, data from only 42 patients were included in the analysis. The mean, median, and range for clinical follow-up duration were 784, 653, and 180–2,068 d, respectively. The clinical characteristics and treatments of the 42 patients are summarized in Table 1. There were no statistically significant differences in baseline patient characteristics across treatments (Table 2).
Patient Characteristics (n = 42)
Baseline Clinical Parameters According to Treatment Type
PSA Measurements
Changes in PSA levels measured within 15 wk of treatment initiation ranged from a 100% decrease to a 1,648% increase (with a median 8% decrease). A PSA response based on the Prostate Cancer Working Group definition was noted for 20 of the 42 patients. Percentage change in PSA level correlated moderately with percentage change in net MATV (r = 0.71, P < 0.0001) and with percentage change in net TLA (r = 0.73, P < 0.0001). However, an increase in net MATV/TLA coincided with a decrease in PSA level in 5 patients, and a decrease in net MATV/TLA coincided with an increase in PSA level in 3 patients. On follow-up, PSA progression was identified in 17 patients, with a mean, median, and range for time to progression of 142, 116, and 62–418 d, respectively. Early PSA progression was noted in 2 patients at 62 and 76 d in accordance with the Prostate Cancer Working Group criteria for treatment discontinuation based on clinical progression (5).
18F-Fluorocholine PET/CT Findings
The respective mean, median, and range were 4, 1, and 0–26 d for the interval from baseline 18F-fluorocholine PET/CT to start of treatment and 51, 49, and 21–98 d for the interval from start of treatment to in-treatment 18F-fluorocholine PET/CT. Twenty patients met the study criteria for an MATV30% response. The same 20 patients also met the study criteria for a TLA30% response. Because the distribution of patients with MATV30% responses was the same as the distribution of patients with TLA30% responses, the predictive power of the two indices was the same, and thus in discussing these results we will use the term MATV response generically to refer to either MATV30% response or TLA30% response. The anatomic distributions of lesions detected on the baseline and in-treatment 18F-fluorocholine PET/CT scans are summarized in Table 1. Examples of the changes in tumor activity and MATV that can be quantified on 18F-fluorocholine PET/CT are shown in Figures 1 through 3.
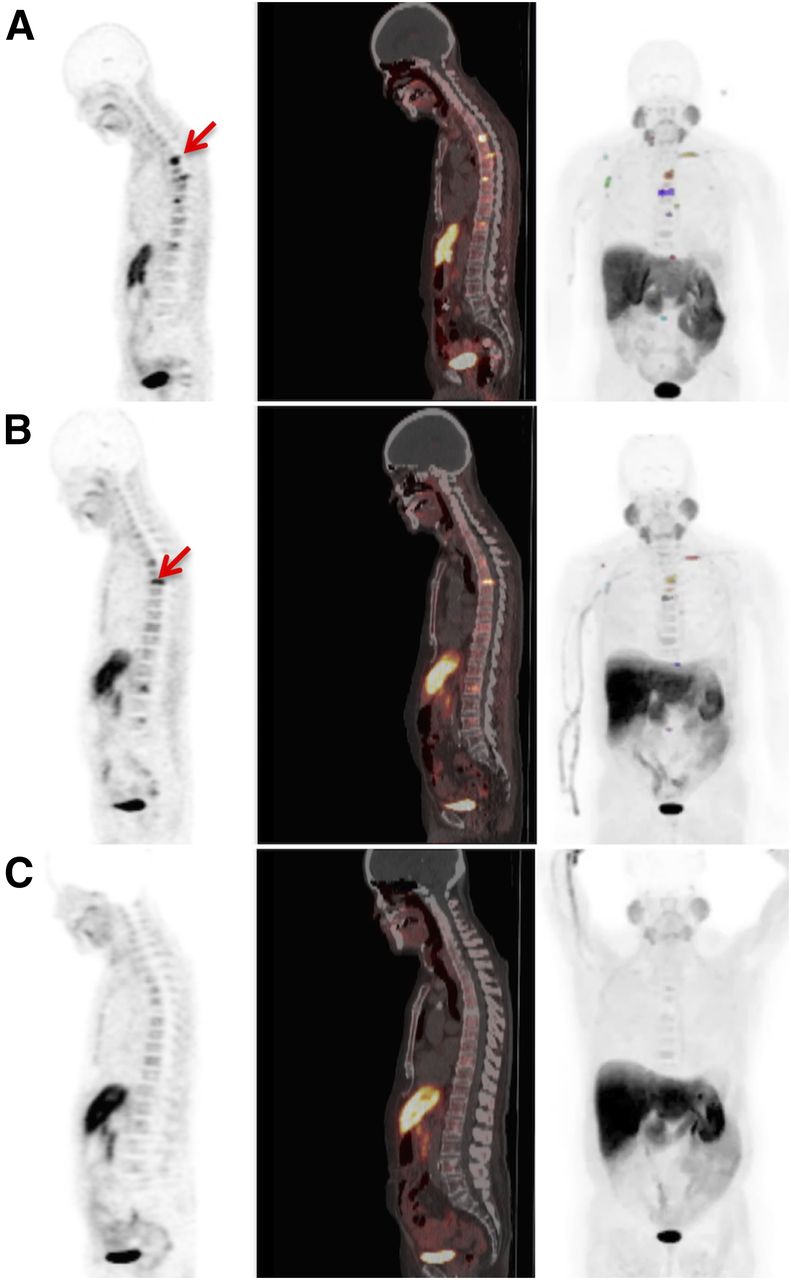
Discordance between early MATV response and PSA response, as shown by 18F-fluorocholine PET (left), PET/CT (middle), and maximum-intensity-projection (MIP) (right) images from 74-y-old patient receiving docetaxel. Color indicates MATV contours on MIP images. (A) Multiple bone metastases are evident on pretreatment PET/CT (arrow; net MATV, 42.7 cm3; PSA, 39.3 ng/mL). (B) Net MATV decreased after second chemotherapy cycle to 21.6 cm3, whereas PSA increased to 41.7 ng/mL. (C) After sixth chemotherapy cycle, PET/CT demonstrated resolution of abnormal activity (net MATV, 0.0 cm3), and PSA level decreased to 8.1 ng/mL.
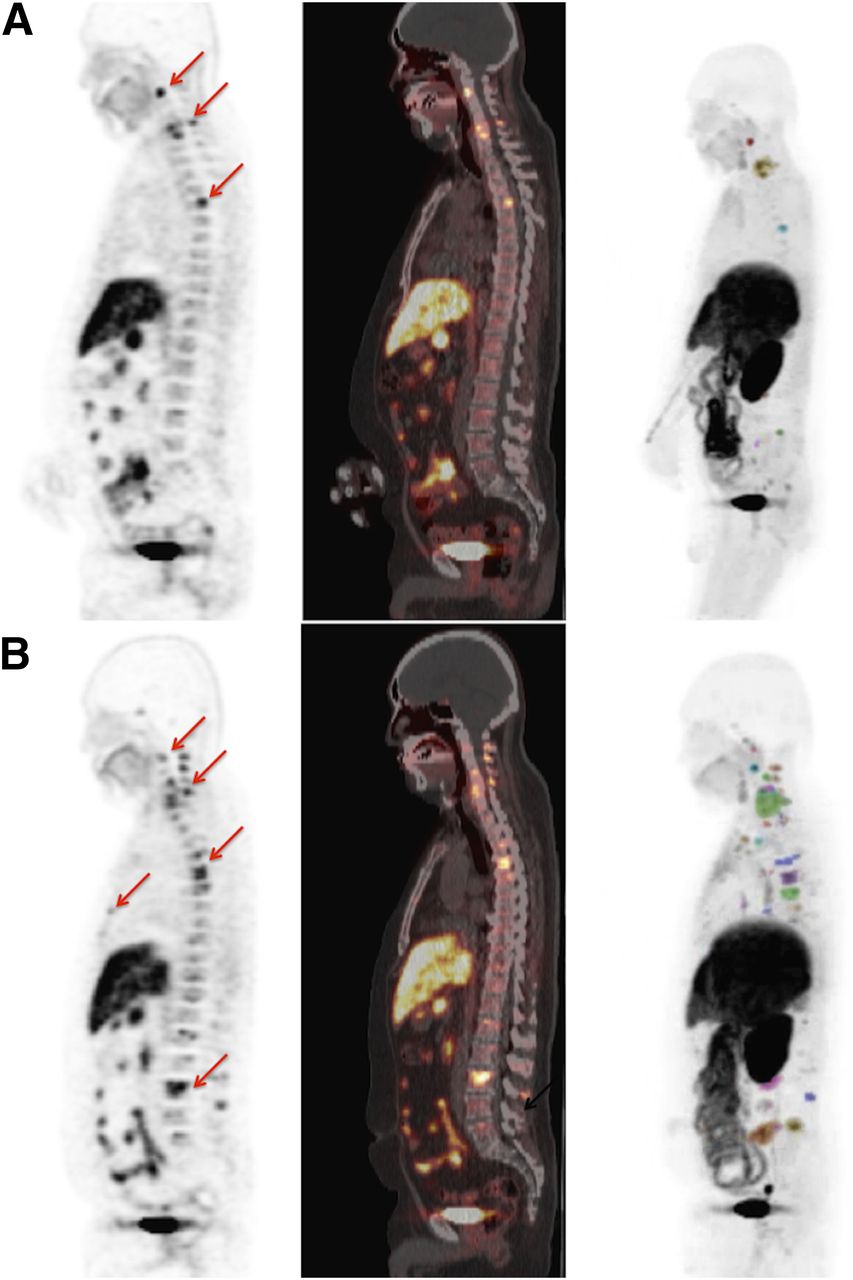
Cancer progression reflected by increasing net MATV as shown on 18F-fluorocholine PET (left), PET/CT (middle), and maximum-intensity-projection (MIP) (right) images from 65-y-old patient receiving sipuleucel-T. Color indicates MATV contours on MIP images. (A) Pretreatment PET/CT shows hyperactive vertebral metastases (arrows; net MATV, 42.9 cm3; PSA, 38.0 ng/mL). (B) PET/CT image obtained 36 d after initiation of treatment demonstrates increasing activity and new lesions in sternum and lumbar spine (arrows; net MATV, 338.4 cm3; PSA, 46.7 ng/mL). PSA level after 4 mo increased to 241.4 ng/mL.

Heterogeneous response as shown on serial 18F-fluorocholine PET (left), PET/CT (middle), and maximum-intensity-projection (MIP) (right) images from 64-y-old patient receiving sipuleucel-T. (A) Pretreatment images show abnormal activity in prostate gland (red contour in upper image). (B) PET/CT images obtained 60 d after start of treatment show significant decline in prostatic activity (arrow in upper image) but new abnormal activity in left iliac lymph node and ilium (red and blue contours in lower image). Net MATV increased from 32.5 to 34.0 cm3, and PSA increased from 35.0 to 47.9 ng/mL. PSA progression was confirmed 3 mo later (65.1 ng/mL). Excreted tracer in right ureter (arrow in lower image of A and yellow contour in lower image of B) was not mistaken for lesion.
Analysis of PSA Progression
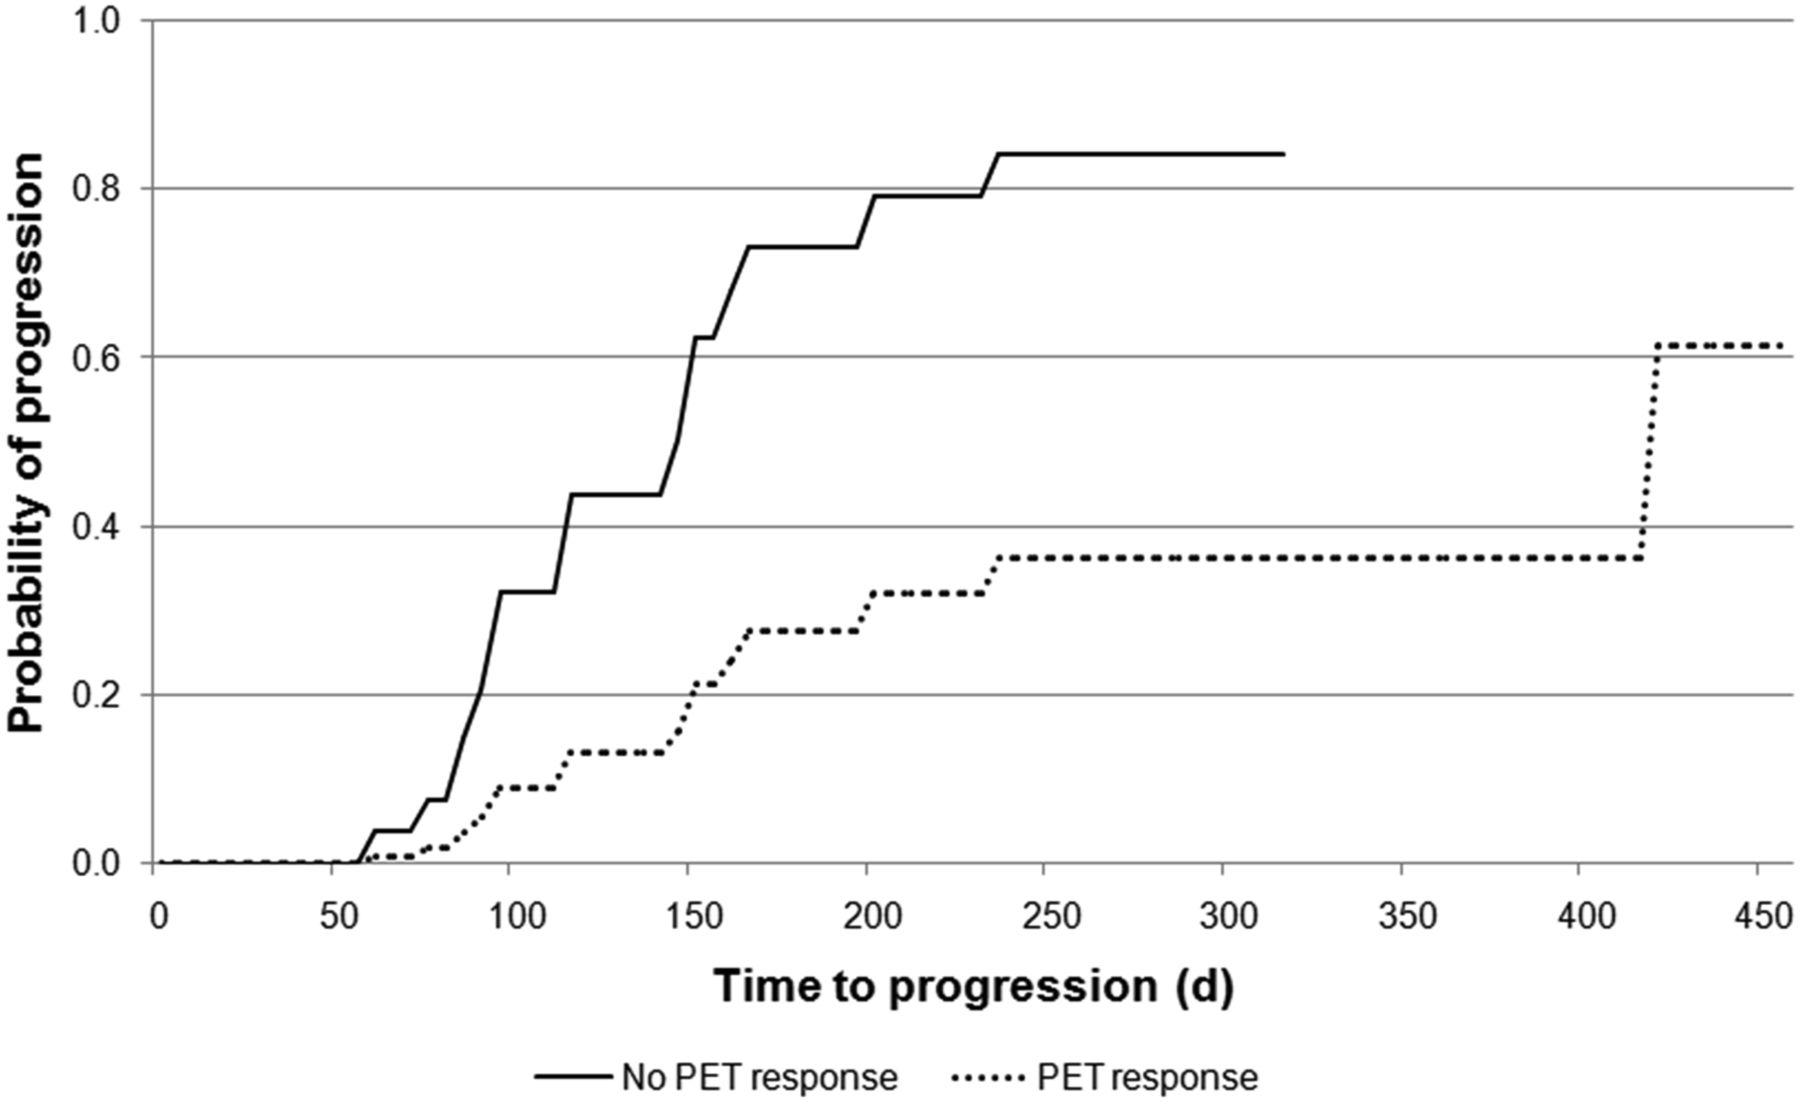
Time to PSA progression differed significantly between patients with and without an MATV response (median, 418 d vs. 116 d, respectively, log-rank P = 0.0067, Wilcoxon P = 0.0138). On univariate analysis, MATV response was associated with a significantly lower risk of PSA progression (hazard ratio, 0.246; P = 0.0113) (Fig. 4), whereas age, baseline PSA level, PSA response, and the distribution of lesions on PET/CT were not significantly associated with PSA progression (Table 3). However, chemotherapy was associated with a relatively lower risk of PSA progression (hazard ratio, 0.309; P = 0.0333), whereas antiandrogen treatment was associated with a relatively higher risk (hazard ratio, 5.650; P = 0.0236). MATV response remained significant as a predictor of PSA progression on multivariate analysis adjusted for treatment type (Table 3).

Probability of PSA progression over time based on MATV response. Median time to PSA progression was 418 d in MATV responders and 116 d in MATV nonresponders. Both early and late differences in time to PSA progression were statistically significant on Kaplan–Meier analysis (Wilcoxon P = 0.0138 and log-rank P = 0.0067).
Proportional Hazards Regression Analysis of Time to PSA Progression
DISCUSSION
Over the past decade, a variety of treatments directed toward different cellular targets and mechanisms has emerged to improve the survival of men with CRPC (2). However, assessing treatment efficacy in CRPC remains a significant clinical challenge (3–5,8). In the present study, whole-body indices of tumor response derived from 18F-fluorocholine PET/CT were evaluated as therapeutic predictors in patients undergoing contemporary management of CRPC. This study found that decreases in net MATV observed early in the course of treatments for CRPC were associated with significantly longer times to PSA progression independently of other clinical characteristics such as the type of treatment given. This observation supports 8F-fluorocholine PET/CT as a potential independent predictor of treatment outcome in CRPC. 18F-fluorocholine has been extensively studied for prostate cancer, and our study contributes to data supporting its usefulness across a variety of clinical applications that require accurate determination of metastatic spread (15). Previous 18F-fluorocholine PET/CT studies of CRPC have documented the significant effect of treatment with antiandrogens and 223Ra on disease pattern (12,16). Our study provides further examples by documenting such effects for docetaxel and sipuleucel-T as well.
Time to PSA progression was the main endpoint of this study for evaluating MATV response because increases in PSA level after the posttreatment nadir (i.e., PSA progression) have proven more reliable in predicting clinical outcomes in CRPC than are acute changes in the PSA level after treatment initiation (i.e., PSA response) (6,17–19). Nonetheless, tumor metabolism depicted by18F-fluorocholine PET/CT was also evaluated in relation to early changes in PSA level. Early changes in PSA level were found to correlate moderately with changes in tumor activity quantified on 18F-fluorocholine PET/CT. These results were comparable to those of a previous study evaluating 11C-choline for measuring therapeutic response to docetaxel in CRPC (20). Like this previous study, our study found that decreases in tumor activity on 18F-fluorocholine PET/CT did not necessarily coincide with decreases in PSA level and, in fact, coincided with increasing PSA levels in some cases (Fig. 1). The limitations of acute PSA changes as a response measure in CRPC have been well described (3,6). For example, acute rises in PSA level (PSA flares) may occur in over 10% of CRPC patients receiving docetaxel and, although not predictive of treatment outcome, can confound decisions on whether to continue treatment (17). Conversely, declines in PSA level may also be misleading, since some treatments can inhibit PSA production independently of their tumoricidal effects (7). Although we show in Figure 1 a case in which PET/CT and PSA measurements proved discordant despite being performed within 24 h of each other, the average interval between in-treatment follow-up PET/CT and follow-up PSA measurements in the present study was 8 d. Therefore, additional studies will be needed to further investigate the treatment-associated changes in tumor metabolic activity underlying fluctuations in PSA production in CRPC.
The present study evaluated indices of treatment response that incorporated every tumor lesion identified on 18F-fluorocholine PET/CT. In contrast, other studies have evaluated predictive indices derived from a fixed number of target lesions (11,21). This latter approach may be simpler and quicker to perform than whole-body tumor assessments. However, because metastases can vary in morphology, immune phenotype, and genotype within the same patient (22), assessments of treatment response reflecting only a limited number of lesions may be misleading. The feasibility and reproducibility of whole-body– and target-lesion–based approaches for assessing treatment response deserve further comparisons in a clinical trial setting.
There are several promising investigational 18F-labeled tracers for prostate cancer imaging on the horizon, such as the prostate-specific membrane antigen ligands and trans-1-amino-3-18F-fluorocyclobutanecarboxylic acid (4,23,24), as well as sodium 18F-fluoride, which is commercially available in many areas (25). Because of the high lesion-to-background uptake ratios associated with these tracers, they should also work for whole-body quantification of tumor burden based on MATV measurements. However, each tracer warrants its own evaluation as a treatment biomarker because the expression of some imaging targets may not necessarily change in response to treatment in a manner consistent with other targets (7). Because one of the most extensively studied PET techniques for prostate cancer imaging is 18F-fluorocholine PET/CT (15), it was a good platform for developing methods to assess tumor response in CRPC using whole-body MATV measurements.
This study, having been performed at a single institution and on a limited number of patients, had certain limitations. MATV calculations were based on voxel SUV measurements and thus depended on the PET scanner calibration, imaging protocol, and image reconstruction method used by the institution. Additional efforts are required not only to validate the concept of quantifying whole-body tumor response with 18F-fluorocholine PET/CT but also to generalize the methods supporting this approach. Furthermore, the fact that our study enrolled patients without regard to treatment type introduced potential treatment-related bias. However, no significant associations between treatment type and clinical parameters were noted (Table 2).
Previously, tumor burden measured on 18F-fluorocholine PET/CT was found to be significantly associated with overall survival in CRPC even after adjustment for treatments administered after the patients were imaged (13). This finding implies either that survival in CRPC patients is influenced largely by the extent of disease to be treated or that individual treatments have a relatively small impact on survival. However, because there are now multiple dissimilar treatments for CRPC that may impact specific manifestations of disease differently, it may be possible to judiciously base treatment selection on an individual patient’s disease pattern in order to compound the survival benefit of sequential treatments. The findings of the present study across the current spectrum of treatments for CRPC suggest that 18F-fluorocholine PET/CT may be able to support such a strategy.
CONCLUSION
In this study, significant changes in whole-body tumor burden measured on 18F-fluorocholine PET/CT early in the course of contemporary treatments for CRPC were found to be predictive of PSA progression. The growing selection of treatments for CRPC and the feasibility of applying 18F-fluorocholine PET/CT for measuring changes in tumor burden after those treatments support further clinical evaluation of this imaging approach in the management of advanced prostate cancer.
DISCLOSURE
The costs of publication of this article were defrayed in part by the payment of page charges. Therefore, and solely to indicate this fact, this article is hereby marked “advertisement” in accordance with 18 USC section 1734. The U.S. National Institutes of Health supported this work under National Cancer Institute grant R21CA139687-02. Patients receiving antiandrogen treatments were enrolled under clinicaltrials.gov study NCT00928174, and all subsequent patients were enrolled under study NCT00928252. Additional funding was provided by Bayer Healthcare to support the enrollment of 223Ra-treated patients through an Investigator-Initiated Studies Program. No other potential conflict of interest relevant to this article was reported.
Footnotes
Published online Feb. 16, 2016.
- © 2016 by the Society of Nuclear Medicine and Molecular Imaging, Inc.
REFERENCES
- Received for publication November 24, 2015.
- Accepted for publication January 26, 2016.


Jump to section
Related Articles
Cited By...
- No citing articles found.