


Abstract
Tumors recruit and reprogram immune cells to support tumor development and spread, the most prominent among them being of monocytic origin such as tumor-associated macrophages (TAM) or myeloid-derived suppressor cells (MDSC). The alarmin S100A8/A9 has been implicated in the induction of TAM and MDSC. We assessed S100A9 as a molecular imaging marker for the activity of tumor-associated immune cells in a syngeneic murine breast cancer model. S100A9 could serve as a surrogate marker for tumor immune crosstalk as a function of malignancy, providing a tool with the potential for both basic research in tumor immunology and clinical stratification of patients. Methods: BALB/c mice were inoculated with murine breast cancer cells of common origin but different metastatic capability. At different times during tumor development, optical imaging was performed using a S100A9-specific probe to visualize activated monocytes. To further explore the impact of tumor-educated monocytes, splenic myeloid cells were isolated from either healthy or tumor-bearing animals and injected into tumor-bearing mice. We analyzed the effect of the cell transfer on immune cell activity and tumor development. Results: We could prove S100A9-driven imaging to sensitively and specifically reflect monocyte activity in primary tumor lesions. The imaging results were corroborated by histology and fluorescence-activated cell sorting analyses. In a prospective experiment, S100A9 imaging proved indicative of the individual tumor growth, with excellent correlation. Moreover, we could show that the monocyte activity as depicted by S100A9 activity in the primary tumor lesion mirrored the tumor's metastatic behavior. Treatment with tumor-primed splenic monocytes induced increased tumor growth, accompanied by an augmented infiltration of activated myeloid cells (MDSC and TAM) into the tumor. The consecutive S100A9 expression as depicted by in vivo imaging was significantly increased. Conclusion: S100A9 proved to be a sensitive and specific marker for the activity of tumor-associated immune cells. To our knowledge, S100A9 imaging represents a first in vivo imaging approach for the estimation of recruitment and activity of tumor-associated myeloid immune cells. We demonstrated the potential value of this imaging approach for prediction of local and systemic tumor development.
The accumulation of activated immune cells in tumors in response to specific tumor signals has been recognized as a crucial driver of carcinogenesis, even marked one of the hallmarks of cancer in the latest edition of Hanahan and Weinberg’s work (1). Among the cells infiltrating the tumor, macrophages and their precursors, monocytes, are the most abundant (2). A tumor-promoting role of so-called tumor-associated macrophages (TAMs) could be demonstrated, with TAM activity as an indicator of poor prognosis and reduced outcome for several types of malignant disease including breast cancer (3,4). TAMs secure tumor survival in various ways: their delivery of vascular endothelial growth factor and other angiogenic factors enhances neoangiogenesis. Their supply of different chemokines creates a tumor-permissive environment, maintained by myeloid-derived suppressor cells (MDSCs), suppressing the antitumor immune response (5) of natural killer and CD8+ cytotoxic T cells (6). Moreover, TAMs have been shown to support tumor growth and spread by degradation of extracellular matrix components and to be essentially involved in the development of metastasis with evidence for TAM action in multiple steps of this process (7).
The alarmin S100A8/A9 heterodimer seems to be a key molecule for TAM and MDSC action. S100A8/A9 is a member of the S100 protein family of calcium-binding proteins and under physiologic circumstances involved in calcium homeostasis and tubulin turnover (8). Secreted by activated phagocytes via a hitherto unknown mechanism, S100A8/A9 induces proinflammatory effects via binding to TLR4 or RAGE regulating migration, activation, and maturation of myeloid immune cells (9). In the tumor microenvironment, S100A8/A9 induces MDSC, promoting tumor-induced immunomodulation (10,11). S100A8/A9 is secreted by monocytes/macrophages (12) early during immigration into the tumor region and consecutive differentiation (13) hence reflecting their respective local activity. Therefore, S100A8/A9 appears to be an attractive target for visualization of monocyte/TAM activity in the tumor microenvironment, indicative of tumor tissue crosstalk.
In a recent publication, the principles of S100A9 imaging were successfully established in various models of inflammation, confirming sensitivity and specificity of the antibody-based tracer aS100A9-Cy5.5 for local changes of monocyte activity (14). On the basis of this experience, we aimed to prove the feasibility to visualize tumor-associated inflammation and assess this approach for estimation of the activity of tumor-educated immune cells in the tumor microenvironment.
MATERIALS AND METHODS
Tracer Synthesis
A polyclonal antibody against murine S100A9, harvested and purified from immunized rabbits in house, was labeled with Cy5.5 (aS100A9-Cy5.5, λ excitation [λex] = 673 nm; λ emission [λem] = 692 nm; GE Healthcare Bio-Sciences Corp.) as described earlier (14). As control for unspecific tracer distribution, rabbit-derived IgG of irrelevant specificity was labeled with Cy5.5 or Cy7 (rabIgG-Cy5.5/Cy7, λex = 747 nm; λem = 774 nm; GE Healthcare Bio-Sciences Corp.) for parallel injection experiments. All tracers were injected intravenously into the tail of mice in amounts of 2 nmol dye (∼100 μg antibody) 24 h before imaging.
Tumor Models
In vivo experiments are summarized in Table 1.
Summary of In Vivo Imaging Experiments
All animal experiments in this study have been approved by the responsible authorities (reference of local government approval AZ 8.87-50.10.36.08.191) and performed according to the regulations set out by the institutional review committees.
Female BALB/c (Charles River Laboratories Deutschland) or S100A9 knock-out mice with genetic BALB/c background (age, 8–12 wk) were used.
Murine breast cancer cell lines 4T1, 168FAR, and 67NR share the genetic background of a common maternal cell line and were used for tumor induction as an established syngeneic model system of graded malignancy (15). Characteristics of the tumor cells are summarized in Table 2. Cells were cultured and harvested according to established protocols (15). Cells (1.5 × 10⁶) in 50 μL of phosphate-buffered saline were implanted into mice either subcutaneously over the flank (experiments I–IV, VI) or orthotopically into the mammary fat pad (experiment V). Tumor size was measured daily.
Characteristics of Murine Breast Cancer Cells
To control for a contribution of the tumor cells to local S100A9 levels and to prove specific tracer to target binding, S100A9−/− mice (16) were inoculated with 4T1 cells accordingly and underwent the same imaging procedure.
All imaging experiments were performed tumor-size-dependent (4–6 mm) to reduce the influence of differences in tumor growth between cell lines or mouse strains (17). For experiment IV, animals were kept after in vivo imaging, and the tumor growth was monitored over the following 8–10 d.
Cell Transfer
From spleen tissue of either healthy or 4T1 tumor–bearing mice (10 d after tumor implantation), CD11b+ cells were isolated using magnetic cell separation and transferred into mice, which were subsequently inoculated with 4T1 tumors (amount of transferred CD11b+ cells, 1 × 10⁶). In the spleens of tumor-bearing animals, this population of myeloid cells/monocytes should contain tumor-educated MDSC (18). Eight days after tumor implantation, all animals underwent S100A9 imaging as described below.
In Vivo Imaging
For in vivo optical imaging, a fluorescence-reflectance imaging (FRI) system (Bruker BioSpin) was used. Excitation light was adapted according to the dyes to 630 nm (Cy5.5) or 730 nm (Cy7), respectively. The resulting emission was recorded at 700 or 790 nm, using a filter-equipped, high-sensitive charge-coupled device camera. Signal acquisition time was 30 s (experiment V, 5 s) for fluorescence images. White-light images were acquired for anatomic orientation.
Fluorescence-mediated tomography (FMT) was used for 3-dimensional visualization of dye distribution in the target region. The free space flat panel FMT device (In-vivo Imaging System FMT 2500 and FMT 2500 Imaging Software, version 1.1.1.3; both Visen Medical) allowed for reconstruction of 3-dimensional data from fluorescence signals at 680 and 750 nm for visualization of Cy5.5 or Cy7 (19,20). Scanning time of the tumor region was around 4 min.
Mice were held under inhalation anesthesia (2.0% isoflurane in air) during examinations.
The region of interest (ROI) was placed to cover the whole tumor area as depicted on white light images. FRI data were presented as mean photon counts, normalized for the ROI area, in arbitrary units (AUs). From each dataset, mean values and SD were calculated.
For experiment VI, scans were performed immediately (0 h) and 24 h after tracer injection. From these values, a Δfluorescence intensity (ΔFI) was calculated as signal from the target ROI at 24 h minus signal from the target ROI at 0 h. After in vivo imaging, animals were sacrificed and organs were harvested for correlative ex vivo examination of dye-distribution using FRI; tumor tissue was harvested for fluorescence-activated cell sorting (FACS) or histology.
Validation Experiments
The resected tumors were divided, and equal amounts of tissue were processed for immunohistochemistry and FACS, respectively. For FACS, single-cell suspensions were produced from tumor tissue and stained for S100A9 and CD11b with corresponding isotype controls.
Monocyte specific staining was performed using an allophycocyanin-labeled ratCD11b antibody (eBioscience) and S100A9-specific staining with a polyclonal S100A9 antibody and fluorescein isothiocyanate–labeled goat-antirabbit secondary antibody (Jackson Immuno Research Europe). Nonspecific rabIgG and allophycocyanin-labeled rabIgG (eBioscience) were used as controls. FACS data were gated according to size and granularity to exclude cell detritus. Isotype controls served for adjusting individual FACS measurements. All FACS measurements were conducted using a FACSCalibur system and analyzed using the CellQuest Pro software (both BD Biosciences). Data were presented as cell frequency reduced by the individual isotype control to exclude unspecific staining.
For histology, tissue was paraffin-embedded and cut. Tumor sections were stained for S100A9 and F4/80 (macrophages) for direct correlation of imaging findings. All stainings were performed according to established protocols (21,22).
Moreover, lysates from resected tumors, tumor cells from tissue culture, and tissue culture supernatant were analyzed for S100A8/A9 using a specific, in-house–established enzyme-linked immunosorbent assay (ELISA) (14,23).
Statistical Analysis
Data were analyzed using the Student t test (experiments I, II, VI), 1-way ANOVA test with Bonferroni post test (experiment V), or linear regression (experiment IV). All analyses were performed using the GraphPad Prism software (version 4.03; GraphPad Software Inc.).
RESULTS
In Vivo Imaging: Proof of Principle
To prove specificity of tracer to target binding and to control for unspecific tracer accumulation (e.g., perfusion-related or FcγR-mediated), 4T1 tumor–bearing mice were injected with aS100A9-Cy5.5 or rabIgG-Cy5.5. A significantly higher signal in FRI was detected after injection of the specific probe than after injection of equal amounts of rabIgG-Cy5.5 (2,430 vs. 1,240 AUs; P < 0.001, n = 16/12). In S100A9−/− mice, injection of aS100A9-Cy5.5 resulted in signals comparable to the rabIgG-Cy5.5–mediated signal in wild-type animals (950 AUs; n = 5) (Figs. 1A and 1B). In ex vivo biodistribution studies, resected organs were analyzed for fluorescence signals and a significantly higher fluorescence in the tumor after injection of aS100A9-Cy5.5 than rabIgG-Cy5.5 could be verified (Supplemental Fig. 1; supplemental materials are available at http://jnm.snmjournals.org). Tumor-to-nontarget tissue ratios (kidneys, muscle) were significantly higher for aS100A9-Cy5.5 (aS100A9-Cy5.5 vs. rabIgG-Cy5.5 tumor to kidney: 3.2 vs. 2.1; P ≤ 0.001; tumor to muscle: 3.76 vs. 2.4; P ≤ 0.05).
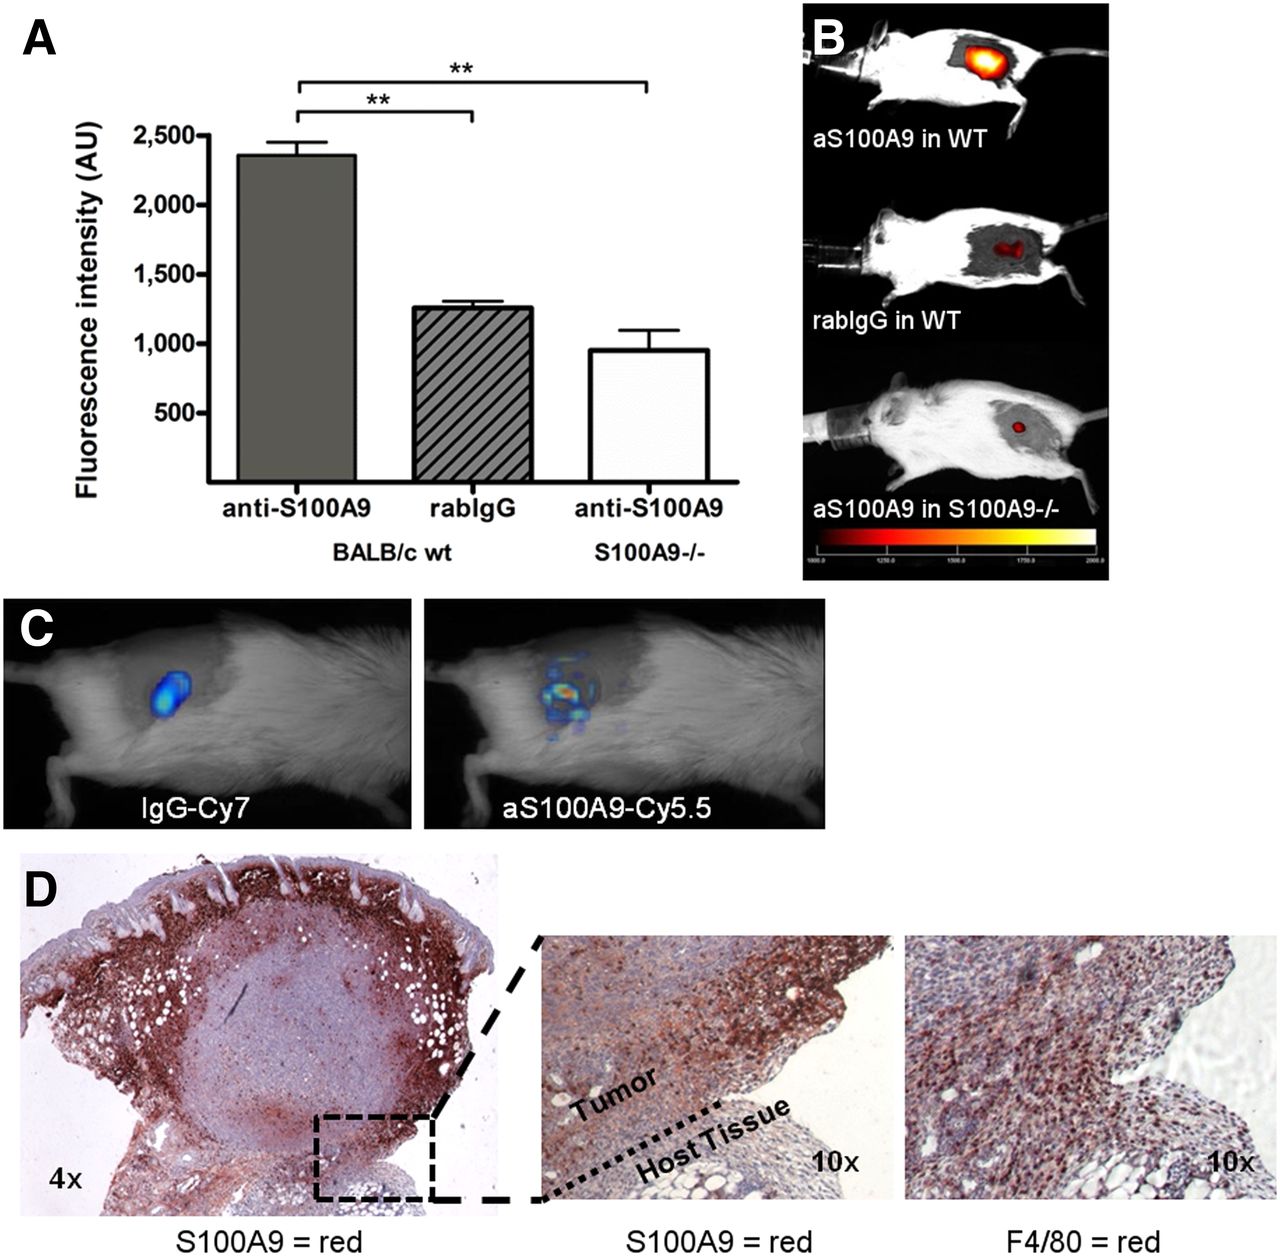
(A and B) S100A9 imaging specifically identifies tumor-associated immune cells. aS100A9-Cy5.5 injection in 4T1 tumor–bearing wild-type (wt) animals results in significantly higher specific fluorescence than unspecific rabIgG-Cy5.5 or injection of specific aS100A9-Cy5.5 in S100A9−/− knock-out mice. (C) FMT after parallel injection of rabIgG-Cy7 and aS100A9-Cy5.5 showed homogeneous distribution of rabIgG-Cy7 in tumor region, reflecting perfusion, whereas aS100A9-Cy5.5 accumulated in delineated regions only. (D) Histology confirmed S100A9+ cells (red) in corresponding, peripheral areas of tumor (left) with F4/80+ TAM detectable within clusters of S100A8/A9+ active monocytes (right).
After parallel injection of aS100A9-Cy5.5 and rabIgG-Cy7, FMT allowed for simultaneous evaluation of the distribution of both tracers. Although rabIgG-Cy7 showed a homogeneous distribution over the whole vital tumor area, aS100A9-Cy5.5 accumulated in delineated hot-spot areas, predominantly located in the periphery of the tumor (Fig. 1C). TAMs within clusters of S100A9+ cells could accordingly be defined by histology (Fig. 1D).
S100A9 Imaging Correlates with Tumor Growth
The development of 4T1 tumors was assessed longitudinally over 10 d, after imaging at an early stage of tumor development (tumor size, <5 mm).
A higher aS100A9-Cy5.5 signal in early FRI and the confirmatory detection of an increased presence of S100A9+ cells on tumor resection were found in fast-growing tumor lesions as compared with lesions with slower development and only mild aS100A9 accumulation (Figs. 2A and 2B). The S100A9 signal strongly correlated with the consecutive individual tumor growth (R2 = 0.86; P < 0.0001, n = 11) (Fig. 2C).

Correlation between tumor growth and S100A9 fluorescence intensity. S100A9 imaging at early time points during tumor development (lesion size < 5 mm; A) shows only low fluorescence signals in animals with subsequently only moderate tumor growth (left). Ex vivo, only few S100A9+ cells (red/brown) could be found in tumor specimens of these animals (B, left). High initial S100A9 signal (A, right) predicted more rapid tumor growth and reflected pronounced infiltration of tumor by S100A9+ cells (B, right). Developmental variation among 4T1 tumor lesions could be predicted by S100A9 imaging, correlating relative growth rate over 10 d, after imaging (C; r2 = 0.86; P < 0.0001; n = 11).
S100A9 Signals Reflect Metastatic Potential
Targeted S100A9 imaging revealed significant differences between the 3 tumor entities, with 4T1 tumors exhibiting the highest aS100A9 accumulation (FRI signal, 427.3 AUs), followed by 168FAR (325.2 AUs) and 67NR (250.8 AUs) (Figs. 3A and 3B). The ex vivo analysis of the tumor immune cell infiltrate revealed the presence of CD11b+ cells in all tumors (Figs. 3C and 3D), with the amount of S100A9+ cells among the immune cell infiltrate confirming the in vivo imaging (4T1, 8.7% of total cell infiltrate; 168FAR, 2.0%; 67NR, 1.2%) and reflecting the specific grade of malignancy (Fig. 3D).
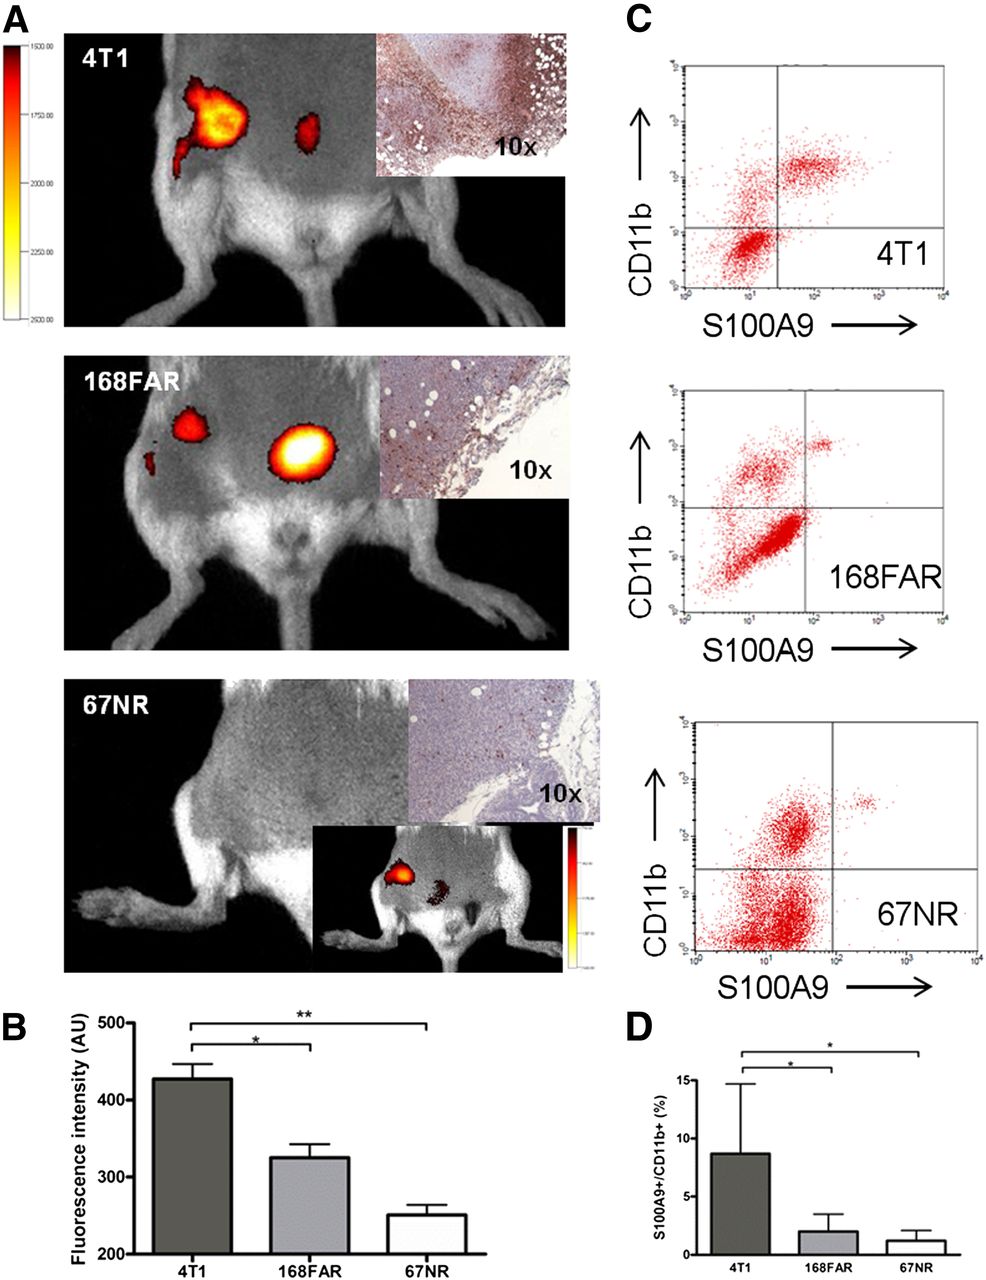
S100A9 imaging reflects metastatic capability. S100A9 in vivo imaging reveals significant differences between tumor entities of different metastatic capabilities (exemplary images in A; corresponding S100A9 histology; data in C). In vivo signal in 67NR tumors was visible only after threshold was reduced (insert). Ex vivo analysis of cellular tumor infiltrate revealed CD11b+ S100A9+ cells in all 3 tumors in amounts, confirming in vivo imaging results (B and D). Individual isotype controls and resulting gating are elaborated in Supplemental Figure 2.
Origin of S100A9 Expression
ELISA of both tissue culture supernatant and cell lysates of the different murine breast cancer cells was negative for S100A8/A9 protein expression, whereas resected tumor samples, comprising tumor cells and the immune cell infiltrate, showed high S100A8/A9 levels. 4T1 tumor samples exhibited significantly higher protein levels than 168FAR or 67NR samples (Table 3).
ELISA Results
To specifically control for expression of S100A9 by tumor cells in vivo, FACS analysis of resected tumor tissue was performed. Tumor samples from 4T1, 168FAR, or 67NR regularly comprised less than 0.1% S100A9+ cells of other than monocytic (CD11b+) origin (Fig. 3C), screening out the presence of S100A9+ tumor cells.
In summary, tumor cells did not exhibit S100A9 protein expression in vitro or in vivo; the S100A9 expression as reflected by specific imaging is virtually exclusively indicative of tumor-associated monocyte/macrophage activity.
MDSC Promote Tumor Growth and S100A9 Expression
CD11b+ cells as an apparent source of S100A9 in the tumor microenvironment were isolated from the spleens of either tumor-bearing (including tumor primed MDSC [tMDSC]) or healthy mice (naïve, immature myeloid cells [IMC]) and transferred into animals, which were thereafter inoculated with 4T1 (schematic representation of the protocol in Supplemental Fig. 3).
The average tumor growth in animals, transferred with tumor primed CD11b+ cells including tMDSC, was significantly accelerated as compared with mice after transfer of monocytes from healthy controls (average relative tumor size on day 8 as compared with day 1 tMDSC vs. IMC: 316% vs. 228%; P = 0.001; Fig. 4A; growth curve in Supplemental Fig. 2). This was also reflected by in vivo imaging: S100A9 fluorescence was significantly higher in mice after transfer of tMDSC and consecutive accelerated tumor development than in the control group (tMDSC vs. IMC: 250.2 vs. 106.6; P < 0.01; Fig. 4B). The treatment with IMC had no significant effect as compared with untreated mice (relative size day 8, 249%; FRI, 98.5).
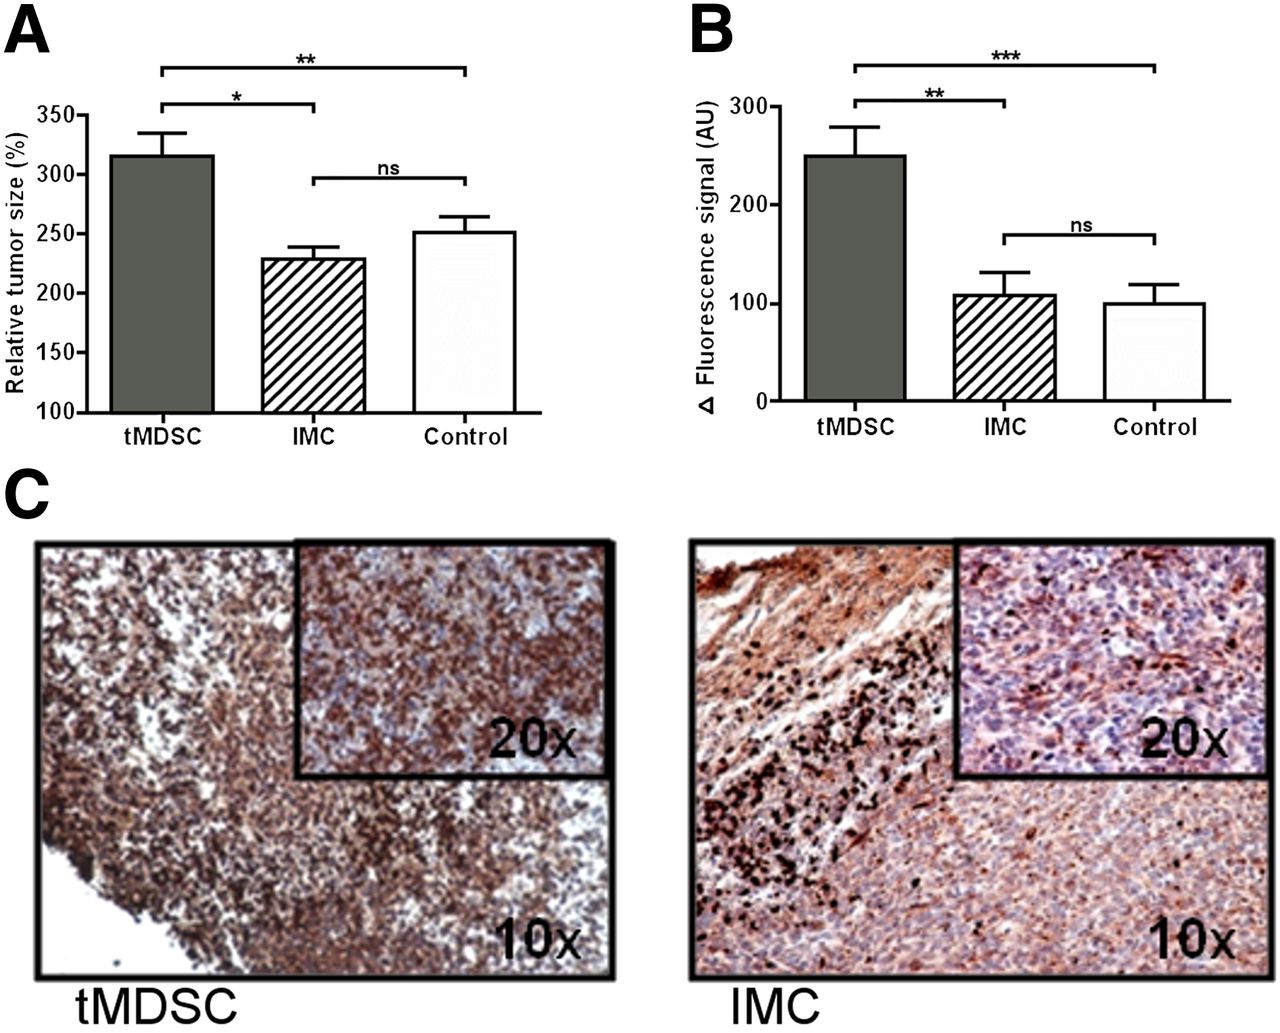
(A) tMDSC promote tumor growth. Splenic monocytes (1 × 10⁶) from either tumor-bearing (tMDSC) or healthy animals (IMC) were injected intravenously into mice, inoculated with 4T1 (scheme in Supplemental Fig. 3). Accelerated growth resulted in relatively increased tumor size (% of size compared with d1) in tMDSC-treated animals. (B) S100A9-specific imaging revealed significantly higher immune cell activity in tMDSC-treated tumors as compared with controls. (C) Immunohistochemistry for S100A9 confirmed increased infiltration of S100A9+ cells into tMDSC-treated tumors as compared with IMC-treated controls.
Ex vivo histology confirmed the in vivo imaging results and revealed a strongly increased infiltration of tMDSC-treated tumors by S100A9+ cells as compared with IMC-treated tumors (Fig. 4C).
DISCUSSION
Tumor-associated immune cells are critical for malignant disease. Numerous studies illustrated immune cells to be supportive of tumor development and spread on the one hand and the interference with the antitumor immune response on the other (24). Tumor immunotherapy, the strategy to inhibit the induction of tumor-promoting immune cells and consecutively increase the host ability to overcome the suppression of an effective antitumor immune response, has been hailed a turning point in cancer therapy (25). Striking results have been reported in patients with advanced, even metastatic disease including lung, renal, prostate, and breast cancer (26). Still, response varies largely among the selected patients, and surrogate markers as to which patient might benefit from the treatment are largely elusive (27,28). This specifically precludes monitoring of immunomodulatory cancer therapy because reliable diagnostic approaches for the determination of the biologic activity within the tumor microenvironment are still missing. For both clinical and preclinical applications, a method for sensitive monitoring of immune cell activity in malignant disease would be highly desirable. In clinical settings, it would enable patient stratification based on tumor-mediated inflammation whereas in preclinical settings it would facilitate further research in tumor biology.
We present an approach for visualization of S100A9+ monocyte activity in the tumor microenvironment as a surrogate marker for tumor-driven immune cell activity and indicator of the tumor ability to establish a supportive environment.
Within cell-tracking studies featuring either iron oxide–mediated MR imaging (29,30) or radionuclide imaging, for example, using 64Cu-liposome labels for PET (31), the abundance of macrophages and other phagocytes in the tumor microenvironment could already be shown. Within this study, we present an approach for visualization of monocyte activity beyond sheer abundance in the primary tumor. With tumor-associated monocytes being discussed as prognostic indicators for tumor development (4,24), this technique could provide valuable information on ongoing tumor/immune cell crosstalk.
S100A8/A9 has been shown to mediate the crosstalk between tumor cells and monocytes, macrophages, and MDSCs (6,32,33). Local release closely reflects the monocyte/phagocyte activity (34), qualifying S100A8/A9 as an imaging target. The principle of S100A9-targeting for sensitive visualization of local monocyte activity in inflammatory processes has recently been established (14).
We now use this approach to address crucial components of the inflammatory tumor microenvironment using S100A9 as a marker for the activity of tumor-associated monocytes.
Although endogenous S100A9 expression has been proposed for several human tumor types (35–37) based on elevated systemic levels (36) and upregulation on the RNA level, expression on the protein level has not been well documented. The systemic levels, reported in human cancer patients and observed in tumor-bearing animals, are in this context also likely to represent activated monocytes. Although further evaluation of this hypothesis will be necessary, we could safely prove that none of the tumor cell lines we used for this study shows measurable S100A9 expression and thus, in these experimental tumor models, measured signals were mediated by tumor-invading monocytes.
The rabIgG-Cy5.5–mediated, unspecific background signal can be attributed to local hyperemia and binding of Fcγ receptor, expressed on resident and invading immune cells (38) as well as, for example, endothelial cells (39). Fcγ receptor expression can equally affect both rabIgG and aS100A9-Cy5.5 accumulation and increase immune cell infiltration via immune complex formation (40). The superiority of aS100A9-Cy5.5 over the unspecific isotype control has been extensively documented (14). In histology, we could detect S100A9 in colocalization with immune cells of monocytic heritage (TAM and MDSC), indicating a mutual relationship as recently suggested (41). Specific sites of monocyte activity could be identified in vivo using S100A9-driven FMT.
It is well established that monocytes, recruited to the tumor, support local tumor growth and invasion (6,17,34,42). In vivo imaging of S100A9 expression allowed for stratification of tumor lesions according to the activity of tumor-associated monocytes. An established supportive microenvironment, reflected by a high S100A9 in vivo imaging signal, favors the consecutive tumor growth as suggested by our results and may be interpreted as an indicator of reduced prognosis.
Monocytes have also been reported to support the first steps toward distant metastasis at primary tumor level (7,43). In a murine model of graded malignancy (15), the different activity of tumor-associated monocytes, potentially supporting the systemic shed of cells from the primary tumor, was reflected by S100A9 imaging.
We artificially increased the number of tumor-primed MDSCs in tumor-bearing animals. In tumor lesions of identical size, the transfer of tumor-educated splenic monocytes including MDSC resulted in an increased recruitment of S100A9+ cells to the tumor and significantly higher S100A9 signal in the tumor and stimulated a more aggressive tumor development in accordance with recent data (6,17). An increase in naive monocytes, however, had virtually no effect on the activity of tumor-associated immune cells as reflected by S100A9 imaging and tumor growth.
Our findings support reports about the crucial importance of tumor-associated monocytes—including MDSC—for tumor development and fit with reports on them mutually promoting their respective activity and accumulation in the tumor (44,45). We could demonstrate that S100A8/A9 expression as measured by in vivo imaging reflects TAM and MDSC abundance and the malignant development in individual tumors and may thus function as a surrogate marker for the tumor’s ability to recruit and activate immune cells to induce a supportive microenvironment.
Future studies will have to elucidate the relevance of S100A9 expression in the context of other tumor models and the potential for S100A8/A9 to serve as a marker for response to immunomodulatory therapy.
CONCLUSION
Optical imaging of S100A9 allows for the estimation of TAM and MDSC activity in tumors and thus for stratification of tumor lesions with regard to local tumor–host interactions and the potential development. For basic research, this technique will offer the opportunity to study the role of TAMs in malignant progression in more detail. With regard to clinical cancer research, the importance of tumor-associated immune cells as promoters of malignant progression and thus as potential targets for diagnostics and therapy is emphasized and a potential route suggested.
DISCLOSURE
The costs of publication of this article were defrayed in part by the payment of page charges. Therefore, and solely to indicate this fact, this article is hereby marked “advertisement” in accordance with 18 USC section 1734. This work has been supported by funding from the Interdisciplinary Center of Clinical Research of the University of Muenster (Vo2/014/09, PIX); the German Research Foundation (DFG) CRC 1009 B8, B9, and EI 878 1-1; the Medical Research Council (MR/L001640/1); and CRUK (C1519/A6906) within the KCL-UCL Comprehensive Cancer Imaging Centre CRUK and EPSRC in association with the MRC and DoH. No other potential conflict of interest relevant to this article was reported.
Acknowledgments
We thank Heike Berheide, Eva Nattkemper, Klaudia Niepagenkemper, Ingrid Otto-Valk, Claudia Terwesten-Solé, and Ina Winkler for excellent technical support. Tumor cells have been kindly provided by Frank Miller, Karmanos Cancer Center.
Footnotes
↵* Contributed equally to this work.
Published online Feb. 12, 2015.
- © 2015 by the Society of Nuclear Medicine and Molecular Imaging, Inc.
REFERENCES
- Received for publication August 4, 2014.
- Accepted for publication January 12, 2015.


