


Abstract
Molecular imaging allows the noninvasive assessment of cancer progression and response to therapy. The aim of this study was to investigate molecular and cellular determinants of 3′-deoxy-3′-18F-fluorothymidine (18F-FLT) PET and diffusion-weighted (DW) MR imaging in lung carcinoma xenografts. Methods: Four lung cancer cell lines (A549, HTB56, EBC1, and H1975) were subcutaneously implanted in nude mice, and growth was followed by caliper measurements. Glucose uptake and tumor proliferation were determined by 18F-FDG and 18F-FLT PET, respectively. T2-weighted MR imaging was performed, and the apparent diffusion coefficient (ADC) was determined by DW MR imaging as an indicator of cell death. Imaging findings were correlated to histology with markers for tumor proliferation (Ki67, 5-bromo-2′-deoxyuridine [BrdU]) and cell death (caspase-3, terminal deoxynucleotidyl transferase-mediated dUTP nick-end labeling). The expression of human equilibrative nucleoside transporter 1 (hENT1), thymidine kinase 1 (TK1), thymidylate synthase, and thymidine phosphorylase (TP) were analyzed by Western blot and immunohistochemistry. Thymidine levels were determined by liquid chromatography–mass spectrometry. Results: Xenografts varied with respect to in vivo growth rates. MR imaging and PET revealed intratumoral heterogeneities, which were confirmed by histology. 18F-FLT uptake differed significantly between tumor lines, with A549 and H1975 demonstrating the highest radiotracer accumulation (A549, 8.5 ± 3.2; HTB56, 4.4 ± 0.7; EBC1, 4.4 ± 1.2; and H1975, 12.1 ± 3.5 maximal percentage injected dose per milliliter). In contrast, differences in 18F-FDG uptake were only marginal. No clear relationship between 18F-FLT accumulation and immunohistochemical markers for tumor proliferation (Ki67, BrdU) as well as hENT1, TK1, or TS expression was detected. However, TP was highly expressed in A549 and H1975 xenografts, which was accompanied by low tumor thymidine concentrations, suggesting that tumor thymidine levels influence 18F-FLT uptake in the tumor models investigated. MR imaging revealed higher ADC values within proliferative regions of H1975 and A549 tumors than in HTB56 and EBC1. These ADC values were negatively correlated with cell density but not directly related to cell death. Conclusion: A direct relationship of 18F-FLT with proliferation or ADC with cell death might be complicated by the interplay of multiple processes at the cellular and physiologic levels in untreated tumors. This issue must be considered when using these imaging modalities in preclinical or clinical settings.
Lung cancer is the most common cause of cancer-related death worldwide (1), with non–small cell lung carcinoma (NSCLC) representing the main type. Interindividual differences in tumors and tumor response to therapy are well recognized (2). The visualization of such disease-specific alterations can be performed by molecular imaging, which also allows for tumor staging and monitoring of therapy response (3). 18F-FDG PET allows assessment of cellular glucose consumption and hence tumor metabolism (4). Numerous studies describe the use of this tracer for staging of cancer (5,6) and monitoring of treatment response (7,8). However, 18F-FDG generally accumulates in metabolically active sites, and discrimination of tumors from inflammatory cells is not always possible (9). Where therapy induces inflammation, the 18F-FDG signal might be stable or even rise in the lesion irrespective of tumor treatment response (10). Such false-positive 18F-FDG PET findings are also known as the flare effect and result in problems with interpretation of imaging findings in clinical oncology (11).
The lack of specificity of 18F-FDG might be overcome by the use of more specific tracers, such as radiolabeled nucleosides. Shields et al. describe a thymidine analog that is capable of tracking cellular proliferation: 3′-deoxy-3′-18F-fluorothymidine (18F-FLT) (12). In several studies, this tracer was shown to be superior to 18F-FDG for the assessment of treatment response, and it also has been demonstrated to be more tumor-specific (13,14).
Another imaging modality used in the field of oncology is MR imaging. Morphologic details can be obtained from T2-weighted (T2w) MR imaging. Diffusion-weighted (DW) MR imaging provides information about tissue ultrastructure by measuring water molecule movement in terms of the apparent diffusion coefficient (ADC). The latter is sensitive to cell death, possibly induced by successful chemotherapy, which results in the loss of membrane integrity and hence increased water diffusivity (15).
Here, we aimed to provide detailed characterization of different human NSCLC cell lines grown as xenografts with respect to their accumulation of the PET tracers 18F-FDG and 18F-FLT. Furthermore, we measured the ADC of these xenografts and correlated our findings with ex vivo analyses. These imaging modalities revealed major differences between the 4 investigated lung tumor models.
MATERIALS AND METHODS
Cell Culture and Animal Model
NSCLC cells were cultured at 37°C in 5% CO2 using Dulbecco modified Eagle medium with 10% fetal calf serum for A549; Dulbecco modified Eagle medium with 10% fetal calf serum, nonessential amino acids, and pyruvate for HTB56; or RPMI medium with 10% fetal calf serum for EBC1 and H1975. All medium was supplemented with penicillin (100 U/mL) and streptomycin (100 μg/mL).
Animal procedures were performed within the multicentered QuIC-ConCePT study in accordance with the German Laws for Animal Protection and were approved by the animal care committee of the local government (North Rhine-Westphalia State Agency for Nature, Environment and Consumer Protection). During the experiments, the general health and body weight of the mice were monitored.
Tumors were generated by subcutaneous injection of 2 × 10⁶ cells in 50 μL of serum-free medium in the shoulder regions of 6- to 8-wk- old female NMRI nude mice (Janvier Labs). Three tumors were inoculated per mouse, and up to 8 mice were used per cell line. Tumor volumes were calculated from digital caliper measurements (volume = π/6 × (L × W2); L = longer diameter and W = shorter diameter). For 5-bromo-2′-deoxyuridine (BrdU) staining, BrdU (50 mg/kg; B5002 [Sigma-Aldrich]) was injected intraperitoneally 2 h before tumor harvesting.
Small-Animal PET Imaging
18F-FDG was produced with radiochemical purities of greater than 95% by the basic hydrolysis approach described elsewhere (16). 18F-FLT was produced with purities of greater than 99% as previously reported (17). Small-animal PET was performed 2 and 4 wk after tumor implantation. Tracer uptake was imaged using the high-resolution quadHIDAC small-animal PET scanner (Oxford Positron Systems (18)). Mice were anesthetized with isoflurane inhalation (2% in oxygen), and temperature was maintained using a heating pad. Radiotracer (10 MBq) was injected intravenously, and images were acquired from 60 to 75 min after injection for 18F-FDG and from 70 to 90 min after injection for 18F-FLT.
Images were analyzed with the software Inveon Research Workplace 3.0 (Siemens Medical Solutions). Three-dimensional volumes of interest were defined over the whole tumors, and representative volumes of interest were drawn in respective reference organs. Radiotracer uptake was calculated as maximal percentage injected dose per milliliter (%IDmax/mL) or as mean percentage injected dose per milliliter (%IDmean/mL). We also calculated tumor-to-muscle ratios ((%IDmax/mL)/(%IDmeanmuscle/mL)) and tumor-to-liver ratios ((%IDmax/mL)/(%IDmeanliver/mL)). Maximum radiotracer uptake was also corrected for mouse weight (standardized uptake value). The outcome of the experiments was not influenced by the mode of analysis. Exemplary %IDmax/mL is presented here. All other data are shown in Supplemental Figure 1 (supplemental materials are available at http://jnm.snmjournals.org).
Small-Animal MR Imaging
At 2 or 4 wk after tumor inoculation, T2w MR images were obtained (9.4 T, Biospec; Bruker) (2-dimensional rapid acquisition with refocusing echoes; repetition time/echo time, 3,600/40 ms; rare factor, 8; field of view, 35 mm; matrix, 256; slice thickness, 1 mm), and the ADC was determined by DW MR imaging (echo-planar imaging–diffusion tensor imaging; repetition time/echo time, 1,000/19 ms; 12 segments; 7 b-values from 0 to 700 s/mm2; matrix, 128; averages, 6; electrocardiogram- and respiration-triggered).
ADC maps were calculated with the software ParaVision 5.1 (Bruker). ImageJ (National Institutes of Health) was used to define representative regions of interest (ROIs) in the viable tumor rim in T2w images and to determine the mean ADC values of these ROIs in the respective ADC maps. One ROI was drawn per MR slice. The results and images of the transverse slices at the biggest tumor diameter are presented here, which allows a direct relation of imaging findings to histology.
Ex Vivo Analyses
Histology, Western blotting, and thymidine analysis are explained in detail in the supplemental materials and methods.
Statistics
The means ± SDs were calculated. Absolute values of the bar charts are listed in Supplemental Table 2. One-way ANOVA statistical analysis was performed using SigmaPlot (Holm–Sidak method; Systat Software Inc.). P values of 0.05 or less were considered statistically significant. To simplify the graphical illustrations, the results of the statistical analysis are presented in Supplemental Table 3.
RESULTS
Variability of Xenograft Growth In Vivo
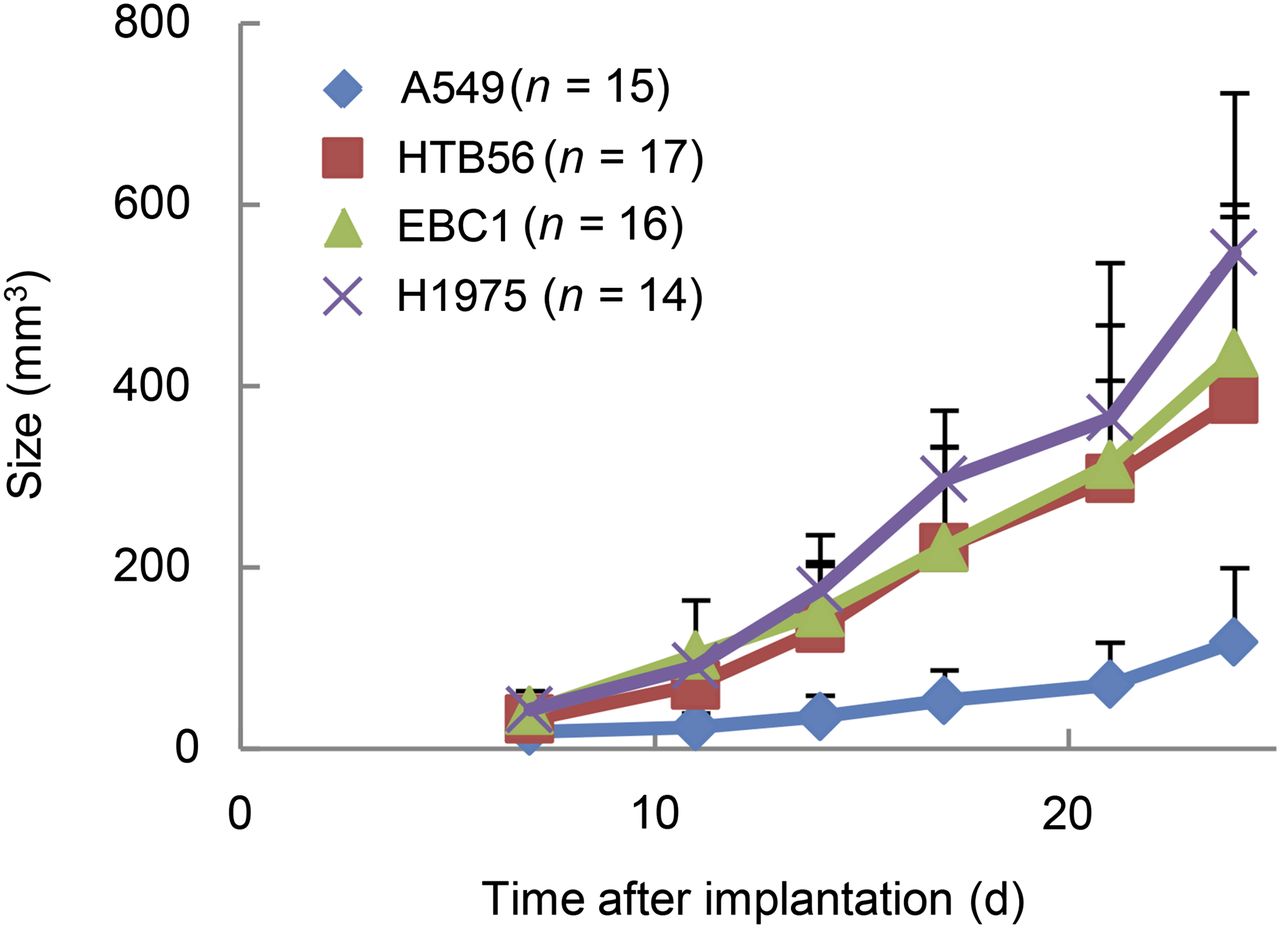
The NSCLC xenografts of HTB56, EBC1, and H1975 showed similar in vivo growth rates, whereas A549 grew more slowly (Fig. 1). Hematoxylin and eosin staining revealed differences in terms of intratumoral heterogeneity and texture between the different xenograft types (Supplemental Fig. 2A). The degree of necrosis varied between different tumors and seemed to depend on tumor size.

NSCLC xenografts differ with respect to growth. Tumor size was determined by caliper measurements. n = number of tumors.
Tumor Type–Dependent Differences of 18F-FLT Uptake as Measured by Small-Animal PET
The accumulation of 18F-FDG and 18F-FLT was assessed in the NSCLC xenografts. Tumors could be delineated on 18F-FDG PET images, but tracer uptake was generally low, irrespective of the cell line (Fig. 2A). In contrast, accumulation of 18F-FLT was pronounced in A549 and H1975 xenografts but relatively low in HTB56 and EBC1 (Fig. 2B). Inhomogeneities within tumors were evident. These were related to the size of the tumors and seem to reflect the presence of necrosis, as indicated by hematoxylin and eosin staining (Supplemental Fig. 2A).
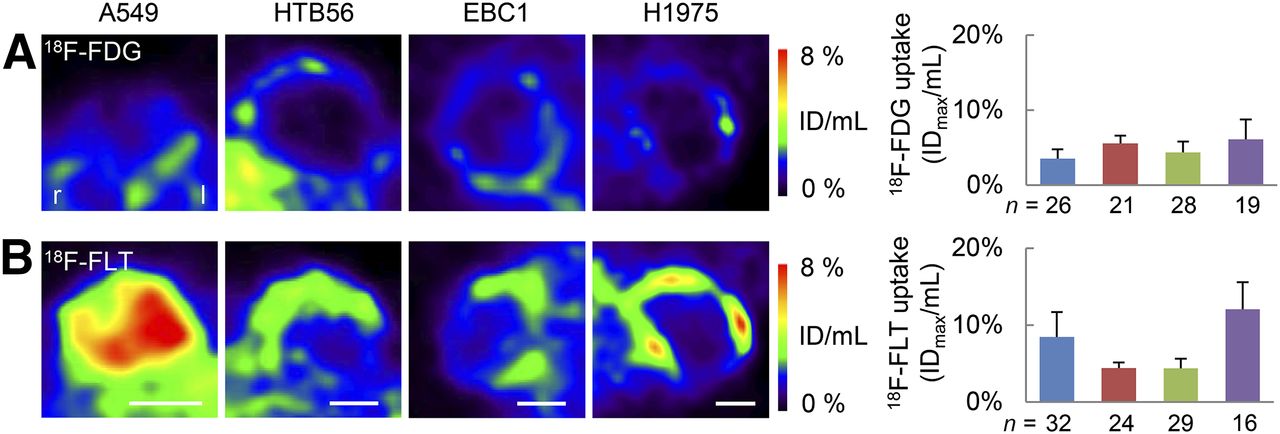
PET imaging of lung cancer xenografts reveals pronounced 18F-FLT uptake in A549 and H1975 xenografts. Transverse slices of 18F-FDG (A) and 18F-FLT (B) PET images at biggest tumor diameter of representative tumors about 4 wk after implantation are shown. Maximum radiotracer uptake of whole tumors was determined. Some tumors were measured several times during their growth (∼2 and 4 wk after implantation). However, no influence of imaging time point was detected, and data were combined in analysis. Blue = A549, red = HTB56, green = EBC1, purple = H1975. n = number of analyses per cell line. Scale bars = 5 mm.
18F-FLT is supposed to be a tracer for proliferation in vivo. Therefore, we wanted to determine whether the A549 and H1975 xenografts showed an increased proliferation in terms of histologic proliferation markers and performed BrdU and Ki67 staining (Fig. 3). However, A549 and H1975 tumors showed significantly lower proliferation indices than HTB56 and EBC1.
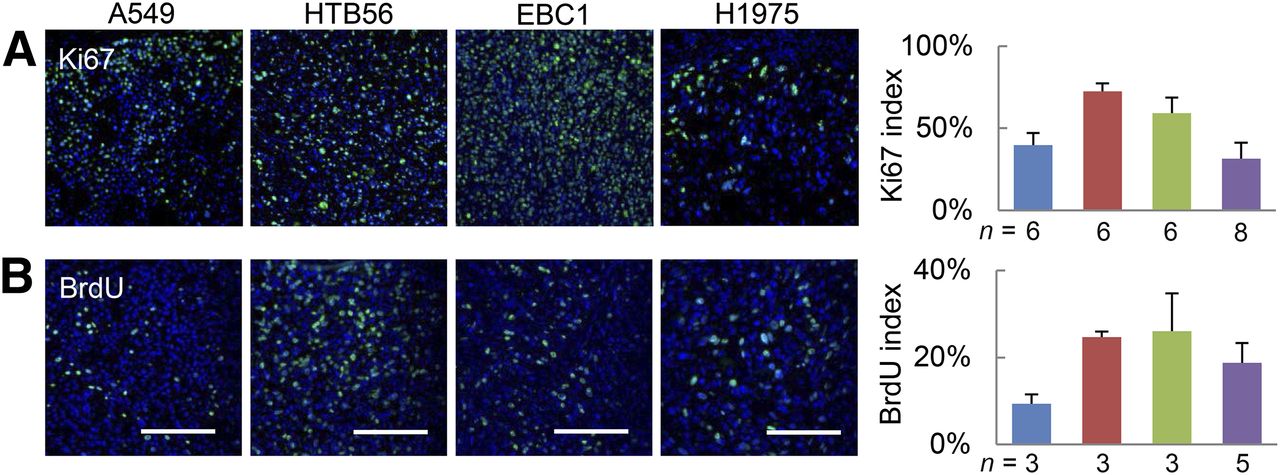
Proliferation as determined by histologic markers does not positively correlate with 18F-FLT uptake. Histologic sections were probed for Ki67 (A) and BrdU (B). Percentage of specifically stained nuclei was quantified in viable tumor regions. Blue = A549, red = HTB56, green = EBC1, purple = H1975. n = number of tumors analyzed (1 section per tumor). Scale bars = 100 μm.
We then measured the expression level of hENT1 (human equilibrative nucleoside transporter 1), the nucleoside transporter that is responsible for most of the 18F-FLT transport across cellular membranes (19). We were unable to detect a high expression of this protein in A549 or H1975 that could elucidate 18F-FLT uptake variances (Fig. 4A). We then investigated 2 important thymidine metabolism proteins: thymidine kinase 1 (TK1) and thymidylate synthase (TS). But no differential expression of TK1 or TS could explain differences in 18F-FLT accumulation (Figs. 4B and 4C).
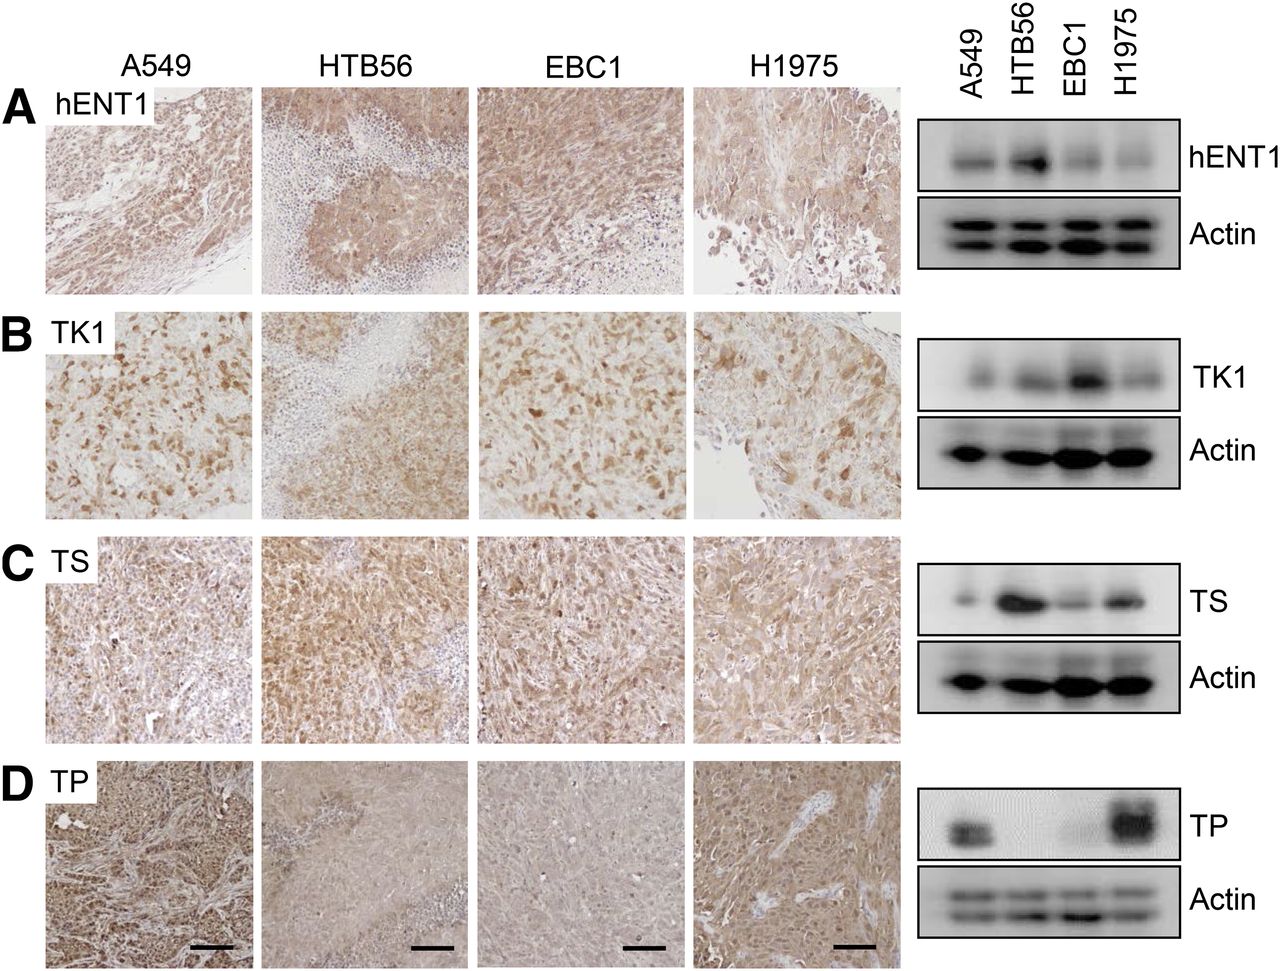
Expression of thymidine metabolism proteins does not account for variations in 18F-FLT uptake, except for TP. Tumor homogenates were analyzed by Western blot for expression of hENT1 (A), TK1 (B), TS (C), or TP (D). Five different xenografts per cell line were examined by this method, and representative blot is shown. Same proteins were also detected by immunohistochemistry. Sections of 4 tumors per cell line were analyzed, and representative figures are depicted here. Scale bars = 100 μm.
Another enzyme involved in thymidine metabolism is thymidine phosphorylase (TP). A pronounced expression of this protein was apparent in A549 and H1975 xenografts (Fig. 4D). In accordance with the high TP expression of A549 and H1975 xenografts these tumors showed rather low levels of thymidine. A significant inverse correlation of thymidine concentration and 18F-FLT uptake could be detected (Fig. 5; Supplemental Fig. 3).
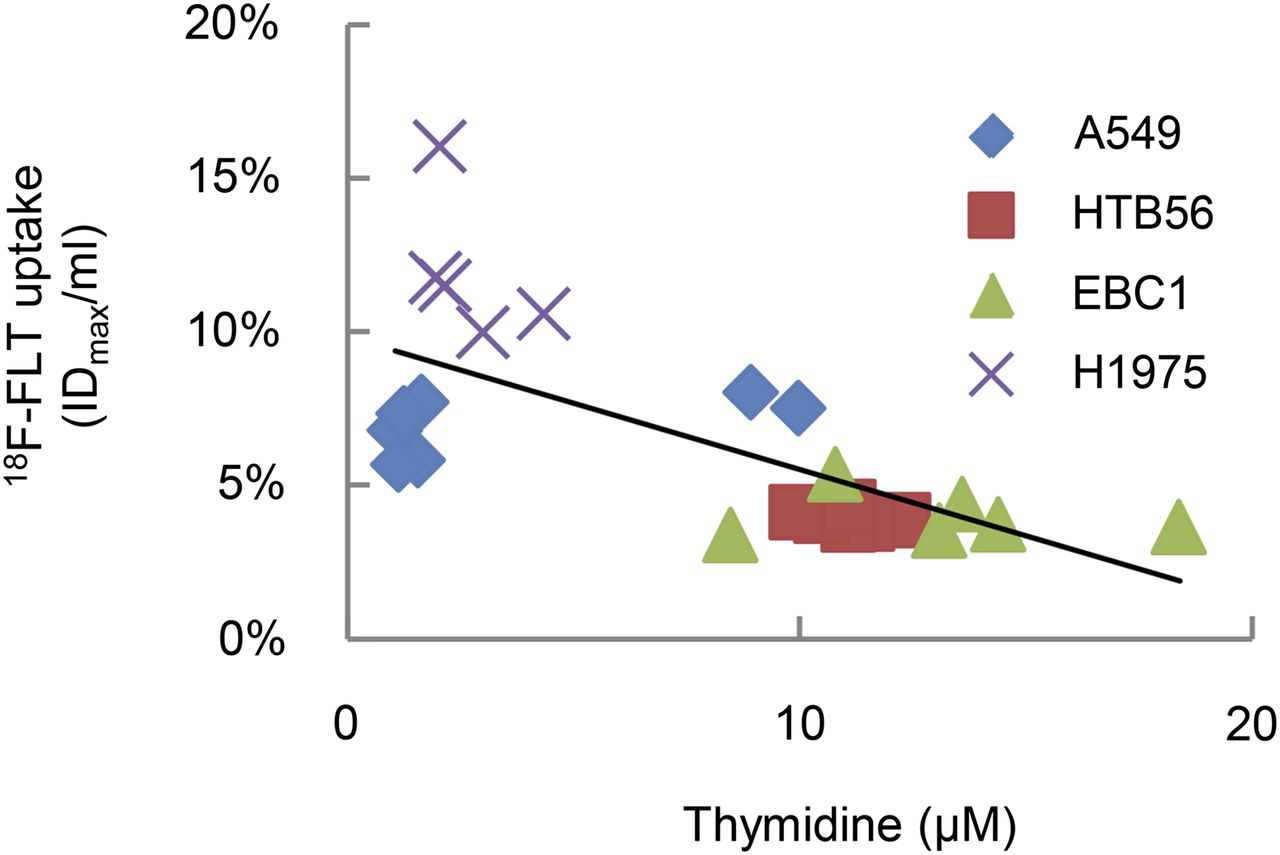
Tumor thymidine negatively correlates with 18F-FLT uptake in lung cancer xenografts. Thymidine levels in tumor homogenates were determined by thymidine-specific liquid chromatography–mass spectrometry. Correlation coefficient = −0.682. P < 0.005.
Tumor Type–Dependent Differences of Diffusivity as Measured by Small-Animal MR Imaging
Lung carcinoma xenografts were also studied by MR imaging. T2w imaging provides information about tumor morphology and edema. It revealed large differences in terms of intratumoral homogeneity between the different xenografts (Supplemental Fig. 2B), which were also apparent in the hematoxylin and eosin staining (Supplemental Fig. 2A). On T2w images, viable tumor tissue at the rim could be discriminated from necrotic regions in the core of the tumors, with the latter having high signal intensities. ADC analysis within the viable area revealed significantly different water diffusivity between the xenografts investigated (Fig. 6; Supplemental Table 3).
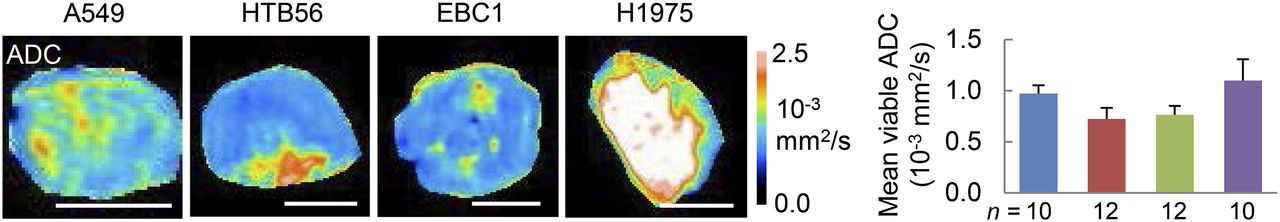
ADC differs between analyzed xenografts. Transverse slices of ADC images are depicted here, and respective T2w images can be found in Supplemental Figure 2B. Viable tumor regions were defined on these T2w images, and mean ADC was quantified within 1 representative ROI in this area. Blue = A549, red = HTB56, green = EBC1, purple = H1975. n = number of analyzed tumors per cell line. Scale bars = 5 mm.
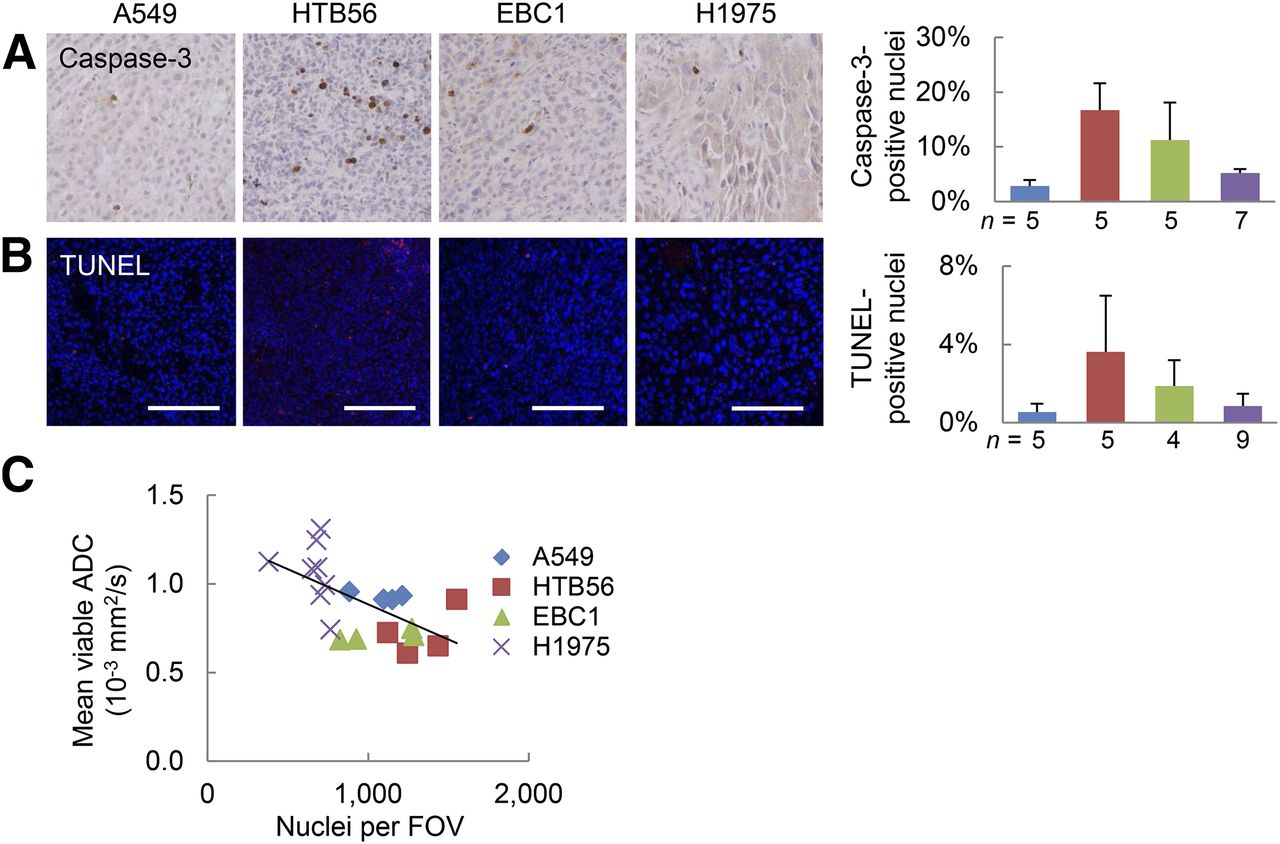
Histologic sections were analyzed for apoptosis (caspase-3) and cell death (terminal deoxynucleotidyl transferase-mediated dUTP nick-end labeling [TUNEL]) (Figs. 7A and 7B). Increased water diffusivity in the viable rim regions of A549 and H1975 were not related to cell death, but a significant negative correlation of ADC values with cell density was found (Fig. 7C; Supplemental Fig. 4).

ADC in various lung cancer xenografts is not related to cell death but negatively correlates with cell density. Histologic sections were analyzed for active caspase-3 (A) and TUNEL (B). Representative images of viable tumor regions and respective quantifications are shown here. Scale bars = 100 μm. (C) Number of 4′,6-diamidino-2-phenylindole (DAPI)–stained nuclei per field of view (field of view [FOV], 20× resolution; 580 × 460 μm) was determined as measure for cellular density. Transverse sections at biggest tumor diameter were investigated to directly relate findings to respective MR slices. Correlation coefficient = −0.61; P < 0.005; n = number of tumors analyzed. blue = A549, red = HTB56, green = EBC1, purple = H1975.
DISCUSSION
PET and MR imaging allow the assessment of heterogeneities of biologic activities between different tumors, as reported here for 4 human lung carcinoma models. We described 18F-FLT uptake in H1975 and A549 tumors that was high, and it was related to elevated TP expression and, hence, reduced tumor thymidine levels. With DW MR imaging, we demonstrated that high ADC values correlated with low cellular density of tumors but were not related to cell death.
18F-FDG PET is routinely used in the clinical setting for detection and staging of cancers. In our study, all NSCLC xenografts were visible on 18F-FDG PET images (Fig. 2A), without major differences in radiotracer uptake between different tumor types. This finding indicates that the glucose utilization of these xenografts was in a similar range and that 18F-FDG PET alone is not able to distinguish differences between the various tumor types.
On the other hand, uptake of 18F-FLT varied significantly between the xenografts tested, with A549 and H1975 demonstrating a pronounced accumulation (Fig. 2B). However, tumor growth as an indicator of proliferation was not faster in these xenografts than in the other lines tested. Indeed, the A549 xenografts showed a slow growth rate in vivo (Fig. 1). And also histologic proliferation markers were not elevated in A549 and H1975 tumors. We stained for Ki67, which is expressed in active phases of the cell cycle (20). A positive correlation of Ki67 with 18F-FLT has been shown for several tumors, including breast, brain, and lung (21), but the use of Ki67 as a proliferation marker has also been challenged because it labels all phases of the cell cycle except for G0. The proliferation marker BrdU is a thymidine analog that is incorporated into DNA and can be detected by specific antibodies. Consequently, it is more specific for the S phase and supposedly correlates better with 18F-FLT (22). In accordance with its cell cycle specificity the Ki67 index was higher than the BrdU index in the tumors tested (Fig. 3). However, no positive correlation of Ki67 or BrdU staining with 18F-FLT uptake was apparent, in accordance with reports showing that 18F-FLT accumulation does not necessarily correlate with Ki67 staining and should not be regarded as a straightforward indicator for proliferation (23,24).
We sought other possible explanations for differences in 18F-FLT uptake. hENT1 seems to be of major importance for the transport of this biomarker, and its expression has been reported to correlate with 18F-FLT retention (19,25). However, we could not detect such a correlation (Fig. 4A) in our model systems.
We then investigated hallmark enzymes of thymidine metabolism: TK1 for the salvage pathway and TS for the de novo pathway. The balance between those 2 pathways has been described to be one of the major determinants for 18F-FLT accumulation because it depends on salvage pathway activity (23,26). Numerous reports describe a close correlation of 18F-FLT uptake and expression of TK1 (23,27,28). Therefore, we analyzed the expression of TS and TK1, but we were unable to detect any relationship between tracer uptake and expression of these proteins in our 4 investigated tumors. However, immunohistochemistry and Western blot are only able to detect the expression of a specific protein and do not inform on the activity of the respective enzyme or transporter.
Van Waarde et al. reported that 18F-FLT uptake can be boosted by TP injection (9). TP degrades thymidine, but 18F-FLT is resistant to catabolism by this enzyme (29,30). This protein is highly expressed in a variety of tumors including NSCLC and has proangiogenic and antiapoptotic properties (31). Here, we showed that TP was highly expressed in A549 and H1975 xenografts (Fig. 4D). We demonstrated that high levels of TP in A549 and H1975 xenografts were accompanied by low thymidine levels within the tumors (Supplemental Fig. 3). Competition of endogenous thymidine and 18F-FLT for binding to nucleoside transporters or the catalytic site of TK1 has been described before (22,32). Indeed, we showed a significant negative correlation of tumor thymidine level with 18F-FLT uptake (Fig. 5). Hence, we demonstrated that high 18F-FLT accumulation and low tumor thymidine level can be directly related to TP expression, at least in our model xenografts. One can speculate that TP expression (i.e., the rate of thymidine catabolism) might not be the only determinant of thymidine concentration. It appears that the 2 tumors with lower 18F-FLT uptake and high thymidine levels (HTB56 and EBC1) show not only the lowest levels of TP expression (Fig. 4D) but also the highest level of caspase-3- (Fig. 7A) and TUNEL-positive nuclei (Fig. 7B). Therefore, it is possible that tumor thymidine levels depend not only on TP expression, but also on the level of cell death in the tumor, which in turn may lead to more thymidine being released from cytosolic pools and from the DNA of dying cells.
One critical issue associated with using 18F-FLT in mice is that the level of thymidine in the blood is about 10-fold higher than that of humans (about 1.0 vs. 0.1 μM). Hence, it is not clear how a relation of 18F-FLT to TP and thymidine might be seen in the clinical situation. It could be altered by the lower thymidine level in the blood of humans. It might also depend on how variable levels of TP are in a given type of human tumors. Detailed knowledge about 18F-FLT uptake determinants such as thymidine and TP will have major implications when interpreting differences of 18F-FLT imaging data in patients at baseline. However, these determinants might not affect the role of 18F-FLT as a valuable tracer to monitor changes in proliferation as a result of successful tumor therapy.
Moreover, we used DW MR imaging to measure ADC to probe tumor tissue ultrastructure. We showed that the ADC in viable tumor regions can vary irrespective of cell death. Cellular densities differed between the xenografts and were negatively correlated with the respective ADCs in the 4 NSCLC models (Fig. 7). Such an inverse correlation of ADC with cellularity and a relation to tumor grade has been shown previously for lung cancer (33) and brain tumors (34,35). But even though factors other than cell death influence tissue ultrastructure and hence ADC, DW MR imaging can still be used for the detection of cell death in tumor therapy follow-up, when variances at baseline are taken into account. Whether DW MR imaging findings are spatially related to 18F-FLT uptake is the subject of ongoing research and requires high-level analyses of coregistered voxel-based comparisons of the 2 imaging biomarkers.
Both imaging modalities, PET and MR imaging, are capable of visualizing heterogeneities within tumors. Most radiotracers do not accumulate within necrotic centers and both water diffusion and signal intensity of T2w images are increased in these regions. Inhomogeneities can also be seen on histologic staining. All these findings were confirmed in this study. These heterogeneities contribute to complications in tumor therapy (36). Hence, not only interindividual but also intraindividual differences within tumors will complicate the care of tumor patients.
This study may also help in selecting the right cell line for a certain experimental paradigm, for example, when aiming to follow lung carcinoma therapy by 18F-FLT PET it is advisable to choose A549 or H1975, because these 2 cell lines accumulate 18F-FLT at baseline and a potential reduction of proliferation in terms of uptake of this tracer could be shown.
CONCLUSION
Lung carcinoma xenografts vary with respect to tumor biology as determined by PET and MR imaging. In the 4 cell lines investigated, we showed that baseline 18F-FLT uptake is not a biomarker for cellular proliferation per se and that it can be compromised by high levels of tumor thymidine. The latter can be negatively regulated by TP. Furthermore, high water diffusivity as measured by DW MR imaging does not necessarily reflect cell death but may indicate low cellular density. Differences in baseline imaging parameters are of major importance when using molecular imaging as an indicator for therapy response.
DISCLOSURE
The costs of publication of this article were defrayed in part by the payment of page charges. Therefore, and solely to indicate this fact, this article is hereby marked “advertisement” in accordance with 18 USC section 1734. This work was supported by the EU FP7 and EFPIA funded Innovative Medicine Initiative Joint Undertaking project QuIC-ConCePT (grant agreement 115151) and the Interdisciplinary Centre for Clinical Research (IZKF, core unit PIX), Münster, Germany. No other potential conflict of interest relevant to this article was reported.
Acknowledgments
We acknowledge Christine Bätza, Melanie Becker, Florian Breuer, Claudia Gräf, Irmgard Hoppe, Sarah Köster, Christa Möllmann, Roman Priebe, and Dirk Reinhardt for excellent technical assistance. We also thank Caius Radu (Los Angeles, California) for stimulating discussions.
Footnotes
Published online Apr. 28, 2014.
- © 2014 by the Society of Nuclear Medicine and Molecular Imaging, Inc.
REFERENCES
- Received for publication December 14, 2013.
- Accepted for publication February 15, 2014.


Jump to section
Related Articles
Cited By...
- Thymidine Metabolism as a Confounding Factor for 3'-Deoxy-3'-18F-Fluorothymidine Uptake After Therapy in a Colorectal Cancer Model
- Preclinical Evidence That 3'-Deoxy-3'-[18F]Fluorothymidine PET Can Visualize Recovery of Hematopoiesis after Gemcitabine Chemotherapy
- Gemcitabine Mechanism of Action Confounds Early Assessment of Treatment Response by 3'-Deoxy-3'-[18F]Fluorothymidine in Preclinical Models of Lung Cancer