


Abstract
Noninvasive monitoring of tumor therapy response helps in developing personalized treatment strategies. Here, we performed sequential PET and diffusion-weighted MRI to evaluate changes induced by a FOLFOX-like combination chemotherapy in colorectal cancer xenografts, to identify the cellular and molecular determinants of these imaging biomarkers. Methods: Tumor-bearing CD1 nude mice, engrafted with FOLFOX-sensitive Colo205 colorectal cancer xenografts, were treated with FOLFOX (5-fluorouracil, leucovorin, and oxaliplatin) weekly. On days 1, 2, 6, 9, and 13 of therapy, tumors were assessed by in vivo imaging and ex vivo analyses. In addition, HCT116 xenografts, which did not respond to the FOLFOX treatment, were imaged on day 1 of therapy. Results: In Colo205 xenografts, FOLFOX induced a profound increase in uptake of the proliferation PET tracer 3′-deoxy-3′-18F-fluorothymidine (18F-FLT) accompanied by increases in markers for proliferation (Ki-67, thymidine kinase 1) and for activated DNA damage response (γH2AX), whereas the effect on cell death was minimal. Because tracer uptake was unaltered in the HCT116 model, these changes appear to be specific for tumor response. Conclusion: We demonstrated that 18F-FLT PET can noninvasively monitor cancer treatment–induced molecular alterations, including thymidine metabolism and DNA damage response. The cellular or imaging changes may not, however, be directly related to therapy response as assessed by volumetric measurements.
Colorectal cancer (CRC) is the third most common cancer and the fourth most common cause of cancer-related deaths worldwide (1). FOLFOX, the combination of oxaliplatin, 5-fluorouracil (5-FU), and leucovorin (folinic acid), is a frequently used therapy for CRC. The active metabolites of 5-FU disrupt RNA synthesis and inhibit thymidylate synthase (TS), an enzyme important for DNA synthesis. This TS inhibitory activity can be enhanced by leucovorin (2). The combination of these 2 agents has been shown to be superior to therapy with 5-FU alone in patients with advanced CRC (3). Oxaliplatin is a third-generation platinum analog, inducing DNA intra- and interstrand crosslinks, which ultimately result in cell death (4). The addition of oxaliplatin to the combination of 5-FU and leucovorin is beneficial to outcome—for instance, in the adjuvant (5) setting.
Molecular imaging can aid in early and noninvasive identification of patients not responding to therapy, allowing an early change in treatment approach. This not only reduces unnecessary side effects for the patient but also allows for early definition of effective treatment. PET with 18F-FDG is routinely used in the clinic for tumor therapy follow-up. A drawback of 18F-FDG is its accumulation in inflammatory lesions (6). The proliferation tracer 3′-deoxy-3′-18F-fluorothymidine (18F-FLT), a thymidine analog, performs better than 18F-FDG with regard to selectivity and has already been successfully used for monitoring tumor response to therapy in a range of preclinical and clinical studies (7,8). 18F-FLT is phosphorylated by thymidine kinase 1 (TK1) and retained within proliferative cells. Therefore, uptake of 18F-FLT reflects the thymidine salvage pathway (9), an alternative thymidine-to-DNA pathway to the de novo pathway, with the key enzyme TS. Thymidine phosphorylase (TP) affects 18F-FLT uptake by degrading thymidine, whereas 18F-FLT is resistant to the activity of this enzyme (10). It is well recognized that thymidine competes with 18F-FLT for cellular retention (11) and that this competition can be modified by TP (12,13). Moreover, TP activity plays a role in tumor angiogenesis, induces metastasis, and protects cancer cells against apoptosis (14).
Another method for noninvasive monitoring of response to therapy is diffusion-weighted MRI. Tumor cell killing as a consequence of successful therapy results in increased intercellular space and hence enhanced water diffusion, measured as an increase in the apparent diffusion coefficient (ADC) (15).
Here, we used CRC models treated with a FOLFOX-like combination therapy, which we refer to as FOLFOX. We evaluated changes in uptake of the radiotracers 18F-FLT and 18F-FDG, as well as in ADC measured by diffusion-weighted MRI, and analyzed associated alterations within the tumors on a cellular level. This will allow a better understanding of tumor biology and factors affecting imaging biomarkers, paving the way for improved cancer therapy in the clinical setting.
MATERIALS AND METHODS
Animal Model
Colo205 and HCT116 cells were cultivated in Dulbecco modified Eagle medium and RPMI medium, respectively, supplemented with 10% fetal calf serum, penicillin (100 U/mL), and streptomycin (100 μg/mL). Animal procedures were performed in accordance with the German Laws for Animal Protection and were approved by the animal care committee of the local government (North Rhine-Westphalia State Agency for Nature, Environment, and Consumer Protection). Female CD1 nude mice 6–8 wk old (Charles River Laboratories) received a subcutaneous injection of 5 × 10⁶ Colo205 or 2 × 10⁶ HCT116 cells into the shoulder region. Two tumors were inoculated per animal, and growth was followed by digital caliper measurements (volume = ½ (length × width2)).
Animals were assigned randomly to groups. FOLFOX therapy was applied weekly. The treatment was started with intraperitoneal oxaliplatin (8 mg/kg) followed by retrobulbar leucovorin 1.5 h later (90 mg/kg) and 2 intraperitoneal doses of 5-FU (30 mg/kg at 2 h and 6 h after treatment initiation). All agents were obtained from the pharmacy of the University Hospital of Münster. Control animals were injected with the respective solvents at the same time points. 5-FU therapy consisted of 2 doses of 5-FU only (30 mg/kg each, given 4 h apart). The experimental schedule is presented in Supplemental Table 1 (supplemental materials are available at http://jnm.snmjournals.org).
18F-FLT and 18F-FDG PET Imaging and Analysis
18F-FLT was synthesized as reported previously (16). A 10-MBq dose of tracer was injected into isoflurane-anesthetized mice. Imaging was performed 70–90 min afterward using a quadHIDAC PET device (Oxford Positron Systems). A multimodal bed was used to transfer the animal to a Bruker MR tomograph for diffusion-weighted MRI during the tracer uptake period or to a CT scanner (Inveon; Siemens Medical Solutions) after completion of the PET scan.
18F-FDG was synthesized according to a previously published report (17). A 10-MBq dose of tracer was injected into anaesthetized nonfasting mice. 18F-FDG PET images were acquired 60–75 min after tracer application using a small-animal PET/MRI device (nanoScan PET/MRI; Mediso Medical Imaging Systems), and the integrated 1-T MR tomograph was used to acquire respective morphologic information (T1-weighted imaging; repetition/echo time, 17.1/3.8 ms; field of view, 100 mm; slice thickness, 0.5 mm; 400 matrix).
Volumes of interest were drawn manually on anatomic images and transferred to the respective PET images using MEDgical, an in-house–developed software for multimodal data analysis. The whole tumor was defined by the volume of interest, and tracer uptake was expressed as SUVmax. The data confirmed that the results and conclusions were not dependent on the method of analysis.
Diffusion-Weighted MRI
A Bruker Biospec 9.4-T tomograph was used to obtain data on water diffusion. T2-weighted images were acquired first (2-dimensional rapid acquisition with relaxation enhancement; repetition/echo time, 3,600/40 ms; rapid-acquisition-with-relaxation-enhancement factor, 8; field of view, 35 mm; 256 matrix; slice thickness, 1 mm; 4 slices per tumor at the largest tumor diameter), followed by diffusion-weighted images (echo planar imaging–diffusion tensor imaging; repetition/echo time, 1,000/19 ms; 12 segments; 7 b-values from 0 to 700 s/mm2; 128 matrix; number of excitations, 6; respiration-triggered). ADC values were analyzed with the software Beaugui developed at INSERM. ADC maps were calculated on a pixel-by-pixel basis using this software based on ROOT (version 5.34.01; CERN). The ADC was calculated by fitting the normalized signal intensity to a classic monoexponential model (cutoff > 150 s/mm2), using a nonlinear least-squares approach with a Levenberg–Marquardt algorithm. Tumor regions of interest were defined manually on the b = 0 images and then copied onto the ADC maps to determine ADCmean.
Immunohistochemistry
Formalin-fixed tumor tissue was embedded in paraffin, and 2.5-μm sections were analyzed. Hematoxylin and eosin staining was performed on an automated Symphony system (Ventana Medical Systems) using reagents from Ventana Medical Systems. Immunohistochemistry for Ki-67 was performed on a Discovery XT automated stainer (Ventana Medical Systems) using Ventana Medical Systems reagents. After mild treatment with tris-based cell conditioning 1, we applied Confirm anti–Ki-67 (clone 30-9) rabbit monoclonal antibody (ready-to-use dispenser, catalog no. 790-4286; Ventana Medical Systems). Positive immunoreactivity was detected with an OmniMap detection system (Ventana Medical Systems).
The slides were scanned at ×20 using an iScan HT device (Ventana Medical Systems), and the digital images were analyzed using automated analysis algorithms from the Roche digital pathology platform Iris. The whole process was supervised by an expert pathologist, who controlled the quality of the algorithm performance. Annotation of tumor area on the hematoxylin and eosin slide by the pathologist was followed by automated segmentation into tumor and necrosis areas. Image registration of the hematoxylin and eosin slide and the consecutive Ki-67 slide was performed, and viable tumor area was transferred onto the Ki-67 slide. Automatic classification into Ki-67–positive tumor nuclei and Ki-67–negative nuclei resulted in reporting of Ki-67–positive and –negative tumor nuclei and analyzed area, cellularity (tumor nuclei per area), and percentage Ki-67 positivity of tumor nuclei. Heat maps of the density of Ki-67–positive nuclei are shown for visualization.
For all further immunohistochemistry, 5-μm sections were incubated overnight at 4°C with the primary antibody (1:200 TK1 [EPR3193; Abcam]; 1:100 active caspase-3 [CPP32; BD Pharmingen]; or 1:100 γH2AX [catalog no. 9718; Cell Signaling Technology]). Cell death was detected by a commercially available kit (in situ TUNEL kit assay; Roche). Images were acquired using an Eclipse 90i microscope (Nikon) and the NIS-Elements software package (Nikon). Positively stained areas in regions of viable tumor tissue were determined on 5–8 images (×20) per tumor with the software ImageJ (National Institutes of Health).
Thymidine Analysis
Thymidine in tumors and plasma was quantified as described previously (18).
Western Blot Analysis
Tumor tissue was lysed in radioimmunoprecipitation assay buffer with a Precellys 24 homogenizer/lysing kit (1.4 mm ceramic beads; Bertin Instruments). Polyacrylamide gel electrophoresis was performed with 4%–15% Mini-Protean TGX Precast Gels (BioRad), 15-well. After transfer to a Trans-Blot Turbo Midi Nitrocellulose membrane (BioRad), proteins were probed overnight at 4°C with primary antibodies against TK1 (1:5,000; ab76495 [Abcam]), TS (1:1,000; 3766S [Cell Signaling Technologies]), TP (1:2,000; 12383-1AP [Acris]), or actin (1:10,000; ab6276 [Abcam]). Goat anti-rabbit (1:10,000; sc-2004 [Santa Cruz]) and goat anti-mouse (1:10,000; sc-2005 [Santa Cruz]) were used as secondary antibodies. Signals were then revealed with Amersham ECL Western blotting detection reagents and Amersham Hyperfilm ECL (both GE Healthcare). ImageJ was used for quantification via densitometry, and protein levels are expressed relative to an actin loading control.
Statistics
Results are expressed as box plots showing the median and the 25th and 75th percentiles. Error bars depict ranges. Mean and SD were plotted for correlation analyses. Significance was calculated with SigmaPlot software (version 13; Systat Software Inc). Because not all data were normally distributed, we used the Mann–Whitney rank sum test to compare groups. Correlations were determined with the Spearman correlation coefficient. All numeric data and sample sizes are presented in the supplemental materials.
RESULTS
Molecular Imaging of Treatment Response in Colo205 Xenografts
We established a FOLFOX treatment regimen that closely resembles the therapy schedule used in the clinical situation. When given weekly, the therapy inhibited the growth of Colo205 xenografts (Fig. 1A; Supplemental Table 2), implying that these tumors are sensitive to FOLFOX.

In Colo205 xenografts, FOLFOX therapy resulted in tumor growth arrest, increase in 18F-FLT uptake, and no increase in ADCmean. (A) Caliper measurements revealed FOLFOX to have a growth inhibitory effect that was already significant on day 2 of therapy. (B) Maximum-intensity projections of a representative FOLFOX-treated mouse show that tumor 18F-FLT uptake was remarkably enhanced after therapy. Imaging on day 6 was not performed on the mouse presented here. Images also show fiducial markers used for coregistration with MR images. Arrows point to 2 tumors. (C) Quantification of tumor 18F-FLT uptake revealed remarkable increase of SUVmax relative to baseline after FOLFOX. (D) Significant reductions in ADCmean relative to baseline could be observed during growth of FOLFOX- and control-treated tumors. White bars = control; gray bars = FOLFOX; striped bars = 5-FU. *P < 0.05, **P < 0.01, and ***P < 0.001 relative to control. †P < 0.05 and ††P < 0.01 relative to baseline.
18F-FLT PET imaging revealed a remarkable increase of tracer uptake in FOLFOX-treated Colo205 xenografts at all time points investigated (Figs. 1B and C; Supplemental Table 3). The largest increase was 1 d after therapy (9.2-fold relative to baseline and 10.1-fold relative to control). At the end of a treatment cycle (days 6 and 13), tracer uptake approached baseline levels but was still significantly enhanced. A potential cause of increased 18F-FLT could be the TS inhibitory activity of 5-FU. Therefore, we analyzed 18F-FLT uptake in tumors treated with 5-FU on the first day of therapy, when the strongest induction of 18F-FLT accumulation could be observed after combination therapy. 5-FU caused a remarkable increase in 18F-FLT SUVmax (control, 1.6 ± 0.4; 5-FU, 11.6 ± 2.5 [P < 0.01, 7.1-fold relative to control]) (Fig. 1C). However, the FOLFOX combination resulted in an even stronger increase (16.5 ± 2.0; P < 0.01 relative to 5-FU), indicating that 5-FU alone is not responsible for the total extent of 18F-FLT uptake after FOLFOX therapy. Also other modes of 18F-FLT PET quantification were applied (Supplemental Table 3), confirming that the results and conclusions were not dependent on the method of analysis.
We also performed longitudinal diffusion-weighted MRI studies on FOLFOX-treated tumors (Fig. 1D; Supplemental Table 4). The resulting ADC maps showed a variable and heterogeneous distribution of water diffusion (Supplemental Fig. 1). Tumors tended to have lower ADC values over time, irrespective of treatment. Relative to baseline, the ADCmean of FOLFOX-treated tumors was significantly decreased on days 2, 6, 9, and 13, and the ADCmean of control-treated tumors was significantly decreased on day 9. Tumors of FOLFOX-treated mice tended to have higher ADC values than tumors of control-treated animals, an effect that was significant on day 9. 5-FU treatment alone did not result in changes of water diffusion on day 1.
Ex Vivo Analyses of FOLFOX-Treated Colo205 Xenografts
Immunohistochemistry showed an increase of Ki-67 and TK1 staining in the FOLFOX-treated tumors (Fig. 2; Supplemental Table 5), implying an increase of cellular proliferation. Elevated TK1 staining was also noted on day 1 when mice were treated with 5-FU alone. No statistically significant association of 18F-FLT with Ki-67 immunohistochemistry could be detected. However, a correlation with TK1 (ρ = 0.893, P < 0.001) was observed.
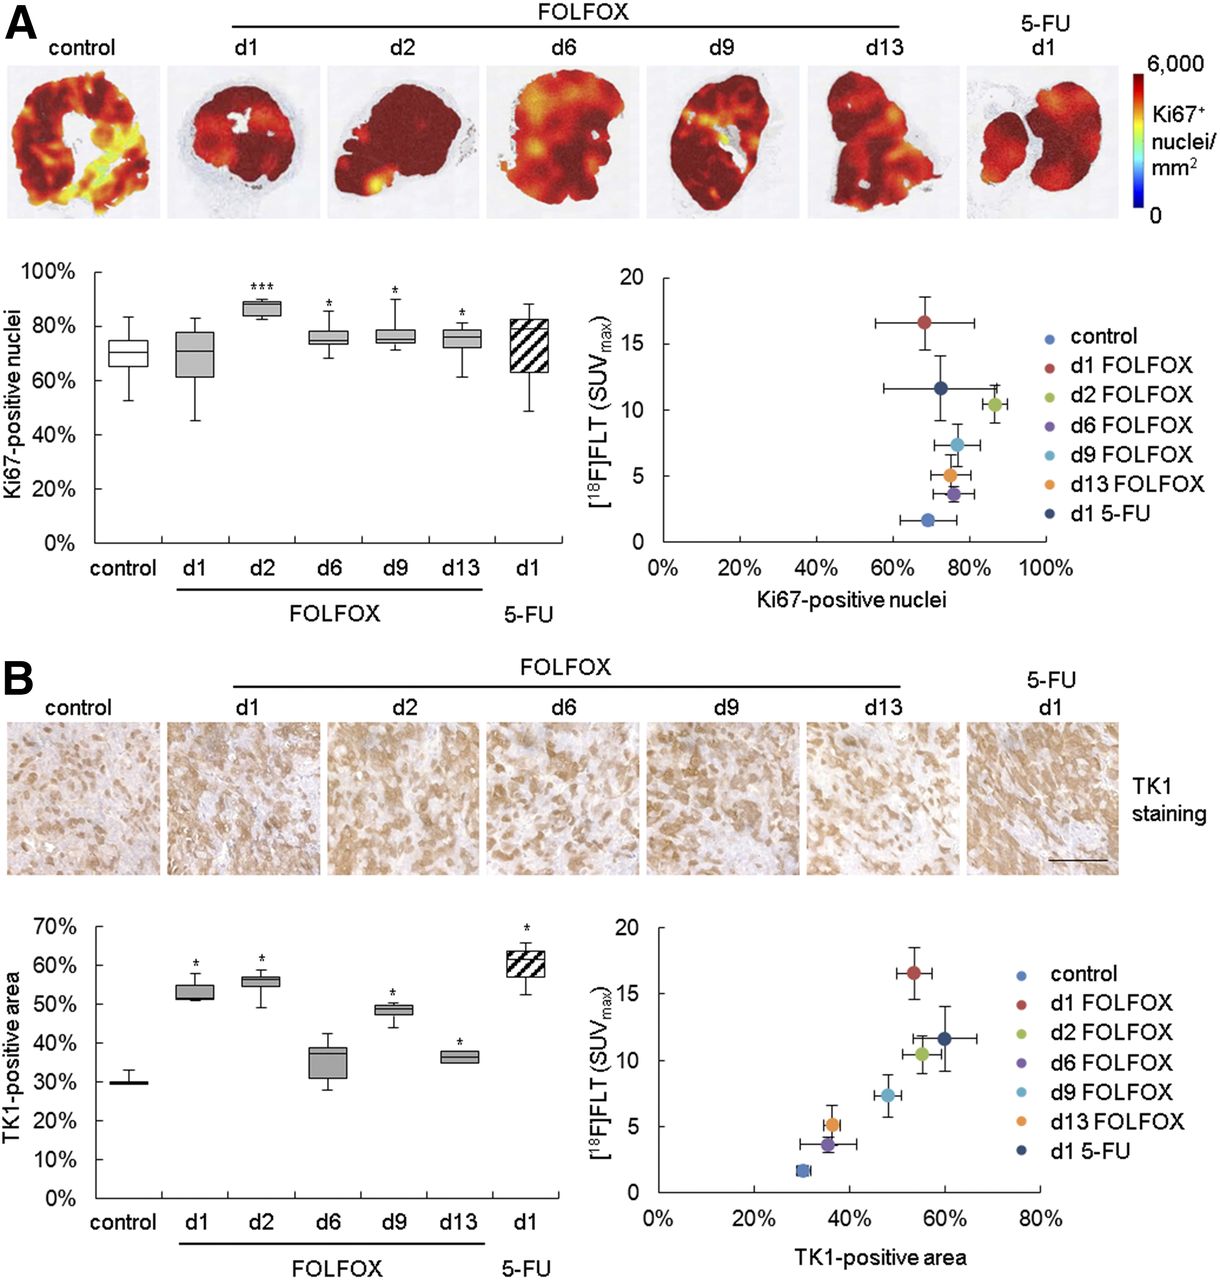
In Colo205-bearing mice, FOLFOX therapy resulted in increase of histologic proliferation markers. (A) Heat maps depicting density of Ki-67–positive nuclei of representative tumors are shown in upper panel. Percentage positive nuclei was quantified and related to 18F-FLT uptake. (B) TK1 staining was quantified as positively stained area. Scale bar = 100 μm. d = day; white bars = control; gray bars = FOLFOX; striped bars = 5-FU. *P < 0.05 and ***P < 0.001 relative to control.
Western blot analysis confirmed an increase in TK1 expression after FOLFOX therapy and also indicated upregulation of the other thymidine metabolism proteins, TS and TP (Supplemental Fig. 2; Supplemental Table 6). This finding prompted us to analyze tumor and plasma thymidine levels, which were decreased at later time points in FOLFOX-treated animals (Fig. 3; Supplemental Table 7).
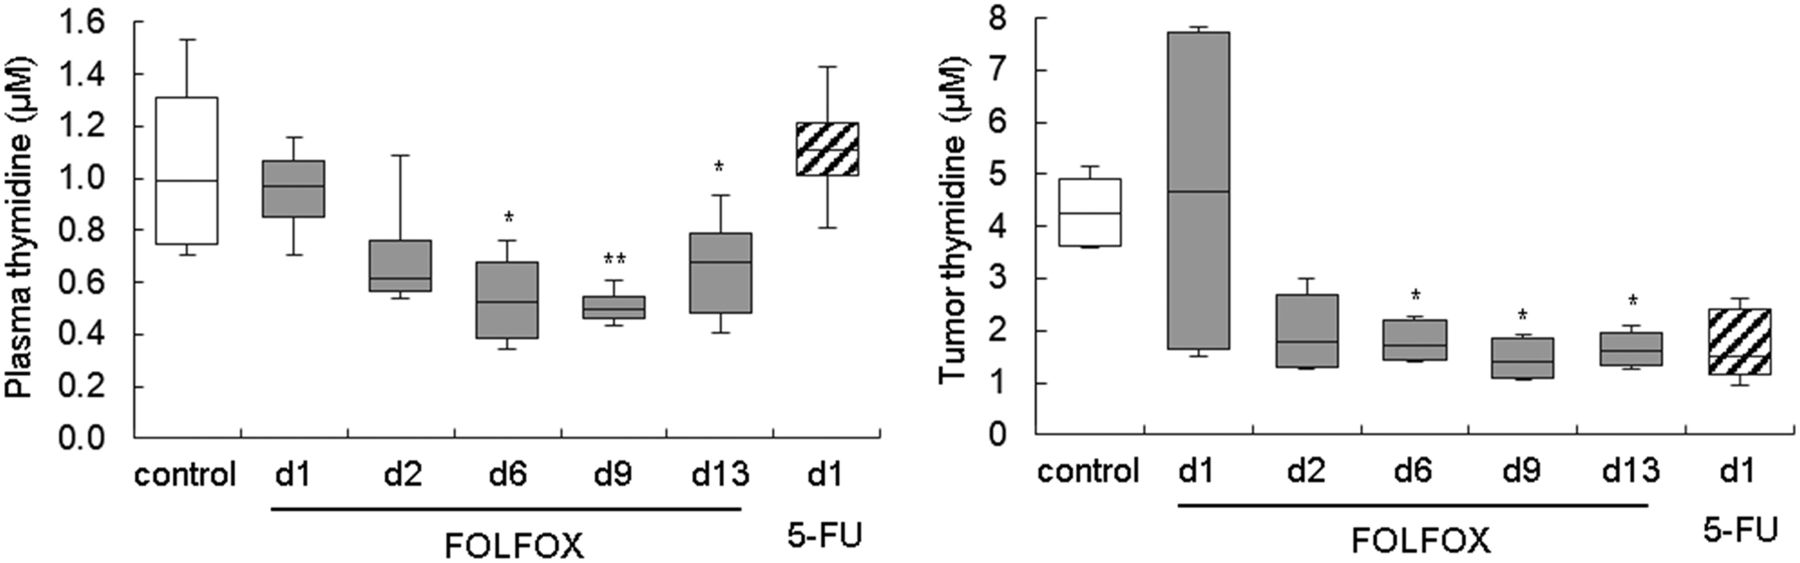
Thymidine levels were decreased in FOLFOX-treated Colo205 tumors, as measured by liquid chromatography tandem mass spectrometry. d = day; white bars = control; gray bars = FOLFOX; striped bars = 5-FU. *P < 0.05 and **P < 0.01 relative to control.
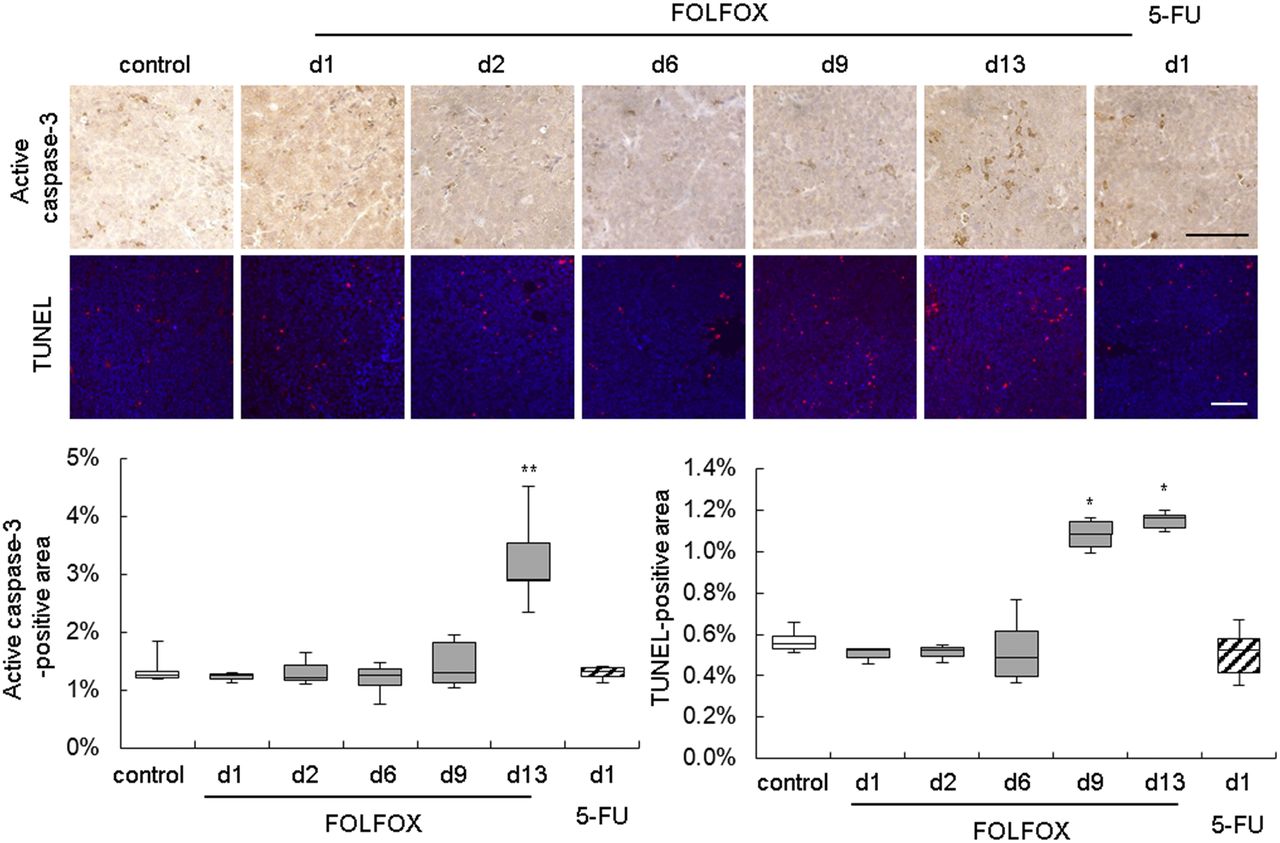
Immunohistochemical analysis of cleaved caspase-3 and a TUNEL assay revealed an increased level of cell death only after the second treatment (days 9 and 13) (Fig. 4; Supplemental Table 8). Other histologic markers of cell death were not altered (Supplemental Fig. 3).

Immunohistochemistry of activated caspase-3 and TUNEL assay of Colo205 tumors implied increase in cell death after second FOLFOX treatment. Scale bar = 100 μm. d = day; white bars = control; gray bars = FOLFOX; striped bars = 5-FU. *P < 0.05 and **P < 0.01 relative to control.
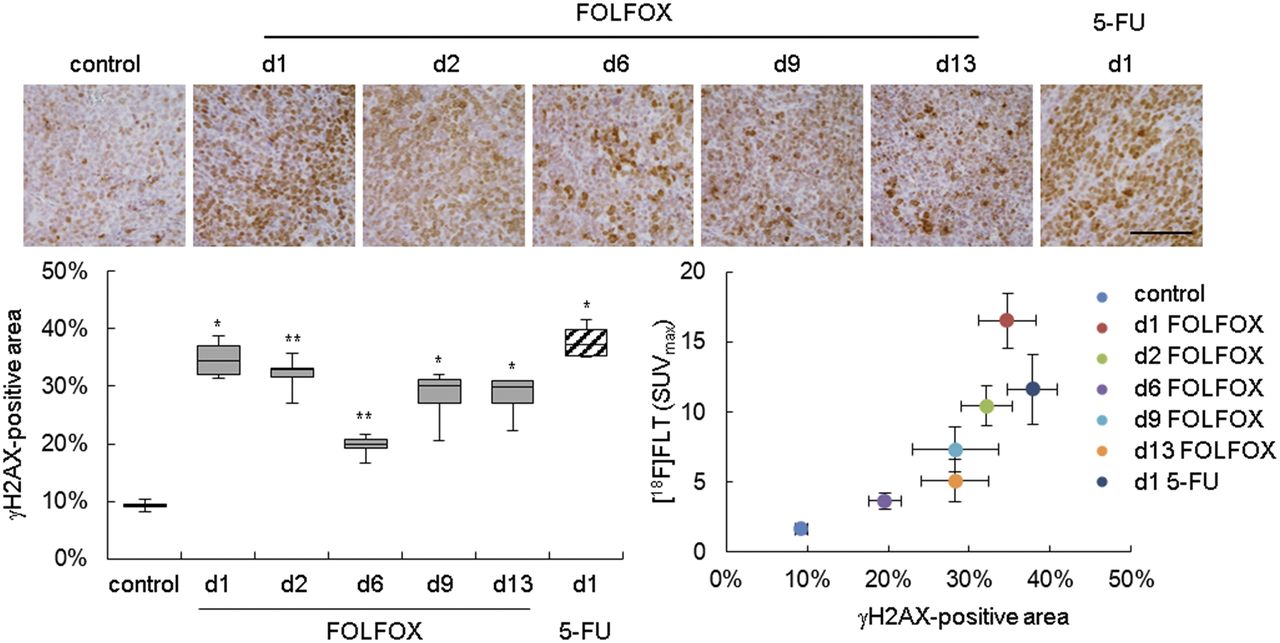
Many therapeutic agents induce double-strand breaks in DNA, which activate cellular DNA damage response (DDR) mechanisms. A key step of DDR is phosphorylation of the histone variant H2AX, producing γH2AX, which is required for assembly of DNA repair proteins (19). Analysis of γH2AX revealed prolonged activation of DDR after FOLFOX treatment in Colo205 xenografts and 1 d after 5-FU treatment (Fig. 5; Supplemental Table 9). 18F-FLT uptake correlated with γH2AX staining (ρ = 0.964, P < 0.001).

DDR was activated after FOLFOX therapy as determined by immunohistochemistry of γH2AX. Positively stained area was quantified and related to 18F-FLT uptake. Scale bar = 100 μm. d = day; white bars = control; gray bars = FOLFOX; striped bars = 5-FU. *P < 0.05 and **P < 0.01 relative to control.
18F-FLT PET Imaging of Nonresponsive HCT116 Xenografts
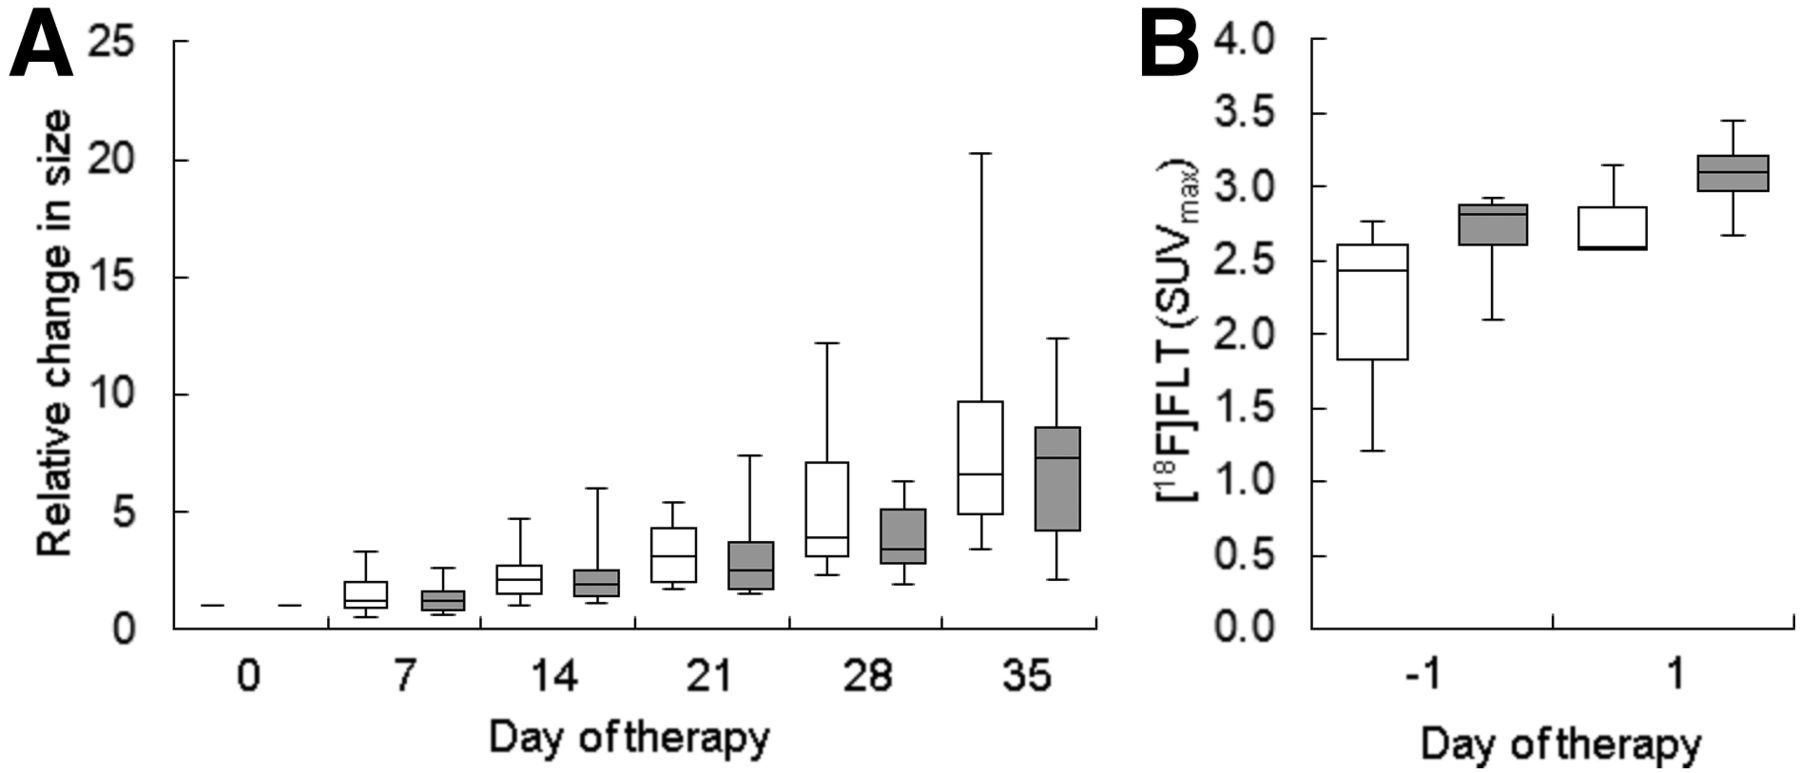
HCT116 xenografts appear to be nonresponsive to FOLFOX, as their growth was not impaired even after 3 cycles of therapy (Fig. 6A; Supplemental Table 10). We analyzed changes of 18F-FLT on day 1 after therapy, as the 18F-FLT increase was most pronounced at this time point. No alteration of 18F-FLT was observed in HCT116 tumors (Fig. 6B; Supplemental Table 11).

FOLFOX therapy in HCT116 xenografts affected neither tumor growth nor 18F-FLT uptake. (A) Tumor volumes were determined by caliper measurements. Therapy was applied weekly. (B) 18F-FLT accumulation was not significantly altered. White bars = control; gray bars = FOLFOX.
DISCUSSION
Longitudinal molecular imaging in conjunction with ex vivo molecular analyses was performed to investigate alterations induced by a FOLFOX-like combination therapy in CRC models in a clinically translatable approach. FOLFOX induced a substantial increase in 18F-FLT uptake, corresponding to sustained increases in DDR and proliferation markers. In contrast, 18F-FLT was unaltered in nonresponding HCT116 xenografts, implying that the observed increase is predictive for therapy response. Prolonged activation of DDR is most likely responsible for the absence of any major changes in tumor cell death, which were reflected by unaltered water diffusivity, as assessed by diffusion-weighted MRI. We speculate that the observed alterations are based on this tumor possessing a DNA repair–proficient metabolic phenotype, with delayed onset of cell death involving enhanced requirements for nucleosides via the salvage pathway.
Because 18F-FLT PET is thought to report tumor proliferation, and diffusion-weighted MRI is sensitive to the increase in ADC as a consequence of cell death, the 2 methods are complementary, particularly for monitoring the response of tumors to chemotherapy. This allows a comprehensive assessment of the biologic processes engaged, potentially improving care of cancer patients, especially when the 2 imaging modalities are combined.
The increase in 18F-FLT uptake in FOLFOX-treated xenografts was remarkable. Because growth was arrested in the treated tumors, one would expect a decrease in uptake of this proliferation tracer rather than an increase. In addition, we observed a significant increase in Ki-67 immunohistochemical staining. This increase contradicts the normal expectation of reduced proliferation in tumors whose growth is arrested but is in line with a clinical study that observed increased Ki-67 expression in CRC liver metastases after FOLFOX therapy (20). The authors of that study concluded that the increase could have resulted from increased proliferation and migration induced by an autocrine mechanism that might be used by metastatic cells escaping FOLFOX-induced cell death. Possibly, the Ki-67 signal in our tumor model arose from an increase in the number of proliferating tumor cells relative to nonproliferating tumor cells. Tumor volume measurements showed that even though tumor volumes were still significantly reduced relative to controls in the third week of treatment, the tumors tended to grow again, implying that there are indeed proliferative tumor cells present in the FOLFOX-treated xenografts.
Western blot analysis implied that TP, TS, and TK1 were also upregulated, even though they are involved in opposing thymidine pathways. These results were not statistically significant using nonparametric tests, likely because of the low sample number. However, it is likely that they are of biologic relevance. TS might be upregulated as a mechanism of resistance to 5-FU therapy (21), and oxaliplatin has been shown to increase expression of TP (22). Increased TK1 expression was in line with respective TK1 immunohistochemistry. It has already been reported that inhibition of TS by 5-FU can induce upregulation of TK1, resulting in increased accumulation of 18F-FLT (23). In our study, TK1 expression paralleled 18F-FLT uptake. At the end of a treatment cycle, both approached the levels of controls, implying that tumor biology recedes to baseline levels. This recession could be caused by the limited plasma half-lives of the therapeutic agents used.
Thymidine within tumors and plasma was decreased on days 6, 9, and 13, as could be provoked by the catalytic activity of TP (10). Furthermore, TS-inhibiting agents such as 5-FU can induce the thymidine salvage pathway, resulting in enhanced use of thymidine (24). In our model, diminished levels of thymidine might also contribute to the increased uptake of 18F-FLT in tumors, because thymidine and 18F-FLT compete for cellular uptake and retention (11).
Most of the observed changes (upregulation of thymidine pathway enzymes and 18F-FLT) can probably be attributed to the action of 5-FU. However, we demonstrated that equivalent doses of 5-FU alone lead to a less pronounced increase in 18F-FLT than the increase provoked by FOLFOX, suggesting that in our therapy model TS inhibition is amplified relative to that caused by 5-FU alone. Leucovorin stabilizes the complex of 5-FU with TS. Furthermore, it is likely that an oxaliplatin-induced increase in TP expression improves 5-FU activity, because TP converts 5-FU to one of its active metabolites, 5-fluoro-2′-deoxyuridine (14). It would be interesting to investigate whether the differences in TS inhibition and 18F-FLT uptake are related to differences in tumor growth inhibition.
The increase in 18F-FLT uptake in the FOLFOX-responsive Colo205 model appears to be predictive for therapy response, as 18F-FLT was unchanged in the nonresponsive HCT116 xenografts. Consequently, an increase in 18F-FLT accumulation is possibly a prognostic marker for this treatment approach. This hypothesis is strengthened by a clinical feasibility study by Kenny et al. measuring 18F-FLT uptake 1 h after treatment with the 5-FU prodrug capecitabine (25). This study showed that in breast cancer patients who progressed on therapy, the tracer uptake parameters did not change, whereas they were increased in responders. In contrast, Hong et al. observed an increase in 18F-FLT uptake on day 2 after initiation of FOLFOX treatment in CRC patients—an increase that was more pronounced in nonresponders than in responders (26). Some clinical and preclinical studies have shown that nontherapeutic doses of TS-inhibiting agents can also increase 18F-FLT (27–29), indicating that this change is not predictive of tumor therapy response to these drugs. Thus, further investigations are needed to assess the role of 18F-FLT in predicting response to TS-inhibiting therapy.
In Colo205 xenografts, we also performed PET imaging with the clinically established metabolism tracer 18F-FDG (Supplemental Fig. 4; Supplemental Table 12). 18F-FDG uptake was not consistently altered and therefore did not reflect FOLFOX effects. Moreover, because 18F-FDG accumulates in inflammatory lesions, the unchanged 18F-FDG also implies that the increase in 18F-FLT observed in this study was not caused by inflammatory cells.
In our study, tumor cell death was only slightly increased within the second FOLFOX treatment cycle, as measured by caspase-3 immunohistochemistry and TUNEL. In contrast, other histologic markers of cell death (cellular density, necrotic area) were unaltered. These results provide a plausible explanation for why we did not detect a FOLFOX-induced increase of ADCmean. The observed differences in water diffusion occurred at all time points investigated and do not appear to be of physiologic relevance.
Histologic analysis revealed sustained activation of the DDR marker γH2AX after FOLFOX or 5-FU therapy—an effect that could be caused by oxaliplatin or 5-FU (30,31). 5-FU–induced DDR has been described to occur in S phase (32). Hence, it is likely that the DDR observed here is also linked to this phase, as is in line with sustained TK1 expression, which is S-phase–specific. In our study, elevated γH2AX was observed at all time points, even though levels approached those of control levels at the end of the first treatment cycle (day 6). Decreasing γH2AX expression might suggest either successful repair of the DNA damage or lysis of dead cells (33). Because no induction of cell death was observed on day 6 after FOLFOX and immunohistochemical markers of proliferation were increased, it is likely that the DNA damage was successfully repaired. Hence, attempts of the tumor cell to repair DNA double-strand breaks might delay induction of cell death, explaining unchanged ADCmean.
Increased amounts of nucleosides are needed during DDR. Consequently, DDR in the treated tumors could potentially contribute to the increased 18F-FLT uptake observed here. γH2AX expression parallels 18F-FLT uptake, and we found a correlation between 18F-FLT uptake and γH2AX expression, supporting our hypothesis of increased nucleoside consumption during DDR.
A limitation of this study is that we did not evaluate tumors treated with single agents, apart from the analysis of a single time point for 5-FU. Such an analysis would help to assess the relative contribution of each agent to the observed changes. However, single agents are rarely used in the clinical setting. Therefore, our data shed light on changes induced by a clinically relevant therapy approach. It would be of interest to assess FOLFOX-induced mechanisms in a broader panel of tumor types including nonresponsive models and clinical tumor specimens.
CONCLUSION
Factors resulting in an increase of 18F-FLT uptake can be manifold, including increased cellular proliferation (Ki-67), DNA-salvage-pathway use (TK1), and DDR activity, as well as thymidine levels. These parameters might be modulated by tumor treatment, as demonstrated here for a FOLFOX combination therapy as well as a 5-FU monotherapy. Consequently, in this scenario, changes in 18F-FLT reflect alterations in these pathways not directly related to tumor therapy response, because in general a reduced proliferation (and 18F-FLT accumulation) is associated with tumor therapy response.
DISCLOSURE
The research leading to these results has received support from the Innovative Medicines Initiative Joint Undertaking (www.imi.europa.eu) under grant agreement 115151, resources of which are composed of financial contributions from the European Union’s Seventh Framework Program (FP7/2007-2013) and EFPIA companies’ in-kind contribution. This work was also supported by the Deutsche Forschungsgemeinschaft (DFG) Cluster of Excellence ‘Cells-in-Motion’ (EXC1003 - CiM), University of Münster, Germany; the Interdisciplinary Centre for Clinical Research (IZKF, core unit PIX), Münster, Germany; and core funding from Cancer Research U.K. (C2536/A16584). No other potential conflict of interest relevant to this article was reported.
Acknowledgments
We acknowledge Saeedeh Amirmohseni, Christine Bätza, Florian Breuer, Stefanie Bouma, Irmgard Hoppe, Sarah Köster, Christa Möllmann, Roman Priebe, and Dirk Reinhardt for excellent technical support.
Footnotes
↵* Contributed equally to this work.
Published online Feb. 23, 2018.
- © 2018 by the Society of Nuclear Medicine and Molecular Imaging.
REFERENCES
- Received for publication November 30, 2017.
- Accepted for publication January 22, 2018.


Jump to section
Related Articles
Cited By...
- No citing articles found.