


Abstract
Anticalins are a novel class of biopharmaceuticals, displaying highly desirable attributes as imaging agents. The anticalin PRS-110 was rationally engineered to target the oncogene MET with high affinity and specificity. The aim of this study was to visualize MET expression and analyze biodistribution of 89Zr-labeled PRS-110 in human tumor–bearing mice. Methods: 89Zr-PRS-110 was generated. For biodistribution studies (96 h after injection of tracer) 10 μg of 89Zr-PRS-110 (with 0–490 μg of unlabeled PRS-110) were injected into BALB/c mice bearing high MET-expressing H441 non–small cell lung cancer xenografts. Further characterization with PET imaging was performed at 6, 24, 48, and 96 h after injection of 50 μg of 89Zr-PRS-110 into mice bearing H441, primary glioblastoma U87-MG (intermediate MET), or ovarian cancer A2780 (low MET) xenografts. Drug distribution was also analyzed ex vivo using fluorescently labeled PRS-110. Results: Biodistribution analyses showed a dose-dependent tumor uptake of 89Zr-PRS-110, with the highest fractional tumor uptake at 10 μg of 89Zr-PRS-110, with no unlabeled PRS-110. Small-animal PET imaging supported by biodistribution data revealed specific tumor uptake of 89Zr-PRS-110 in the MET-expressing H441 and U87-MG tumors whereas the MET-negative A2780 tumor model showed a lower uptake similar to a non-MET binder anticalin control. Tumor uptake increased up to 24 h after tracer injection and remained high, whereas uptake in other organs decreased over time. Ex vivo fluorescence revealed intracellular presence of PRS-110. Conclusion: 89Zr-PRS-110 specifically accumulates in MET-expressing tumors in a receptor density–dependent manner. PET imaging provides real-time noninvasive information about PRS-110 distribution and tumor accumulation in preclinical models.
The receptor tyrosine kinase MET (also known as hepatocyte growth factor [HGF] receptor) is of clinical interest as a drug target because genetic and biochemical data have shown that MET and its ligand, HGF, have a causal role in essential hallmarks of cancer (1,2). These include uncontrolled cell survival, growth, angiogenesis, and metastasis. The overexpression of MET at the tumor cell membrane and its ligand in the surrounding stroma occurs in many tumor types (1,2).
This strong rationale for targeting the pathway has led to multiple clinical trials, which are currently under way to evaluate the efficacy of MET-targeting agents including monoclonal antibodies (against the receptor or ligand) and tyrosine kinase inhibitors (1). Diagnostic methods that help identify a patient population likely to respond to MET therapy are fundamental for successful trial outcome. Patient selection for ongoing trials is largely based on evaluation of MET status in biopsy material using immunohistochemistry or fluorescent in situ hybridization at the time of enrolment; however, the methods are not capable of informing fluctuation in expression levels over time. Allied to this shortcoming, the evaluation of MET involvement in secondary tumors is often hampered by lack of tissue. An imaging tool capable of providing real-time data on whole-body MET expression would aid decision making and identification of patients who will likely benefit from a MET-targeting agent, thus reducing the unnecessary administration of ineffective drugs.
Anticalins are a novel class of small biologic therapeutics, based on the human lipocalin scaffold (3). The human lipocalins are a family of small-molecular-weight proteins involved in binding and transporting diverse molecules (small molecules and large proteins) (3–5). The lipocalins consist of a barrellike structure made up of 8 β strands connected by 4 loop regions. Anticalins are rationally engineered to bind with exquisite selectivity and potency to a single target or specific targets by introducing discrete amino acid substitutions in selected areas of the lipocalin scaffold. Importantly, anticalins retain the overall fold of lipocalins but exhibit redesigned pharmacologic properties (6). We rationally engineered PRS-110 (Pieris AG), an anticalin with monovalent specificity for MET (binding affinity of 0.6 nmol/L determined by kinetic exclusion assay) (7), which is based on the tear lipocalin scaffold. PRS-110 acts as both a full antagonist of HGF-evoked MET signaling (half maximal inhibitory concentration [IC50] of 35 nmol/L in HUVEC pMet assay) and also a ligand-independent inhibitor of MET-driven tumorigenesis. PRS-110 is being developed as a therapeutic and in this form is site-specifically conjugated to a branched 40-kDa polyethyleneglycol (PEG) (2 × 20 kDa PEG) moiety for half-life prolongation (7). PRS-110 also displays many highly desirable properties as an imaging agent. As 17-kDa proteins (or bulkier PEG conjugates), anticalins may have more favorable tumor uptake and penetration when compared with the much larger IgGs (∼150 kDa).
The therapeutic application of anticalins was recently demonstrated in a phase I trial in patients with solid tumors with a vascular endothelial growth factor–targeting anticalin antagonist (PRS-050) (8). The clinical safety and tolerability, clinical responses, biomarker inhibition, and target engagement were confirmed. This particular anticalin displayed a terminal half-life of 6 d, and no antidrug antibody responses were observed for the duration of the trial after repeated dosing (over 9 mo on therapy) (8). These results support the utility of the anticalin drug platform for broad therapeutic and diagnostic applications.
Molecular imaging has permitted the visualization of the organ distribution of therapeutic antibodies by labeling them with radionuclides, for example, with 89Zr, which has a half-life of 78.4 h (9–12). In previous studies, we developed the PET radiopharmaceuticals 89Zr-labeled bevacizumab to image vascular endothelial growth factor and 89Zr-trastuzumab to image human epidermal growth factor receptor 2 in tumors. We tested them successfully preclinically and clinically, demonstrating the potential of clinical antibody imaging using these tracers for tumor detection, treatment monitoring, and drug distribution (9–12). To visualize in vivo MET expression and study the organ distribution of the anticalin, we generated a radiolabeled version of the MET-targeting agent (89Zr-PRS-110) and assessed its specific uptake in different human tumor xenograft models. The potential application of anticalins as imaging agents and the utility of radiolabeled PRS-110 are described herein.
MATERIALS AND METHODS
Cell Lines
Cell lines with different levels of MET expressions were used. The human non–small cell lung cancer cell line H441 and human primary glioblastoma U87-MG cell line express MET. A2780 is a human ovarian cancer cell line without detectable MET expression. All cell lines were obtained from American Type Culture Collection. MET status of the cell lines was determined by flow cytometry analysis using the monoclonal antihuman MET-fluorescein antibody (FAB3582F; R&D Systems) (Supplemental Fig. 1; supplemental materials are available at http://jnm.snmjournals.org). H441 and A2780 cells were cultured in RPMI 1640 (Invitrogen), supplemented with 10% fetal calf serum (Bodinco BV) and 2 mM l-glutamine (Invitrogen). U87-MG cells were cultured in Dulbecco modified Eagle medium–high glucose (Invitrogen), supplemented with 10% fetal calf serum in gelatin-coated culturing flasks. All cell lines were grown at 37°C in a fully humidified atmosphere containing 5% CO2.
Synthesis and Quality Control of Conjugated and Radiolabeled Anticalins
PRS-110 (57 kDa; 3.8 mg/mL; Pieris AG), the MET-specific anticalin containing a 40-kDa (2 × 20 kDa PEG; NOF) branched PEG moiety (7), was allowed to react with deferoxamine-p-SCN (Macrocyclics) and subsequently loaded with 89Zr in analogy to the protocol described for antibodies by Vosjan et al. (13). The supplemental information provides details of the experiment.
89Zr-PRS-110 Internalization Assay
To determine internalization rates of 89Zr-PRS-110 after binding to MET, an in vitro assay was performed. H441 cultured cells were harvested with trypsin and washed and diluted in cold phosphate-buffered saline containing 0.5% human serum albumin. This procedure is analogous to the one used in flow cytometry and according to flow cytometry results does not lead to strong release of MET from the cell surface. Cells (5 × 10⁶) were incubated on ice with 0.1 μg of 89Zr-PRS-110 for 1.5 h. After cells were washed twice, medium was added and cells then were incubated at 37°C to allow for internalization. Internalized and membrane-bound 89Zr-PRS-110 were separated by 5-min incubation with 0.2 M glycine plus 4 M urea buffer (14). Samples of 89Zr-PRS-110 that was internalized, membrane-bound, or released in the medium were each measured in the γ counter. The experiment was performed in triplicate.
Animal Experiments: General
For subcutaneous tumor inoculation, cells were harvested by trypsinization and suspended in medium. In vivo imaging and ex vivo experiments were conducted using male nude BALB/c mice (BALB/cOlaHSD-foxnnu) obtained from Harlan. For H441 xenografts, mice were subcutaneously injected with 5 × 10⁶ cells in 150 μL of phosphate-buffered saline. U87-MG or A2780 xenograft models were established by subcutaneous injection of 5 × 10⁶ cells in 0.3 mL (1:1) of medium and Matrigel (BD Biosciences). Tumor growth was followed with caliper measurements. The tracer injection was performed 3 wk after inoculation for both H441 and U87-MG models and after 2 wk for A2780 xenograft models.
Biodistribution Study: Competition with Unlabeled PRS-110
A biodistribution study with 89Zr-PRS-110 was performed in H441 tumor–bearing mice to evaluate dose-dependent tumor uptake of 10 μg of 89Zr-PRS-110 (1 MBq) in the presence and absence of unlabeled PRS-110. Four dose groups of a total of 10, 50, 100, and 500 μg of PRS-110 (10 μg of 89Zr-PRS-110 per group) were included. Each dose was administered to animals (n = 4–6) via penile vein injection. The tracer and the unlabeled dose were injected simultaneously. Animals were sacrificed 96 h after tracer injection for biodistribution analysis. Samples and primed standards were counted for radioactivity in the well-type γ counter and corrected for physical decay. Ex vivo tissue activity is expressed as percentage injected dose per gram of tissue (%ID/g).
Small-Animal PET Imaging and Biodistribution in Different Tumor Models
For small-animal PET imaging, mice bearing H441, U87-MG, or A2780 tumors (n = 4–6) were scanned at 6, 24, 48, and 96 h after injection of 50 μg of 89Zr-PRS-110 (5 MBq). Fifty micrograms of 89Zr-PRS-110 could be labeled with 5 MBq of 89Zr, which was the minimal amount of radioactivity necessary to obtain a sufficient number of radioactive counts within the imaging time window of around 1 h for in vivo imaging 96 h after tracer injection. After the last scan, mice were sacrificed for biodistribution analysis. Average tumor weight at the end of the experiment was 0.084 ± 0.062 g (H441), 0.580 ± 0.230 g (U87-MG), and 0.894 ± 0.408 g (A2780).
To discriminate between specific and nonspecific tumor uptake and biodistribution, the same groups were studied using the negative control radiotracer 89Zr-Tlc-PEG, at an amount of 50 μg of 89Zr-Tlc-PEG (5 MBq).
Animals were imaged using a small-animal PET Focus 220 rodent scanner (CTI Siemens). After image reconstruction, in vivo quantification was performed with AMIDE Medical Image Data Examiner software (version 0.9.1; Stanford University) (15). The data are presented as the mean standardized uptake value. For region-of-interest measurements, tumor volumes were drawn on the basis of tumor weight measured ex vivo assuming a tissue density of 1 g/mL. For organ tracer distribution quantification, a region of interest was drawn in the representative area of the measured organs. For blood-pool measurements, a representative area in the heart was selected.
The animal experiments were approved by the Institutional Animal Care and Use Committee of the University of Groningen.
Ex Vivo Analysis
To assess tumor distribution of PRS-110 using a fluorescently labeled tracer, mice bearing H441 tumors received 100 μg of PRS-110–800CW. Mice were sacrificed 96 h after tracer injection, and harvested tumors were paraffin-embedded for further analysis. Fluorescence microscopy analysis of PRS-110 labeled with IRDye 800CW together with Hoechst staining was determined in tumor sections as described before (16).
Hematoxylin and eosin staining was performed routinely and used to analyze tissue viability and morphology. MET immunohistochemistry was performed using antibodies detecting human MET (#ab51067; Abcam). Photographs were acquired by digitalized scanning of slides using the NanoZoomer 2.0-HT multislide scanner (Hamamatsu), and the slides were analyzed using NanoZoomer Digital Pathology viewer software (Hamamatsu).
Statistical Analysis
Data are presented as mean ± SD. The group size used for in vivo studies was 4–6 animals per group. Statistical analyses were performed using the Mann–Whitney test (GraphPad 5.00). A P value of 0.05 or less was considered significant.
RESULTS
Synthesis and Quality Control of Conjugated and Radiolabeled 89Zr-PRS-110
89Zr-PRS-110 was generated by chemical conjugation with deferoxamine-p-SCN and subsequent loading with 89Zr, as described in detail in the supplemental results. For products obtained with different ratios of PRS-110 and deferoxamine-p-SCN, we analyzed aggregation tendency and radiochemical purity by size-exclusion high-performance liquid chromatography and a trichloroacetic acid precipitation assay. The latter assay was also used to assess the stable attachment of the radiolabel to the anticalins over time in 0.9% NaCl at 4°C and in human serum at 37°C. PRS-110 labeled at a ratio of 1:5 or 1:10 allowed for a specific activity of 100 MBq/mg at a radiochemical purity greater than 95% without purification, while being stable for up to 1 wk in 0.9% NaCl at 4°C and in human serum at 37°C. A nonbinding control tracer, 89Zr-Tlc-PEG, was generated in an analogous fashion.
89Zr-PRS-110 Internalization Assay
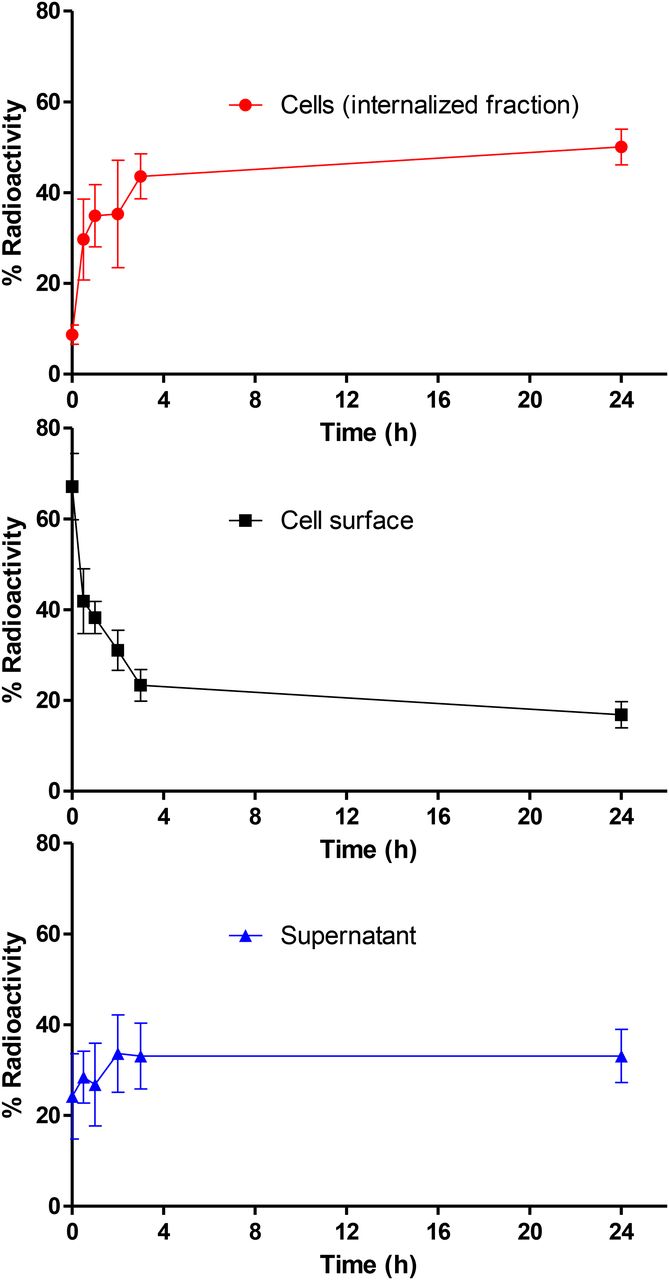
Internalization studies were performed with 89Zr-PRS-110 to determine the fate of the tracer on binding to MET. In vitro analysis using MET-positive H441 cells (Supplemental Fig. 1) showed that 89Zr-PRS-110 was rapidly internalized (Fig. 1). The internalized fraction increased over the first 3 h of incubation and stabilized thereafter up to 24 h. There is already a fraction of around 10% 89Zr-PRS-110 internalized at the start of the experiment, which we attributed to rapid uptake during handling of the cells. Cell surface–bound 89Zr-PRS-110 decreased concomitantly during this period. The radioactivity in the supernatant was relatively constant over the course of the experiment. The presence of free 89Zr-PRS-110 in the supernatant could have different causes, such as a saturation of MET at the cell surface or MET receptor shed from the cells, which can bind free 89Zr-PRS-110. Also, at the nanomolar concentration of 89Zr-PRS-110 used in this experiment, a fraction of 89Zr-PRS-110 is expected to be not bound to its target at binding equilibrium.

Membrane binding and internalization of 89Zr-PRS-110 after binding MET on H441 cells. Cell surface (acid buffer), intracellular, and supernatant fraction radioactivity, expressed as percentage of total activity. Data were obtained in 3 independent experiments.
Biodistribution Study: Competition with Unlabeled PRS-110
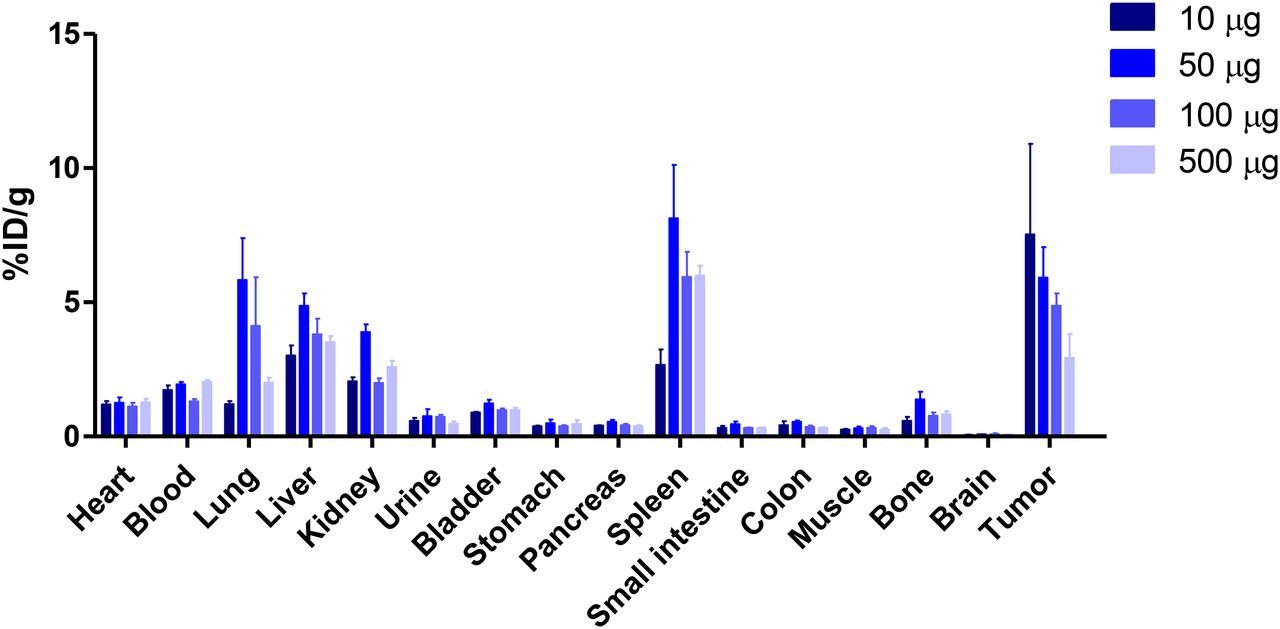
To assess the biodistribution of 89Zr-PRS-110 in tumor-bearing mice, we injected 10 μg of 89Zr-PRS-110 into mice bearing H441 xenografts and determined the uptake of the tracer in different organs 96 h after injection. This time point was chosen on the basis of experience with 89Zr-antibody imaging, for which the optimal time for imaging was 72–144 h after antibody tracer injection (9,11). Three additional groups were investigated, for which 10 μg of 89Zr-PRS-110 was mixed with additional unlabeled PRS-110 to reach the final total doses of 50, 100, and 500 μg. The highest fractional tumor uptake was observed in the 10-μg dose group (Fig. 2). The %ID/g tumor uptake decreased with increasing doses of unlabeled PRS-110, from 7.5 ± 3.4 %ID/g at 10 μg, 5.9 ± 1.1 %ID/g at 50 μg, and 4.9 ± 0.5 %ID/g at 100 μg to 2.9 ± 0.9 %ID/g at 500 μg. Although the difference in tumor uptake after injection of the 3 lower doses was not statistically significant, the overall trend was consistent with the interpretation that increasing doses of unlabeled PRS-110 lead to saturation of the tumor and to specific blockade of 89Zr-PRS-110 uptake and that tumor uptake was therefore MET-driven. The uptake in the spleen, but also in the lung, liver, and kidney, was increased in the doses exceeding 10 μg. Although there was no visible dose dependency, the data are consistent with increased nonspecific exposure to 89Zr-PRS-110 when the tumor was saturated.

Biodistribution of 89Zr-PRS-110 at 96 h as determined by ex vivo analysis. Four dose groups of 10, 50, 100, and 500 μg of PRS-110 (with 10 μg of 89Zr-PRS-110 per group) were included in dose-escalation biodistribution in H441 human tumor–bearing mice (4–6 mice per group). Data are expressed as %ID/g.
Small-Animal PET Imaging and Biodistribution in Different Tumor Models
To assess whether 89Zr-PRS-110 facilitates PET imaging of MET-positive tumors in vivo, small-animal PET imaging was performed in subcutaneously xenografted mice. In this experiment, mice bearing strongly (H441) and weakly MET-positive xenografts (U87-MG) were investigated, with non–MET-expressing xenografts (A2780) used as a negative control. The expected relative expression of MET in the cell lines was corroborated by flow cytometry (Supplemental Fig. 1) and by immunohistochemistry of ex vivo xenografts (Fig. 3). Because nonspecific tumor uptake is known to be strongly dependent on the tumor model (17), we also used a negative control for the tracer molecule, the non–MET-binding 89Zr-Tlc-PEG. Although the biodistribution experiment performed with different total PRS-110 concentrations showed signs of saturation already at the 50-μg dose, imaging experiments were performed with 50 μg of 89Zr-PRS-110 and 89Zr-Tlc-PEG. With this dose, sufficient radioactivity could be injected to obtain high-quality images up to the latest time point investigated, 96 h. After PET scanning, mice were sacrificed for ex vivo biodistribution analysis.
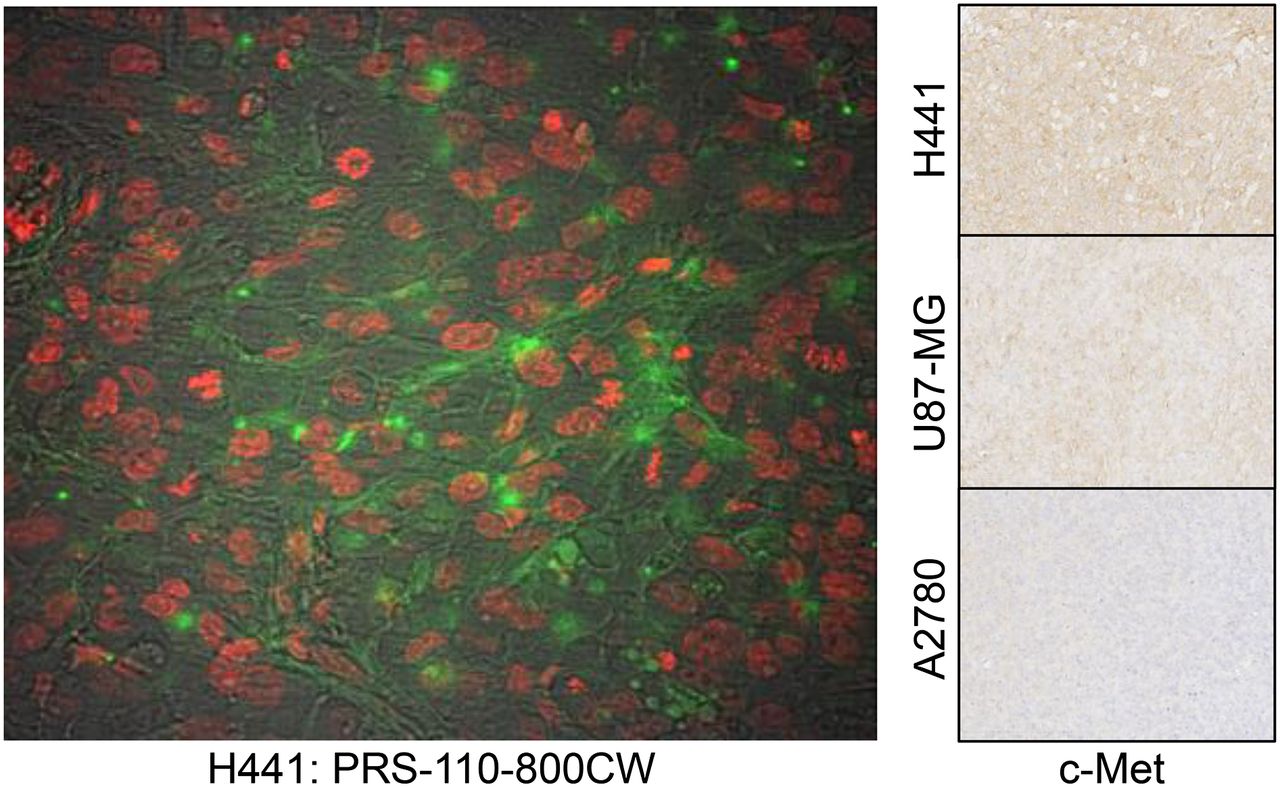
Ex vivo tumor analysis of PRS-110 distribution 96 h after tracer injection in H441 tumor visualized by fluorescence microscopy. Green is from IRDye 800CW conjugated to PRS-110, and nuclei (in red) are visualized. In background, tumor structure is visible. MET status of H441, U87-MG, and A2780 was determined by immunohistochemistry, and representative picture is included.
Figure 4A shows a representative image time series of a xenograft mouse bearing a H441 tumor, which was injected with 50 μg of 89Zr-PRS-110. Averaged quantitative small-animal PET data for the group of 5 mice studied for the blood pool, liver, spleen, kidney, and tumor uptake are provided in Figure 4B. The data reveal a strong tumor-specific uptake of 89Zr-PRS-110, which increases between 6 and 24 h (P < 0.05), with sufficient contrast to allow clear imaging of the tumor. There was no significant difference in tumor uptake between 24, 48, and 96 h after tracer injection, whereas blood-pool activity decreased between all measured time points (P < 0.05). After 24 h, nontarget tissue uptake also decreased, resulting in increased tumor-to-organ ratios at 96 h after tracer injection.
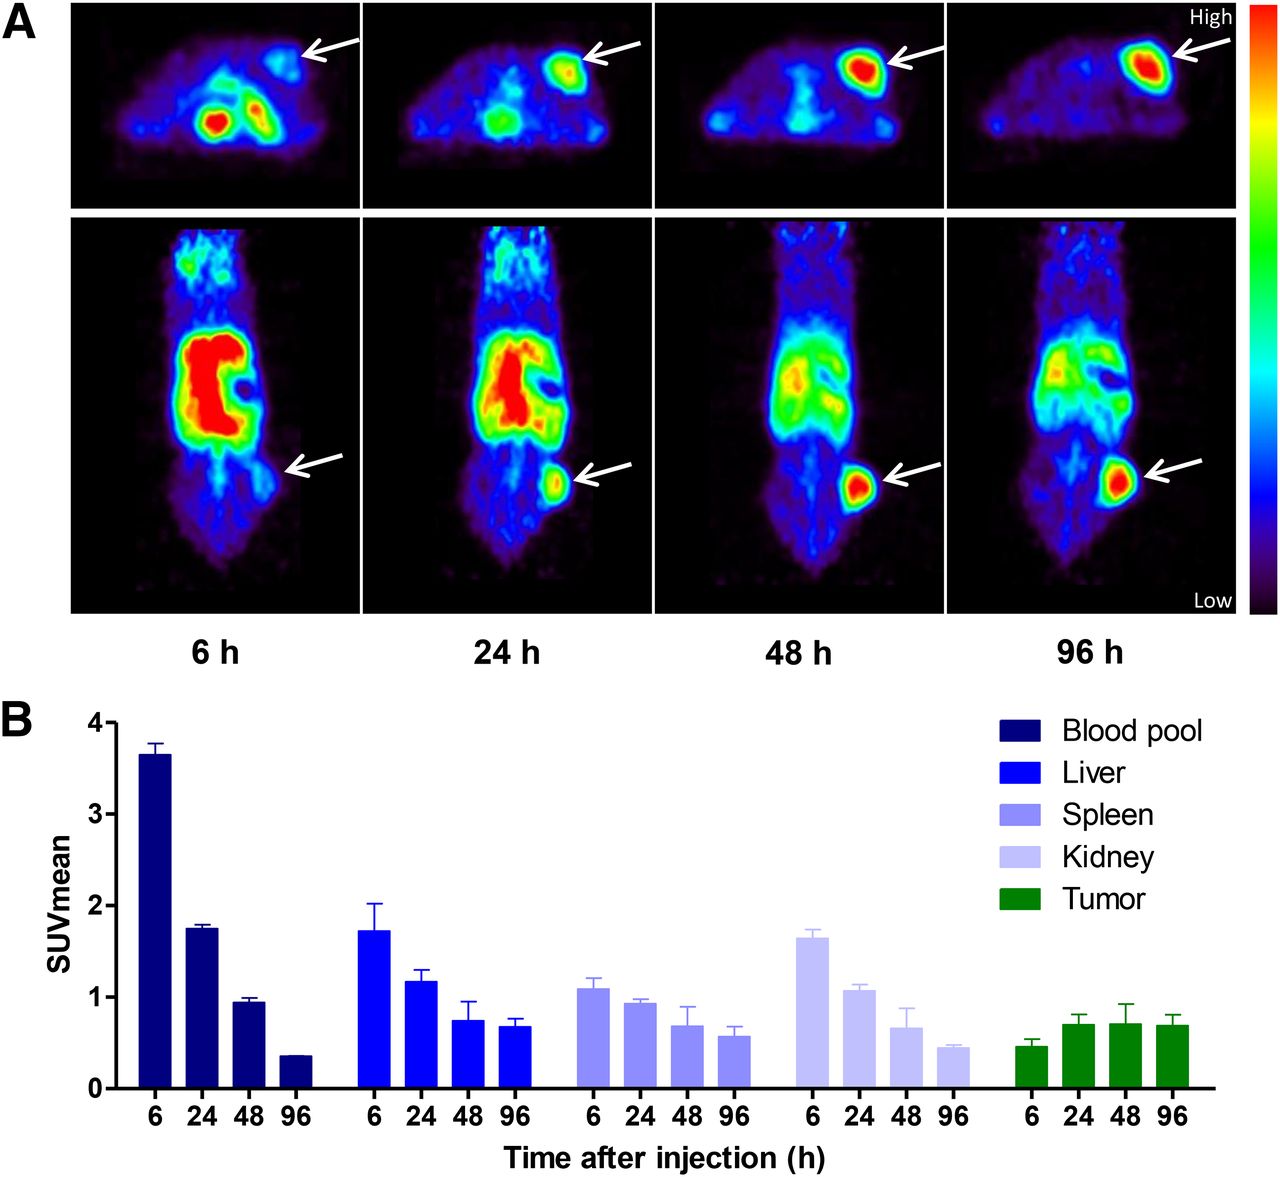
89Zr-PRS-110 small-animal PET imaging of H441-bearing mice. (A) Representative transversal and coronal small-animal PET images are shown at 6, 24, 48, and 96 h after tracer injection. (B) Small-animal PET data quantification was performed for blood pool, liver, spleen, kidney, and tumor uptake in all mice (4–6 mice per group). Data are expressed as mean standardized uptake value (SUVmean).
Figure 5 provides a comprehensive overview of the experiments at 96 h after injection of 89Zr-PRS-110 and the control 89Zr-Tlc-PEG as tracer molecules, performed with different tumor xenograft models. Background nonspecific tumor uptake of 89Zr-Tlc-PEG could be seen in all tumor models. However, the PET imaging data for the H441 xenografts (Fig. 5A) show a significantly higher uptake in the 89Zr-PRS-110 group versus the 89Zr-Tlc-PEG group, in line with the ex vivo biodistribution data (5.9 vs. 3.9 %ID/g). In the U87-MG tumor model, both PET imaging and ex vivo biodistribution data show that the difference between the 89Zr-PRS-110 group and the 89Zr-Tlc-PEG group was much less pronounced (1.8 vs. 1.2 %ID/g) but still statistically significant (P < 0.05). In the A2780 (MET-negative) model, both 89Zr-PRS-110 and 89Zr-Tlc-PEG are taken up to a similar extent, with ex vivo data showing that the 89Zr-PRS-110 uptake was lower than that of the control 89Zr-Tlc-PEG group (1.7 vs. 2.5 %ID/g; not significant). Maximum-intensity projections of the 89Zr-PRS-110 tracer distribution are shown in Supplemental Figure 3. Overall, there is a significant correlation between ex vivo biodistribution and small-animal PET data quantification (R2 = 0,812; P < 0.05), indicating the similarity between both measurements of tracer distribution and the validity of the results. This correlation is in agreement with previous results using 89Zr-radiolabeled bevacizumab (18). Apart from tumor uptake, the uptake of 89Zr-PRS-110 and 89Zr-Tlc-PEG in various organs was comparable (Supplemental Table 2), with the exception of lung uptake: 89Zr-PRS-110 uptake was higher than 89Zr-Tlc-PEG uptake in the MET-positive H441 (5.8 vs. 2.0 %ID/g; P < 0.05) and U87-MG (4.0 vs. 1.7 %ID/g; P < 0.05) xenografts, whereas it was similar in the MET-negative A2870 xenograft (1.4 vs. 1.9 %ID/g).
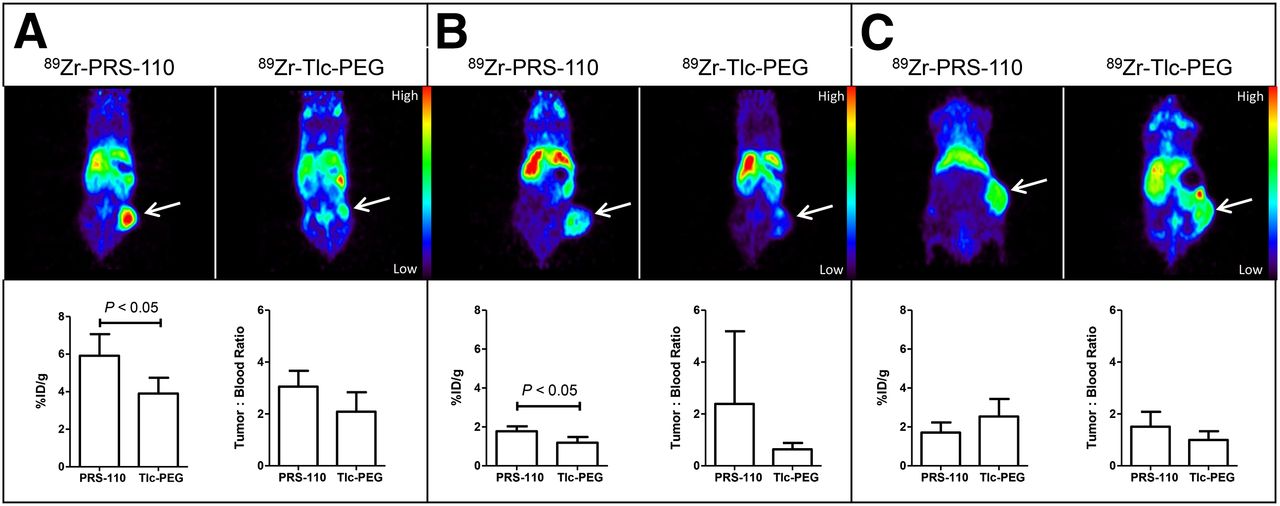
89Zr-PRS-110 small-animal PET imaging of H441- (A), U87-MG- (B), and A2780-bearing mice (C). Representative transversal and coronal small-animal PET images are shown in the upper panel at 96 h after tracer injection of 89Zr-PRS-110 for MET-driven tumor uptake and 89Zr-Tlc-PEG for nonspecific tumor uptake. Ex vivo tumor uptake of 89Zr-PRS-110 and 89Zr-Tlc-PEG is shown in the lower panel. To compare specific tumor uptake between tumor models, tumor-to-blood ratios are provided (4–6 mice per group).
Ex Vivo Analysis
To assess whether the differential MET expression of the individual tumor cell lines used translates to the xenografted tumors, we performed immunohistochemistry of tumor sections. In agreement with flow cytometry results (Supplemental Fig. 1), xenografts from the small-animal PET imaging studies revealed stronger expression in H441 cells than U87-MG cells, with no detectable expression in A2780 tumors (Fig. 3). To assess intracellular uptake of PRS-110 in H441 xenograft tumors, we performed a biodistribution experiment with PRS-110 labeled with the fluorescent IRDye 800CW. Fluorescence microscopy analysis of tumor slices revealed a heterogeneous fluorescence signal of PRS-110 labeled with IRDye 800CW, which was visible both intracellularly and at the cell surface (Fig. 3).
DISCUSSION
In this study, we present a new type of molecularly targeted radiopharmaceutical, a 89Zr-labeled anticalin. The development and quality control of 89Zr-PRS-110 provided results similar to those previously seen for 89Zr labeling of non-anti-MET antibodies (19), underscoring the compatibility of anticalins with standard labeling protocols and facilitating their application as radiotracers.
To characterize the suitability of 89Zr-PRS-110 as an imaging agent, we first used a radioactive internalization assay. Internalization is a prerequisite for the delivery and accumulation of the residualizing radiolabel 89Zr within the cells. We found that the tracer is taken up by MET-positive tumor (H441) cells in vitro, despite 89Zr-PRS-110 being a monomeric and therefore non-MET-receptor–activating binder. Similar recent experiments using fluorescently labeled PRS-110 and flow cytometry are in line with this result (7).
We then performed biodistribution and small-animal PET imaging experiments in xenograft mice bearing MET-positive and MET-negative tumors. As a control for 89Zr-PRS-110 specificity, tumor uptake was also assessed with 89Zr-Tlc-PEG, which does not bind to MET but is otherwise similar to PRS-110. In MET-expressing tumor models H441 and U87-MG, we found tumor uptake to be significantly higher for 89Zr-PRS-110 than for the nontargeted control 89Zr-Tlc-PEG. The MET-negative A2780 tumors led to a lower uptake (not significant) of 89Zr-PRS-110 than 89Zr-Tlc-PEG, confirming that 89Zr-PRS-110 uptake in the MET-positive tumor xenografts was MET-driven. The difference between specific and nonspecific uptake was higher in H441 cells (2.0 %ID/g) than U87-MG cells (0.6 %ID/g), as shown by both biodistribution and imaging results. This difference agrees with the MET status of the tumor cell lines used and indicates that 89Zr-PRS-110 is capable of reporting on the relative MET status of imaged tumors. Further evidence for MET dependence was provided by the PRS-110 concentration dependence of H441 tumor uptake of 89Zr-PRS-110. An excess of PRS-110 reduced the tumor uptake by a factor of 2.6 because of saturation of the MET receptor. In the case of MET-driven tumor uptake, one would expect a similar result for 89Zr-PRS-110 at tumor-saturating amounts of total PRS-110, compared with the negative control 89Zr-Tlc-PEG in the same tumor model; this is indeed the case. In the initial biodistribution experiment, the tumor uptake of 10 μg of 89Zr-PRS-110 in the presence of 490 μg of unlabeled PRS-110 was 2.93 ± 0.89 %ID/g, whereas 50 μg of 89Zr-Tlc-PEG in the same tumor model led to a tumor uptake of 3.90 ± 0.84 %ID/g. In the MET-positive H441 and U87-MG tumors, we found uptake of 89Zr-PRS-110 in the lung, which occurred neither in the MET-negative A2780 tumor with 89Zr-PRS-110 nor in any of the 3 xenografts with the negative control 89Zr-Tlc-PEG. The lack of uptake in the absence of MET and for the nonbinding control suggests a MET-driven mechanism of uptake in the lung (possibly metastasis), which warrants further investigation.
Imaging of H441 tumor–bearing mice revealed that tumor uptake was near its maximum 24 h after tracer injection and remained nearly constant up to 96 h. In agreement with the half-life of PRS-110 in mice (30 h) (7), the nonspecific activity in the blood and other organs decreased over time, leading to further increasing tumor-to-organ ratios. This increase of tumor-to-organ ratios indicates internalization and retention of the accumulated 89Zr in the tumor in vivo, in line with our in vitro studies. Intracellular uptake in vivo was further confirmed by a biodistribution experiment using fluorescently labeled PRS-110 and ex vivo fluorescence microscopy analysis of paraffin-embedded tumor slices.
For this new radiopharmaceutical, the optimal time point for clinical imaging will need to be determined in a phase I clinical imaging study. On the basis of the current preclinical findings, it is anticipated that the optimal time point for tumor imaging in a clinical setting may be within 48–96 h after tracer injection. This assumption is based on experiences with antibody imaging of 89Zr-bevacizumab and 89Zr-trastuzumab, for which the optimal time point of scanning in preclinical models—between 72 and 144 h (9,11)—translates to optimal clinical antibody imaging 96 h after tracer injection (10,12). 89Zr-PRS-110 may therefore allow earlier imaging than conventional antibodies. Further studies are warranted to clarify the optimal balance between tracer half-life, radioactive PET isotope half-life, and imaging capability, which could exploit the straightforward tuning of the half-life of PRS-110 via a changed PEG moiety.
The preclinical evaluation of the radiolabeled MET anticalin, 89Zr-PRS-110, shows that it can be used for noninvasive PET imaging to determine MET status in vivo and to monitor tumor-to-organ distribution of PRS-110. However, nonspecific uptake of 89Zr-PRS-110 in MET-negative tumors, and of 89Zr-Tlc-PEG in MET-positive tumors, was observed. This effect is also evident for antibody-based imaging molecules (9,11,17) and is generally considered to be caused by the enhanced permeability and retention effect (17). The clinical application of 89Zr-PRS-110 will therefore require a protocol suitable for correction of nonspecific uptake. In analogy to the blocking experiment described in the present work, this correction could be enabled by imaging before and during treatment with the nonlabeled drug, an approach we are currently investigating in clinical imaging trials with antibody-based tracers (clinicaltrials.gov ID NCT01482377 and NCT01832116). In the clinical setting, tumor signals of 89Zr-PRS-110 may be influenced by HGF produced by paracrine or autocrine routes due to competition of HGF and PRS-110 for their target, MET. In the current preclinical study, PRS-110 was competing only with human HGF produced by human tumor cells for the binding to MET because murine HGF does not cross-react with human MET (20). However, we still expect significant specific uptake, because PRS-110 has higher affinity for MET than HGF (7,21,22).
Previous preclinical studies have also assessed MET-targeted imaging agents and demonstrated potential utility. With SPECT imaging, human U87-MG tumor–bearing mice could be visualized with 125I-labeled MET-binding peptides (23). Moreover, 125I-labeled Met3 and Met5 antibodies were tested in a panel of human and canine cancer xenografts and showed qualitatively similar SPECT images in mice (24). These tumor visualization results became more explicit using the residualizing (intracellularly retained) radionuclide 89Zr for PET imaging. PET imaging experiments with the monoclonal antibody DN30, labeled with 89Zr or 124I, showed that 89Zr-DN30 tumor uptake was much higher than iodine-labeled DN30 in GLT-16 and FaDu xenograft models, indicating internalization of DN30 and residualization of 89Zr (25). Onartuzumab (MetMAb), a one-armed antibody with ligand-dependent activity, labeled with 76Br or 89Zr (76Br-MetMAb and 89Zr-Df-MetMAb) showed specific uptake and slow clearance of both tracers in imaging and biodistribution studies in tumor xenografts (19). As observed with other antibodies, maximal tumor accumulation took up to 120 h for 89Zr-Df-MetMAb.
89Zr-Df-MetMAb and 89Zr-PRS-110 share the advantage of being monovalent and non–MET-activating radiotracers. We can compare the utility of both molecules in imaging using the biodistribution data obtained for the highly MET-expressing tumors used in both studies (MKN-45 vs. H441). With 89Zr-PRS-110, the absolute tumor uptake (7.5 %ID/g) at 96 h after 10 μg of tracer injection was significantly lower than for 89Zr-Df-MetMAb (∼19 %ID/g). However, the ratios of tumor to blood (4.4 vs. ∼3), tumor to liver (2.5 vs. ∼3), and tumor to muscle (29:1 vs. 27:1, the latter at 5 d after injection) were comparable for PRS-110 and labeled MetMAb. The relative nonspecific uptake—as determined in a blocking experiment—was higher for 89Zr-PRS-110 than 89Zr-Df-MetMAb (39% vs. 26%) but still in a comparable range. Although a direct comparison is complicated by the different tumor models used and a variation in techniques, the data indicate a similar performance of 89Zr-PRS-110 and 89Zr-Df-MetMAb in highly MET-positive xenografts.
Multiple drug-development programs are focused on targeting the HGF–MET pathway in human cancer. Currently, several MET-focused trials are stratifying patients based on immunohistochemistry (26,27), which has proven useful for onartuzumab. In a randomized phase II study assessing the combination of onartuzumab with erlotinib, progression-free survival and overall survival improved in non–small cell lung cancer patients with tumors overexpressing MET (based on immunohistochemistry) (26). A major drawback of immunohistochemistry is the fact that tumor tissue is required, and the information provided is limited to the biopsied part of the tumor lesions analyzed. The plasticity of MET expression, potential heterogeneity at different tumor sites, and subjective nature of immunohistochemistry scoring further supports the notion that an imaging agent capable of real-time MET monitoring may be a useful tool (28,29). To select patients up front, stratify patient populations, and inform dosing regimens, molecular imaging with MET-targeting tracers could give information of whole-body MET status in all lesions. The evaluation of 89Zr-PRS-110 presented in this work indicates that it is feasible to assess MET status of the tumor, with a correlation between-signal intensity and receptor expression. Therefore, molecular imaging with 89Zr-PRS-110 could support the selection of patients for MET-targeting drugs and inform treatment decisions in the future.
CONCLUSION
In different preclinical models, 89Zr-PRS-110 small-animal PET was shown to image and inform about in vivo MET tumor status. 89Zr-PRS-110 is a novel radiopharmaceutical that has potential utility in the selection and monitoring of patients for MET therapy.
DISCLOSURE
The costs of publication of this article were defrayed in part by the payment of page charges. Therefore, and solely to indicate this fact, this article is hereby marked “advertisement” in accordance with 18 USC section 1734. This study was supported by grant RUG 2010-4603 of the Dutch Cancer Society, grant 01EX1122 from the German Federal Ministry of Education and Research within the Leading-Edge Cluster “m4—Personalized Medicine” in Munich, and a research grant from Pieris AG. Shane A. Olwill, Andrea Allersdorfer, Martin Hülsmeyer, Marlon J. Hinner and Laurent Audoly are (or were) employees of Pieris AG. No other potential conflict of interest relevant to this article was reported.
Acknowledgments
We thank Linda Pot, Silke Vedelaar, Arjan Kol, and Goutham Mallavarapu for the technical assistance.
Footnotes
Published online Mar. 10, 2014.
- © 2014 by the Society of Nuclear Medicine and Molecular Imaging, Inc.
REFERENCES
- Received for publication April 17, 2013.
- Accepted for publication November 20, 2013.


Jump to section
Related Articles
Cited By...
- Emerging Opportunities for c-MET Visualization in the Clinic
- Biodistribution and PET Imaging of Labeled Bispecific T Cell-Engaging Antibody Targeting EpCAM
- c-Met PET Imaging Detects Early-Stage Locoregional Recurrence of Basal-Like Breast Cancer
- Feasibility of Affibody-Based Bioorthogonal Chemistry-Mediated Radionuclide Pretargeting
- ADAPT, a Novel Scaffold Protein-Based Probe for Radionuclide Imaging of Molecular Targets That Are Expressed in Disseminated Cancers
- PET of c-Met in Cancer with 64Cu-Labeled Hepatocyte Growth Factor