


Abstract
Only a subset of patients with head and neck squamous cell carcinomas (HNSCCs) benefit from radiotherapy and concurrent epidermal growth factor receptor (EGFR) inhibitor therapy with cetuximab, indicating the need for patient selection. The aim of this study was to visualize the change in systemically accessible EGFR with 111In-cetuximab-F(ab′)2 SPECT before and after radiotherapy, while simultaneously evaluating 18F-FDG PET uptake. Methods: Mice with HNSCC xenografts, cetuximab-sensitive SCCNij202 and cetuximab-resistant SCCNij167, were imaged with SPECT/CT using 111In-cetuximab-F(ab′)2 as a tracer, directly followed by PET imaging with 18F-FDG. Scans were acquired 7 d before radiotherapy (10 Gy) and 1, 7, and 14 d after treatment. Intratumoral localization of 111In-cetuximab-F(ab′)2 was evaluated by autoradiography and histologic markers evaluated by immunofluorescence staining in the same tumor sections. Results: Growth of irradiated SCCNij202 and SCCNij167 tumors was significantly delayed, compared with controls (P < 0.05). No changes in uptake of 18F-FDG were observed in either of the xenografts after radiotherapy. SPECT images of tumor-bearing mice showed a significant increase in uptake of 111In-cetuximab-F(ab′)2 in the SCCNij202 tumors after irradiation (tumor-to-liver ratio, 4.3 ± 1.1 vs. 10.5 ± 3.3, 7 d before and 14 d after treatment, respectively, P < 0.01) but not in SCCNij167 tumors. Immunohistochemical EGFR staining showed a translocation of the EGFR from the cytoplasm to the cell membrane in irradiated SCCNij202 xenografts. Intratumoral distribution of 111In-cetuximab-F(ab′)2 as determined by autoradiography correlated well with the distribution of EGFR as determined immunohistochemically (r = 0.85; range, 0.69–0.95). Conclusion: EGFR accessibility can be visualized with 111In-cetuximab-F(ab′)2. 111In-cetuximab-F(ab′)2 uptake increased after irradiation only in cetuximab-sensitive SCCNij202 xenografts, implying that the tracer can be used to measure irradiation-induced changes of EGFR expression and can monitor the compensatory response of tumors to radiotherapy.
The treatment of head and neck squamous cell carcinoma (HNSCC) has been significantly improved by adding the epidermal growth factor receptor (EGFR) inhibitor cetuximab to radiotherapy. However, only a subset of patients responded to therapy, whereas all patients were subject to a significant degree of toxicity (1,2). There are multiple pathways contributing to treatment resistance in HNSCC, a prominent factor being the substantial overexpression of EGFR related to enhanced proliferation, DNA repair, and cell growth (3–5). Several intrinsic prognostic markers have been identified as predictive markers in response to EGFR inhibition, including human papillomavirus (6,7), EGFR protein expression (8,9), and EGFR copy number (10,11), though research focuses on colorectal cancer and non–small cell lung cancer predominantly (12,13). In HNSCC, EGFRvIII, hypoxia, proliferation, and tyrosine kinase receptors have been studied as potential predictive markers for response to radiotherapy; however, no definite marker for response to EGFR-directed therapy has been found (14,15). Furthermore, early response markers are of interest to predict treatment efficacy of EGFR inhibitors, allowing for further personalized treatment. Hence, there is a continued need for the development of EGFR inhibitor–specific markers. Imaging biomarkers are suitable candidates because they have the distinct advantage over most cellular techniques in that they are noninvasive and provide information about the entire tumor volume (including metastatic disease) and allow estimation of systemically accessible targets on tumor cells. Additionally, imaging allows repeated measurements during treatment, generating patient-specific response information. 18F-FDG PET/CT has become a useful tool for detection and staging in HNSCC (16). So far, clinical outcome and early therapeutic response have been related to 18F-FDG PET/CT and more recently 18F-3′-deoxy-3′-18F-fluorothymidine and 18F-fluromisonidazole for treatment with radiochemotherapy (17–20), but little is known about prediction if radiotherapy is combined with EGFR inhibitors. Many possibilities have been investigated for facilitating imaging of EGFR by PET and SPECT (21) in search for prognostic and predictive markers, but it has not yet been proven clinically relevant.
In previous work, a preclinical SPECT tracer, 111In-cetuximab-F(ab′)2, which can visualize the EGFR in HNSCC xenografts, was developed (22,23). Of these xenografts, responsiveness was evaluated designating SCCNij202 as sensitive and SCCNij167 as resistant, showing high tracer versus low tracer uptake, respectively (14). It remains to be investigated whether the tracer could be used to predict response to radiotherapy or predict/monitor sensitivity toward EGFR inhibitors. In this study, we longitudinally evaluated mice with SCCNij202 and SCCNij167 xenografts by SPECT/CT and 18F-FDG PET/CT imaging before irradiation with a single dose of 10 Gy, and 1, 7, and 14 d after radiotherapy, allowing visualization of the change in systemically accessible EGFR after irradiation.
MATERIALS AND METHODS
Tumor Models and Treatment
Six- to 10-wk-old athymic BALB/c nu/nu mice were xenografted subcutaneously in the right hind leg with 1 mm3 (∼1 × 10⁶ cells) of the serial-passaged human HNSCC lines SCCNij202 or SCCNij167. Animals were housed in filter-topped cages in a specific-pathogen-free unit in accordance with institutional guidelines. Experiments started 14 d (SCCNij202) or 28 d (SCCNij167) after transplantation. The Animal Welfare Committee of the Radboud University Medical Center Nijmegen approved the animal experiments.
A single dose of 10 Gy (320 kV; dose rate, 3.8 Gy/min) was delivered to the right hind leg of xenografted mice (X-RAD; RPS Services). A custom-made platform was developed with lead to protect the body from irradiation (scatter) and to keep the mice under general anesthesia (isoflurane/compressed air). The right hind leg was extended from the body and immobilized to ensure adequate irradiation of the tumor. Dosimetric evaluation revealed an inhomogeneity of less than 5%. Tumor volume was estimated by the following formula: 4/3 π × r1 × r2 × r3.
PET/CT and SPECT/CT Imaging
Twenty mice were evaluated in imaging studies and longitudinally scanned. SCCNij202 (n = 5) and SCCNij167 (n = 5) mice were irradiated with 10 Gy, and 5 mice with the same tumor xenograft served as controls. All mice were scanned 7 d before irradiation and 1, 7, and 14 d after irradiation. One control and 1 experimental mouse with a SCCNij202 tumor each missed 1 time point, −7 and 1 d, respectively.
111In-cetuximab-F(ab′)2 (specific activity, 400 GBq/μmol; radiochemical purity > 95%) was produced as described previously (22). SPECT images were acquired 24 h after intravenous injection in the tail vein with 111In-cetuximab-F(ab′)2 (5 μg, 18 ± 0.7 MBq, 200 μL per mouse) using an ultra-high-resolution animal SPECT/CT scanner (USPECT-II; MILabs). Mice were scanned prone under general anesthesia using the mouse whole-body 1.0-mm-diameter multipinhole collimator tube. SPECT scans were acquired for 60 min, followed by CT scans. Subsequently, mice were injected with 18F-FDG (10 ± 0.3 MBq) (GE Healthcare) in the tail vein via catheter, followed by 100 μL of 0.9% NaCl to flush the catheter. Syringes were measured in a dose calibrator before and after injection. During the 1-h 18F-FDG uptake time, mice were kept under general anesthesia, after which a 20-min PET scan with an Inveon small-animal PET/CT device (Siemens Medical Solutions Inc.) was obtained, followed by an 8-min CT acquisition. The PET scanner had an axial field of view of 12.7 cm and a spatial resolution of 1.4 mm in full width at half maximum. During scans, the body temperature of the mice was kept at 37°C with a heating pad on the scanner bed.
Before final scans—that is, 14 d after irradiation—mice were injected intraperitoneally with bromodeoxyuridine (50 mg/kg; Sigma). One minute before the tumors were harvested, mice were intravenously injected with perfusion marker Hoechst 33342 (15 mg/kg; Sigma-Aldrich). Excised tumors were immediately snap-frozen in liquid nitrogen for autoradiography and immunohistochemical staining purposes.
Immunohistochemistry and Autoradiography
Frozen tumor sections (5 μm) were cut and mounted on poly-l-lysine–coated slides for autoradiography. Slides were exposed to a Fujifilm BAS cassette 2025 overnight (Fuji Photo Film). Phospholuminescence plates were scanned using a Fuji BAS-1800 II bioimaging analyzer at a pixel size of 50 × 50 μm. Images were processed with Aida Image Analyzer software (Raytest).
After autoradiography, the same slides were used for immunohistochemistry. First, tumor sections were fixed in acetone at 4°C for 10 min and scanned for Hoechst 33342 at ×10 magnification for visualization of perfused vessels. Subsequently, slides were rehydrated in phosphate-buffered saline and stained for either EGFR or bromodeoxyuridine, including staining for vessels and nuclei. Primary and secondary antibodies were diluted in primary antibody diluent (Abcam). Between all consecutive steps of the staining process, sections were rinsed 3 times for 5 min in 0.1 M phosphate-buffered saline, pH 7.4 (Klinipath).
After rehydration in phosphate-buffered saline, sections were incubated with goat anti-EGFR antibody 1:50 (Santa Cruz Biotechnology Inc.) and subsequently with donkey antigoat Cy3, 1:600 (Jackson Immunoresearch Inc.). For evaluation of the proliferation index, sections were treated with 2N HCl for 10 min and subsequently neutralized with 0.1 M Borax. After being washed, sections were stained with sheep antibromodeoxyuridine, 1:50 (GeneTex) and donkey antisheep-Cy3, 1:600 (Jackson Immunoresearch Inc.).
To stain the blood vessels, all sections were incubated with undiluted 9F1 supernatant (antimouse endothelium) (24) for 45 min at 37°C, followed by incubation with chicken antirat-Alexa647, 1:100 (Invitrogen Molecular Probes). All nuclei were stained with Hoechst 33342 (0.5 μg/mL), after which slides were mounted in Fluorostab (ICN). One adjacent section per tumor was hematoxylin and eosin stained to help distinguish necrotic areas and nontumor tissue from viable tumor areas.
Image Analysis
SPECT scans were reconstructed with MILabs reconstruction software, using an ordered-subset expectation maximization algorithm with a voxel size of 0.375 mm. SPECT energy windows for 111In were set at low (171 keV) and high (245 keV) at each of the 16 subsets in all 6 iterations. Tumor (max)-to-liver pixel value ratios (Tmax/L) were determined by drawing regions of interest (ROIs) around the tumor and within the liver. Maximum tumor pixel intensity was divided by mean liver uptake (Inveon Research Workplace software, version 4.0; Siemens Preclinical Solutions).
PET images were reconstructed using an ordered-subset expectation maximization 3-dimensional algorithm of 2 iterations, followed by maximum a posteriori (18 iterations, β = 0.05) reconstruction optimized for uniform resolution (Inveon Acquisition Workplace, version 1.5; Siemens Preclinical Solutions). Transaxial pixel size was 0.431 mm, section thickness was 0.796 mm, and image matrix size was 256 × 256 × 159 (25).
Reconstructed images were analyzed with Siemens Inveon Research Workplace software by manually placing ROIs around the tumor. Quantification of tracer uptake in tumor ROIs of the attenuation-corrected slices was obtained by calculating the maximum standardized uptake values (SUVmax) by correcting for the injected activity, injection time (decay), and body weight.
Immunohistochemically stained tumor sections were analyzed using a digital image analysis system, as described previously (26). In short, whole-tissue sections were scanned (magnification, ×10, Axioskop [Zeiss]), and gray-scale images (pixel size, 2.59 × 2.59 μm) were obtained for perfusion, vessels, EGFR, bromodeoxyuridine, and nuclei and subsequently converted into binary images. The amount of positive pixels for vessel staining (vascular density), perfusion (perfusion fraction), and EGFR staining (fraction of EGFR [fEGFR]) was divided by total tumor area using ImageJ software (version 1.43m, JAVA-based image-processing package). The bromodeoxyuridine labeling index was calculated by dividing the nuclear area positive for bromodeoxyuridine staining by the total nuclear area of the tumor. Mean intensity of the EGFR staining was determined by dividing EGFR pixel gray values (range, 0–4,095; 12 bits) by positive EGFR staining area. Thresholds for segmentation of the fluorescent signals were set above the background staining for each marker. Areas of necrosis were excluded from analysis by drawing ROIs.
Colocalization analysis was performed on autoradiography and immunohistochemical gray value images (gray scale range, 0–255). Images were overlaid using Photoshop (CS4, version 11.0.2; Adobe). The pixel and figure size of the immunohistochemistry images were rescaled to match that of the autoradiography images for alignment (50 × 50 μm) and successively upscaled (200 × 200 μm) to compensate for image coregistration errors and scattering of the tracer signal in the autoradiography images. After alignment, ROIs drawn previously for excluding necrosis in immunohistochemical analysis were masked in autoradiography images. Coregistered pixel gray values and overlap coefficients were determined with ImageJ using the JACoP plugin package (27). Positioning accuracy between the autoradiography and immunohistochemistry images was more than 95%.
Statistics
Statistical analyses were performed using Prism software (version 6.0e; GraphPad). Significance was tested with the nonparametric Mann–Whitney test or repeated-measures ANOVA. The nonparametric Spearman or parametric Pearson test was used accordingly, and a P value of 0.05 or less was considered significant. Data are represented as mean ± SD.
RESULTS
Treatment Outcome and Imaging
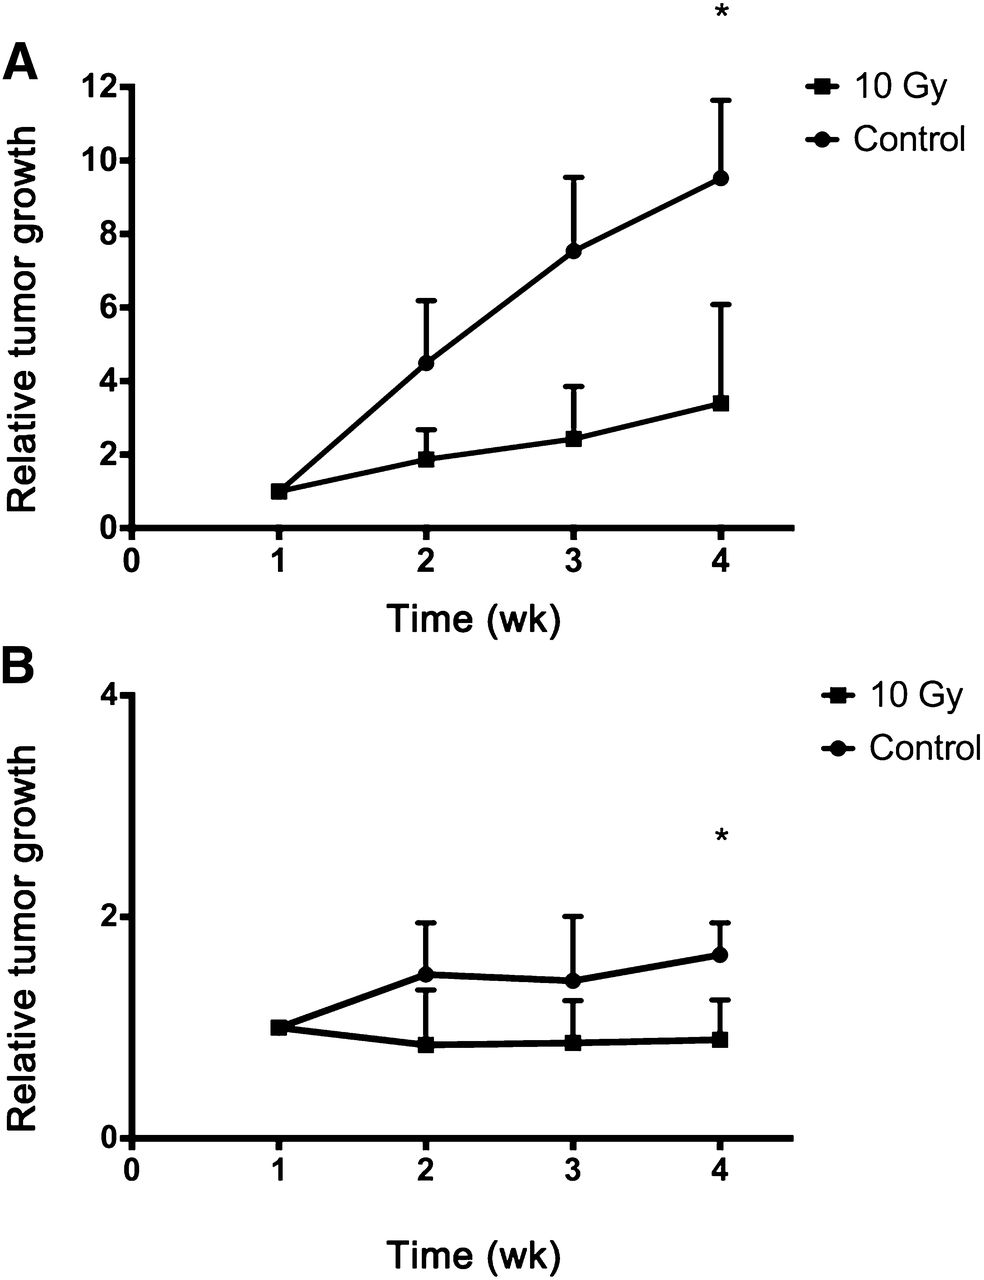
Growth of SCCNij202 and SCCNij167 tumors in mice receiving a single dose of 10 Gy was significantly inhibited as compared with untreated controls (P < 0.05) (Fig. 1).

Relative tumor volume measured between −7 d (week 1) and 14 d (week 4) after irradiation for SCCNij202 (A) and SCCNij167 (B) in controls and irradiated (10 Gy) groups. Values represent mean ± SD. *P < 0.05.
SPECT/CT images showed a clear increase in 111In-cetuximab-F(ab′)2 tumor uptake in irradiated SCCNij202 mice (Fig. 2; Supplemental Table 1 [supplemental materials are available at http://jnm.snmjournals.org]) independent of tumor size (r = 0.36). Analysis of the small-animal SPECT scans revealed a Tmax/L of 4.3 ± 1.1 versus 10.5 ± 3.3, 7 d before and 14 d after treatment, respectively (ANOVA, P < 0.001) (Fig. 3B). SCCNij202 control groups exhibited an increase in tumor size, and Tmax/L ratios did not change during the experiment. The baseline Tmax/L ratio differed between both xenografts before treatments, the Tmax/L for SCCNij202 being significantly higher (4.3 ± 1.1 vs. 2.1 ± 0.6, P < 0.0001). One day after a single dose of 10 Gy, no difference was found between control and experimental groups for both xenografts. Tmax/L in SCCNij167 did not change for treated mice up to 14 d after irradiation, though a significant increase was found at 14 d after treatment for control mice (P < 0.05), compared with initial Tmax/L at day −7. However, there was no significant incline when evaluating all scans from day −7 until day 14 (ANOVA, P = 0.21).

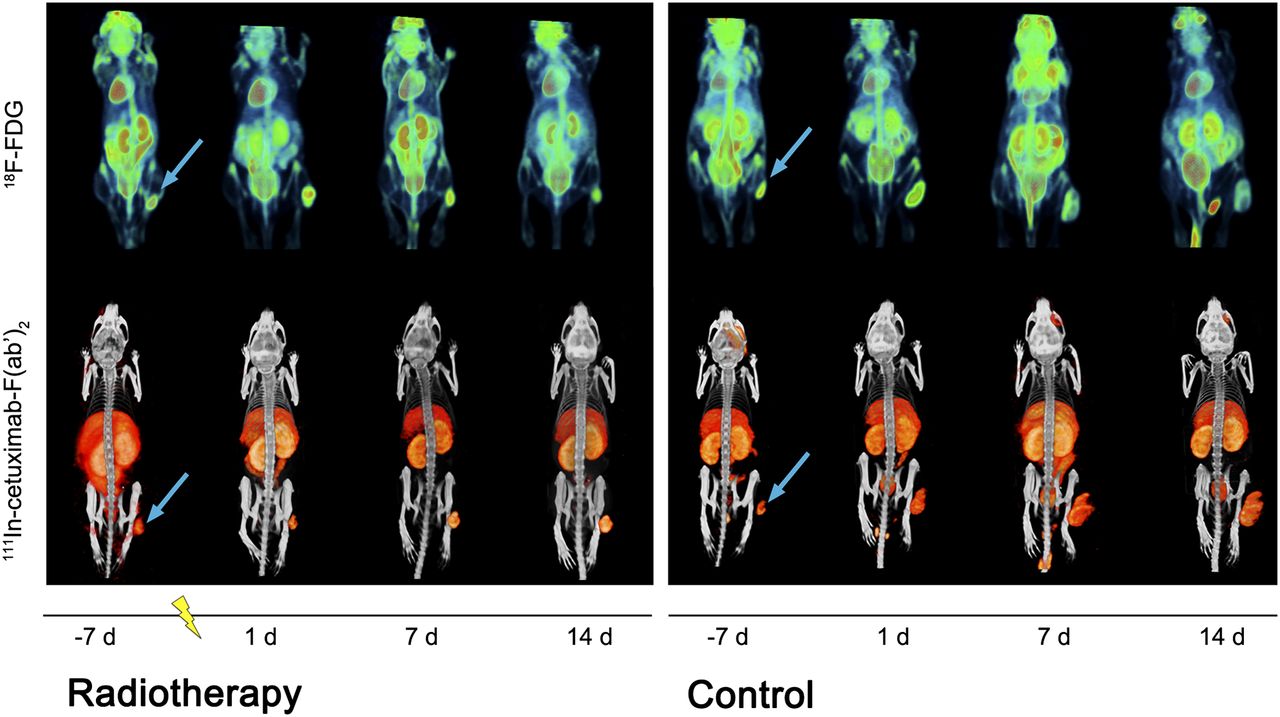
Longitudinal visualization with 18F-FDG PET imaging and 111In-cetuximab-F(ab′)2 SPECT imaging in irradiated and control SCCNij202 mice at day −7, 1, 7 and 14. Images were acquired at 24 and 1 h after injection for SPECT and PET imaging, respectively. Tumors were irradiated at time zero (represented as lightning bolt). Arrow = subcutaneous tumor location in right hind leg.

18F-FDG PET SUVmax (A) and 111In-cetuximab-F(ab′)2 SPECT Tmax/L ratio (B) in SCCNij202 and SCCNij167 xenografts. Values represent mean ± SD. *P < 0.05. **P < 0.001.
18F-FDG PET images were analyzed quantitatively by determining the SUVmax (Supplemental Table 1). Unirradiated SCCNij167 had a higher SUVmax than unirradiated SCCNij202 (P < 0.0001). Up to 14 d after irradiation, treatment did not significantly affect 18F-FDG SUVmax in SCCNij167 and SCCNij202 (Figs. 2 and 3B). 18F-FDG uptake (SUVmean and SUVmax) did not correlate to tumor volume or fEGFR (data not shown).
Immunohistochemistry and Autoradiography
Intratumoral distribution of 111In-cetuximab-F(ab′)2 as determined by autoradiography correlated well with the immunohistochemical distribution of EGFR for both unirradiated and irradiated tumors in SCCNij202 and SCCNij167 (14 d after irradiation; r = 0.85; range, 0.69–0.95) (Fig. 4). The fEGFR in control groups was significantly higher for SCCNij202 (0.86 ± 0.01) than SCCNij167 (0.07 ± 0.03) (P < 0.01). Staining patterns in SCCNij202 xenografts revealed a trend of increased intensity in the membranes and less cytoplasmatic staining of irradiated xenografts as compared with controls (2,260 ± 432 and 1,949 ± 216, respectively) (Fig. 5) though control mice had a slightly higher fEGFR mice in the irradiated group (P < 0.05) (Fig. 6). In SCCNij167, positive EGFR staining areas were too small to determine statistical significance of the fractions per treatment group.

Example of autoradiography image of SCCNij202 (A) and corresponding EGFR immunofluorescence staining (red) and vessels (blue) (magnification, ×10) (B). (C) Intratumor distribution of 111In-cetuximab-F(ab′)2 as determined by autoradiography correlated well with immunohistochemical distribution of EGFR (r = 0.85; range, 0.69–0.95). Round symbols = unirradiated tumors; square symbols = irradiated tumors.
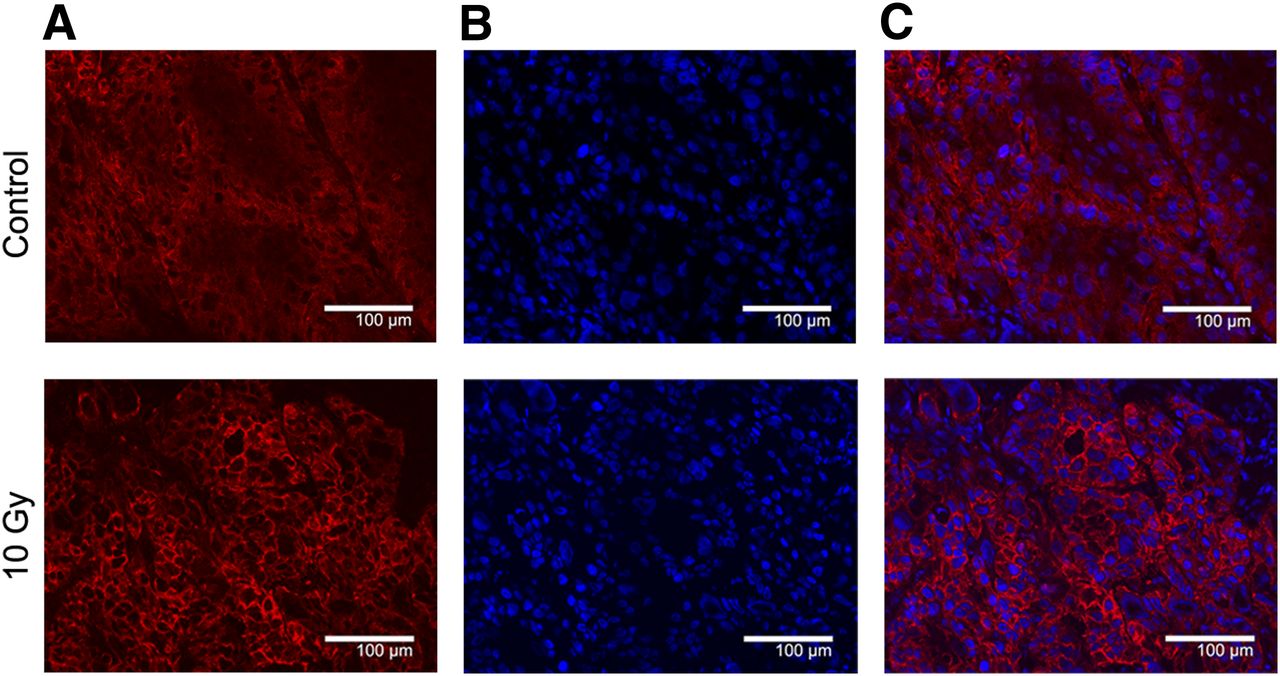
Typical example of EGFR immunofluorescent staining (A), nuclei (B), and combination image (C) of control and 10-Gy irradiated SCCNij202 tumor. Control xenografts display predominantly cytoplasmatic staining whereas irradiated xenografts show increased membranous staining intensity. Magnification, ×200.

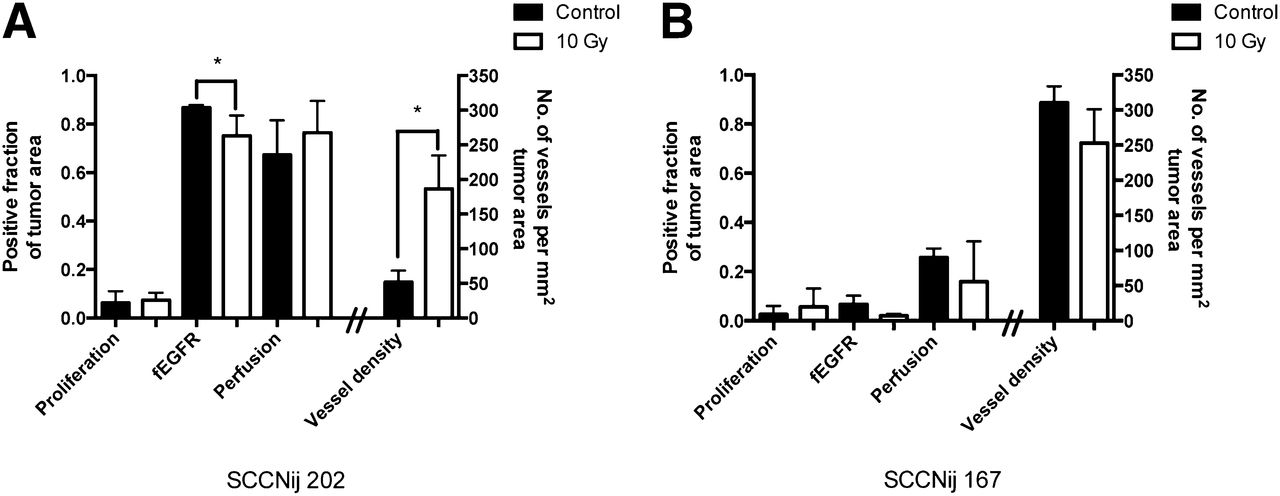
Immunofluorescent markers evaluated for SCCNij202 (A) and SCCNij167 (B) for control and irradiated groups. Markers were proliferation fraction (BrdUrd), fEGFR, fraction of perfused vessels (Hoechst), and vessel density per mm2 (9F1). Values are presented as mean ± SD. *P < 0.05.
In untreated SCCNij202 xenografts, vascular density was low (52 ± 17 per mm2 tumor area), but perfusion fraction was high (0.7 ± 0.1). This was in contrast to SCCNij167, which showed high vessel density (310 ± 23 per mm2 tumor area) and a low perfusion fraction (0.3 ± 0.04). In irradiated SCCNij202 xenografts, tumors showed an increased vessel density (186 ± 48 per mm2 tumor area) as compared with controls (P < 0.05) though there was no significant correlation between the increased uptake of the tracer (Tmax/L) and immunohistochemically determined vessel density (r = 0.57, P = 0.11). There was no difference in vessel density between SCCNij167-treated and -untreated xenografts. Both xenograft models had a similar bromodeoxyuridine labeling index (0.07 ± 0.04 for SCCNij202 vs. 0.04 ± 0.03 for SCCNij167, P = 0.33). No significant differences were observed between 14-d posttreatment and untreated groups for both xenografts concerning perfusion fraction and proliferation index (Fig. 6).
DISCUSSION
Personalized treatment is becoming of greater importance as new treatment strategies are being developed because of the heterogeneity of tumor characteristics. In this study, we evaluated whether 111In-cetuximab-F(ab′)2 SPECT could visualize and monitor EGFR modulation after irradiation, using a cetuximab-sensitive and cetuximab-resistant HNSCC mouse model. Additionally, we evaluated the application of 18F-FDG PET to monitor the effect of irradiation.
Single-dose irradiation with 10 Gy inhibited tumor growth in SCCNij202 and SCCNij167. The therapeutic effect could not be monitored with 18F-FDG PET; tumor volume did not correlate with 18F-FDG uptake at any time point. Earlier studies in another head and neck tumor model showed a conflicting relation between 18F-FDG uptake and tumor control; Schutze et al. (28) reported that higher 18F-FDG uptake in FaDu xenografts related to a higher control after a single dose of 35 Gy, though this was not supported in a subsequent study by Bruechner et al. (29) as the SUVmax did not reflect the decrease in vital tumor area for tumors treated with 35 Gy. The chosen time points at which 18F-FDG uptake was measured could be of influence because a previous study in a murine squamous cell carcinoma model showed only a significant decrease in uptake 3 d and not 7 d after a single dose of 20 Gy irradiation (30). This is in line with our findings in which no significant differences were seen in 18F-FDG uptake between controls and irradiated mice at 1, 7 and 14 d after irradiation. Additionally, 18F-FDG uptake can be influenced by local inflammation, complicating differentiation between the (residual) tumor and surrounding tissues (31). SCCNij167 tumors had an overall higher SUVmax than SCCNij202 tumors, even though SCCNIj167 tumors are generally smaller and have a longer volume doubling time (14). However, we showed that SCCNij167 has a higher basal proliferation rate and lower tumor perfusion, the latter of which is inversely correlated to 18F-FDG uptake (32).
In contrast, our SPECT/CT data showed a marked increase of 111In-cetuximab-F(ab′)2 uptake only in irradiated cetuximab-sensitive SCCNij202 xenografts up to 14 d after treatment. This increase is at least partly due to the translocation of the EGFR from the cytoplasm to the cell membrane, thereby increasing target availability. By targeting the increased membranous EGFR, the 111In-cetuximab-F(ab′)2 tracer most likely visualizes the compensatory response of the tumors after irradiation. The increase in systemically accessible EGFR also gives a possible explanation for the effectiveness of the EGFR inhibitor cetuximab in this model as described previously (14). We evaluated the translocation by measuring EGFR staining intensity and observed an increase in membranous staining intensity in the irradiated tumors, whereas the total amount of EGFR pixels (binary signal) was slightly reduced in the irradiated tumors, compared with controls. Most likely this was due to the properties of the fraction analyses because the relative positive surface area decreases as the density at the cell membrane increases. Previous studies have shown that cancer cells upregulate the EGFR after irradiation (33). In a study by Eicheler et al. in SCC UT-SCC-14 cancer cells, a similar increase in membranous EGFR expression was observed between 6 and 24 d after fractionated irradiation (34).
We investigated whether tracer uptake changes could be due to a change in microvascular density or tumor blood perfusion by evaluating these parameters immunohistochemically. In SCCNij202, microvascular density was elevated 14 d after treatment and the fraction of perfused vessels remained the same, indicating an increase in tumor blood perfusion. Radiation is known to induce EGFR signaling, possibly resulting in upregulation of vascular endothelial growth factor, stimulating growth of poorly differentiated vessels (35–38). However, we found no correlation between the increased perfusion and increase in uptake of 111In-cetuximab-F(ab′)2. SCCNij167 did not show a similar increase in 111In-cetuximab-F(ab′)2 uptake in treated tumors, and overall uptake remained low. Reduced tracer uptake after irradiation could be due to low vessel density and poor perfusion of the tumor (39,40), but there was no difference in vessel density or perfusion between irradiated and control SCCNij167 tumors. Additionally, autoradiography analysis revealed a good correlation with immunohistochemical EGFR localization in both treated and untreated SCCNij202 and SCCNij167 xenografts, highlighting the ability of this tracer to monitor systemically available EGFR during therapy.
CONCLUSION
We have shown that the change in EGFR accessibility induced by irradiation can be visualized with 111In-cetuximab-F(ab′)2. The cetuximab-responsive SCCNij202 showed a significant increase in tracer uptake, possibly related to the translocation of cytoplasmatic EGFR to the cell membrane. Cetuximab-resistant SCCNij167 did not show an increased uptake of 111In-cetuximab-F(ab′)2 after irradiation. These findings suggest that 111In-cetuximab-F(ab′)2 can be used to measure radiation-induced changes of EGFR expression and thus could monitor the compensatory response of tumors to radiation treatment and potentially aid in EGFR inhibitor response prediction.
DISCLOSURE
The costs of publication of this article were defrayed in part by the payment of page charges. Therefore, and solely to indicate this fact, this article is hereby marked “advertisement” in accordance with 18 USC section 1734. This study was financially supported by a research grant from the Dutch Cancer Society (KUN 2010-4688). No other potential conflict of interest relevant to this article was reported.
Acknowledgments
We thank Bianca Lemmers-de Weem, Kitty Lemmens-Hermans, Iris Lamers-Eleman, and Henk Arnts (Radboud University Medical Center) for their technical assistance.
Footnotes
Published online Sep. 18, 2014.
- © 2014 by the Society of Nuclear Medicine and Molecular Imaging, Inc.
REFERENCES
- Received for publication April 15, 2014.
- Accepted for publication July 29, 2014.


